
-
Original research article
- Chemical characteristics of agricultural groundwater with different land use type and season in Gyeong-buk Province from 2021 to 2024
- Jong-Hee Shin, Yeon-Gyu Jeong, Hye-Rin Jeong, Yong-Chan Kim, Jung-Gi Ryu
- To determine the suitability of groundwater quality for agricultural use in the Gyeong-buk Province, the chemical properties of groundwater were analyzed from …
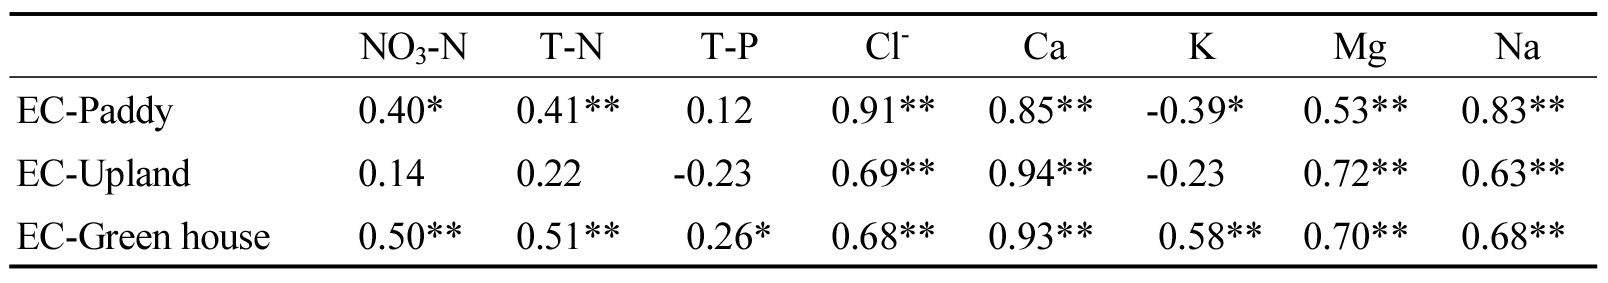
- To determine the suitability of groundwater quality for agricultural use in the Gyeong-buk Province, the chemical properties of groundwater were analyzed from 2021 to 2024. pH, electric conductivity (EC), total nitrogen (T-N), total phosphorus (T-P), nitrate nitrogen (NO3-N), chloride ion (Cl-), sodium (N), magnesium (Mg), potassium (K), and calcium (Ca) were measured in April and July every year and analyzed by land use type. Ca and T-P showed little differences regardless of the type of land use. The T-N in upland fields was lower compared to other land use types, but the pH was higher. The concentrations of Cl-, Na, Mg, K, and Ca in groundwater were highest in the greenhouse fields, but there was no clear differences between year-to-year or April and July. NO3-N and Cl- concentrations maintained good water quality that did not exceed the agricultural groundwater standard for four years. The pH also met agricultural standards during the survey period, as it recorded pH 5.8, below the standard, at just one point of the water sample taken from green house in April 2023. The results obtained in the study implying that agricultural groundwater in Gyeong-buk Province was generally suitable for agricultural purpose. Correlation between chemical properties and EC of agricultural groundwater by land use type in Gyeong-buk Province. NO3-N T-N T-P Cl- Ca K Mg Na EC-Paddy 0.40* 0.41** 0.12 0.91** 0.85** -0.39* 0.53** 0.83** EC-Upland 0.14 0.22 -0.23 0.69** 0.94** -0.23 0.72** 0.63** EC-Green house 0.50** 0.51** 0.26* 0.68** 0.93** 0.58** 0.70** 0.68** - COLLAPSE
-
Original research article
- Correlation between soil properties and growth of wild-simulated ginseng for site suitability assessment
- Kiyoon Kim, Yeong-Bae Yun, Myeongbin Park, Yurry Um
- Wild-simulated ginseng (Panax ginseng C.A. Meyer) is typically cultivated in forest environments for more than 7 years, and up to over …
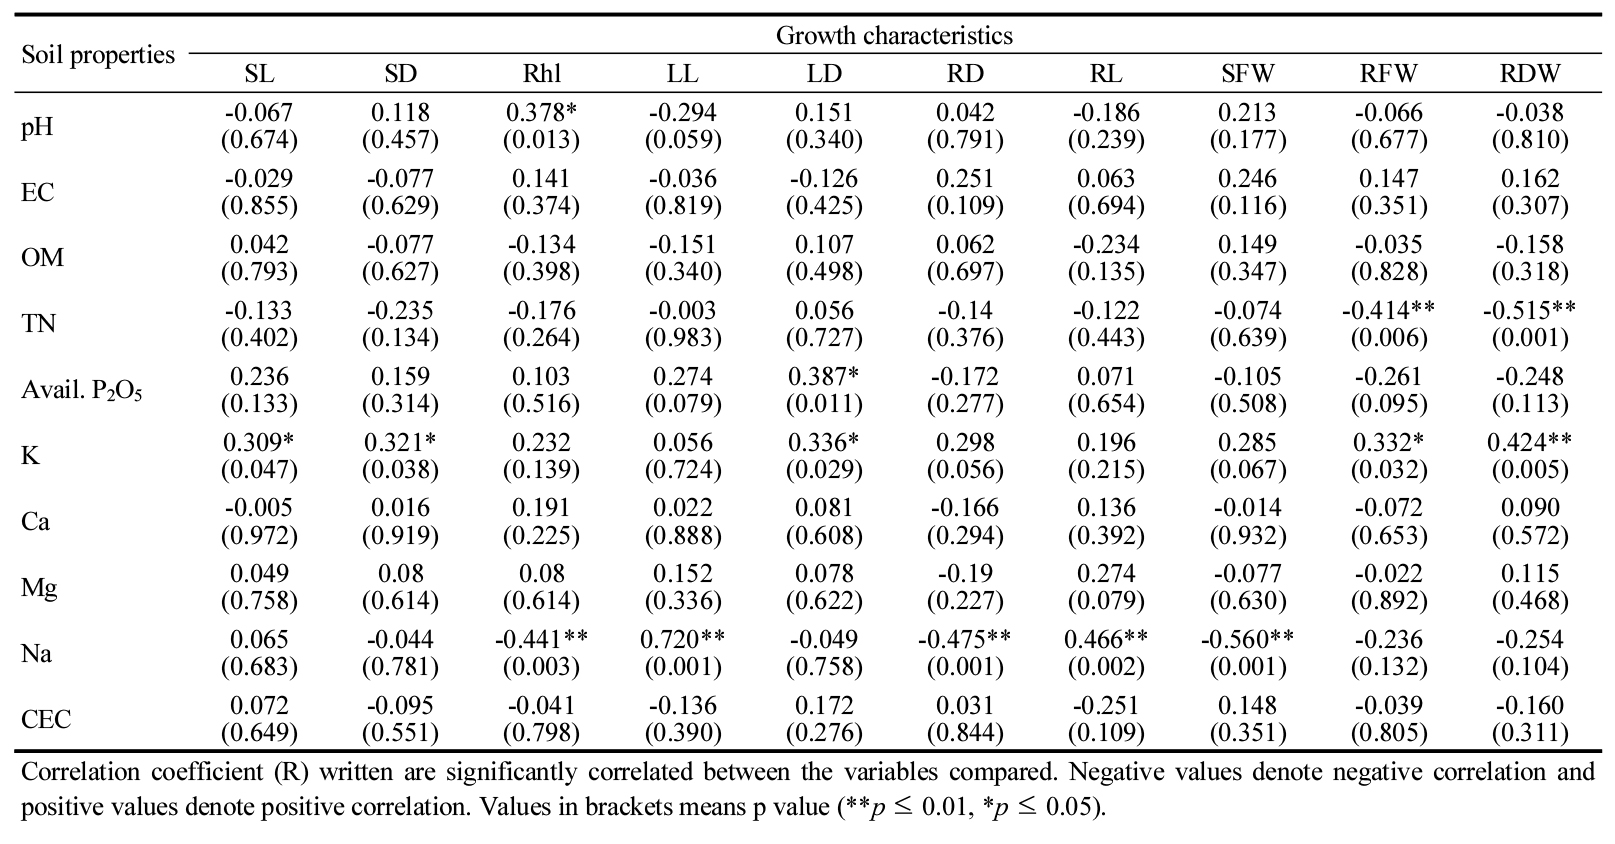
- Wild-simulated ginseng (Panax ginseng C.A. Meyer) is typically cultivated in forest environments for more than 7 years, and up to over 20 years, following principles of pesticide- and fertilizer-free management. This study was conducted to identify suitable cultivation sites for wild-simulated ginseng by analyzing the correlation between the growth characteristics of 7- and 13-year-old wild-simulated ginseng and the soil properties of their cultivation sites. The contents of organic matter and total nitrogen in the rhizosphere soil significantly decreased as the cultivation period increased. Correlation analysis revealed a significant negative relationship between root growth characteristics of wild-simulated ginseng and these soil components. The results of this study confirm that organic matter and total nitrogen are significantly correlated with the growth of wild-simulated ginseng, suggesting that these factors may serve as important indicators for selecting suitable cultivation sites. Furthermore, the findings imply that developing soil microbial formulations with high capacities for organic matter decomposition and nitrogen fixation could contribute to establishing sustainable and eco-friendly cultivation techniques for wild-simulated ginseng. The Effect of Soil Properties of Cultivation Sites on the Growth Characteristics of Wild-Simulated Ginseng (Panax ginseng C.A. Meyer). Soil properties Growth characteristics SL SD Rhl LL LD RD RL SFW RFW RDW pH -0.067 (0.674) 0.118 (0.457) 0.378* (0.013) -0.294 (0.059) 0.151 (0.340) 0.042 (0.791) -0.186 (0.239) 0.213 (0.177) -0.066 (0.677) -0.038 (0.810) EC -0.029 (0.855) -0.077 (0.629) 0.141 (0.374) -0.036 (0.819) -0.126 (0.425) 0.251 (0.109) 0.063 (0.694) 0.246 (0.116) 0.147 (0.351) 0.162 (0.307) OM 0.042 (0.793) -0.077 (0.627) -0.134 (0.398) -0.151 (0.340) 0.107 (0.498) 0.062 (0.697) -0.234 (0.135) 0.149 (0.347) -0.035 (0.828) -0.158 (0.318) TN -0.133 (0.402) -0.235 (0.134) -0.176 (0.264) -0.003 (0.983) 0.056 (0.727) -0.14 (0.376) -0.122 (0.443) -0.074 (0.639) -0.414** (0.006) -0.515** (0.001) Avail. P2O5 0.236 (0.133) 0.159 (0.314) 0.103 (0.516) 0.274 (0.079) 0.387* (0.011) -0.172 (0.277) 0.071 (0.654) -0.105 (0.508) -0.261 (0.095) -0.248 (0.113) K 0.309* (0.047) 0.321* (0.038) 0.232 (0.139) 0.056 (0.724) 0.336* (0.029) 0.298 (0.056) 0.196 (0.215) 0.285 (0.067) 0.332* (0.032) 0.424** (0.005) Ca -0.005 (0.972) 0.016 (0.919) 0.191 (0.225) 0.022 (0.888) 0.081 (0.608) -0.166 (0.294) 0.136 (0.392) -0.014 (0.932) -0.072 (0.653) 0.090 (0.572) Mg 0.049 (0.758) 0.08 (0.614) 0.08 (0.614) 0.152 (0.336) 0.078 (0.622) -0.19 (0.227) 0.274 (0.079) -0.077 (0.630) -0.022 (0.892) 0.115 (0.468) Na 0.065 (0.683) -0.044 (0.781) -0.441** (0.003) 0.720** (0.001) -0.049 (0.758) -0.475** (0.001) 0.466** (0.002) -0.560** (0.001) -0.236 (0.132) -0.254 (0.104) CEC 0.072 (0.649) -0.095 (0.551) -0.041 (0.798) -0.136 (0.390) 0.172 (0.276) 0.031 (0.844) -0.251 (0.109) 0.148 (0.351) -0.039 (0.805) -0.160 (0.311) Correlation coefficient (R) written are significantly correlated between the variables compared. Negative values denote negative correlation and positive values denote positive correlation. Values in brackets means p value (**p ≤ 0.01, *p ≤ 0.05). - COLLAPSE
-
Original research article
- Effect of mixed biochar derived from chicken manure and woody biomass on lettuce (Lactuca sativa L.) growth and nutrient use efficiency
- Ikhyeong Lee, Han-Na Cho, Jae-Hyuk Park, Chang-Gon Lee, Ji-Min Song, Ju-Sik Cho, Yong Hwa Cheong, Se-Won Kang
- This study aimed to evaluate the effect of mixed biochar derived from chicken manure and woody biomass (CMBC) on lettuce (Lactuca …
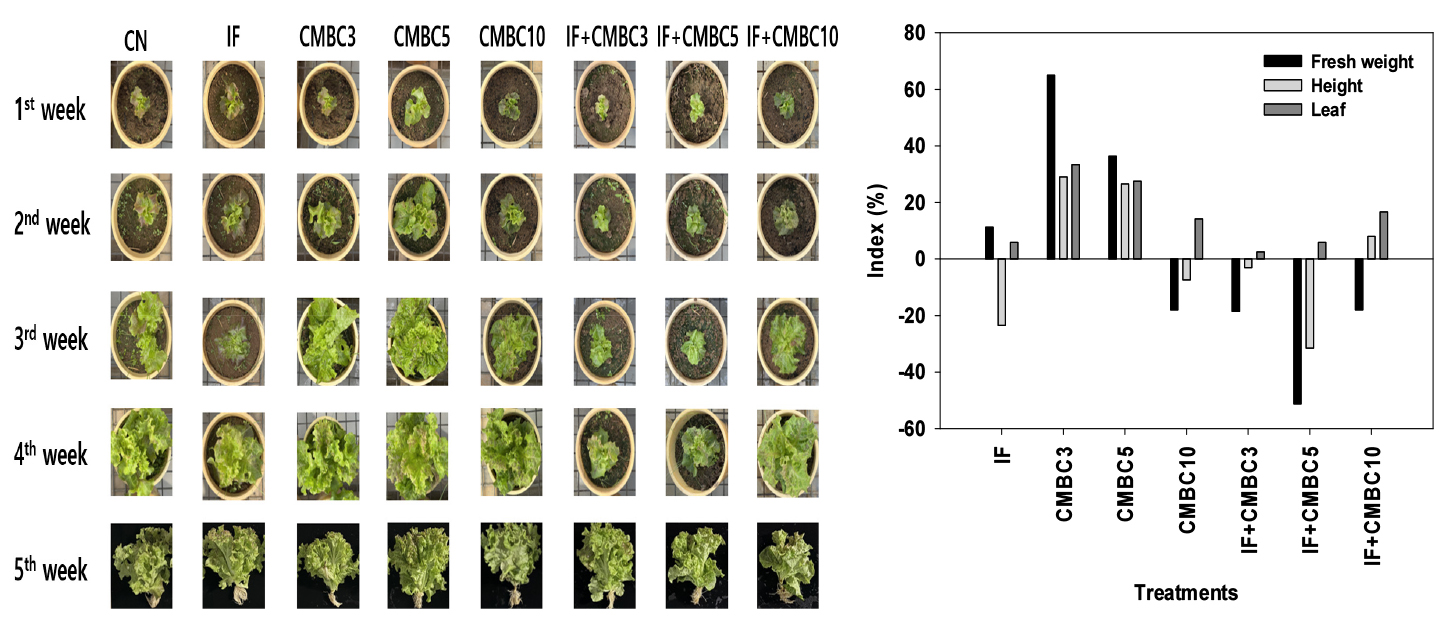
- This study aimed to evaluate the effect of mixed biochar derived from chicken manure and woody biomass (CMBC) on lettuce (Lactuca sativa L.) growth and nutrients use efficiency. The CMBC was produced using chicken manure and woody biomass mixed at ratios (80:20). A pot experiment was conducted to investigate the effects of CMBC application on growth Characteristics and nutrient contents of lettuce and soil fertility. Treatments included CMBC at 3, 5, and 10 Mg ha-1 (CMBC3, CMBC5, and CMBC10), control (CN), inorganic fertilizer (IF) of N 200 kg ha-1, P 59 kg ha-1, K 128 kg ha-1, and combinations of CMBC and IF (IF+CMBC3, IF+CMBC5 and IF+CMBC10). The fresh weight, plant height, and leaf number of lettuce in CMBC3 were increased by 29.5 - 82.6%, 53.1 - 83.7%, and 75 - 95.6%, respectively than those other treatments. The total amounts of N, P, and K were also highest in CMBC3, indicating enhanced availability due to biochar application. Nutrients use efficiency including agronomic efficiency and apparent recovery fraction were also highest in CMBC3, while higher rates or combined treatments showed a decreasing trend. Soil chemical charateristics were increased in pH, EC, exchangeable cations, T-N and O.M with CMBC application, indicating improved soil fertility. These results suggest that low-rate application of CMBC (3 Mg ha-1) is effective as an organic fertilizer. Nevertheless, excessive application rates or the co-application of biochar with inorganic fertilizers may negatively affect nutrient use efficiency and crop performance, highlighting the need for further optimization of fertilization strategies. Growth index of Lettuce by chicken under different chicken manure biochar treatments. - COLLAPSE
-
Original research article
- Quantitative nutrient assessment of agricultural residues from different crop types in Chungcheongnam-do, Korea
- Yeo-Uk Yun, Jin-Il Lee, Jeong Su Lee, Yun-Gi Cho, Jae-Han Lee, Kyo-Suk Lee
- Effective management of crop residues is essential for sustainable agriculture. This study assessed the quantity and nutrient composition of by-products from greenhouse, …
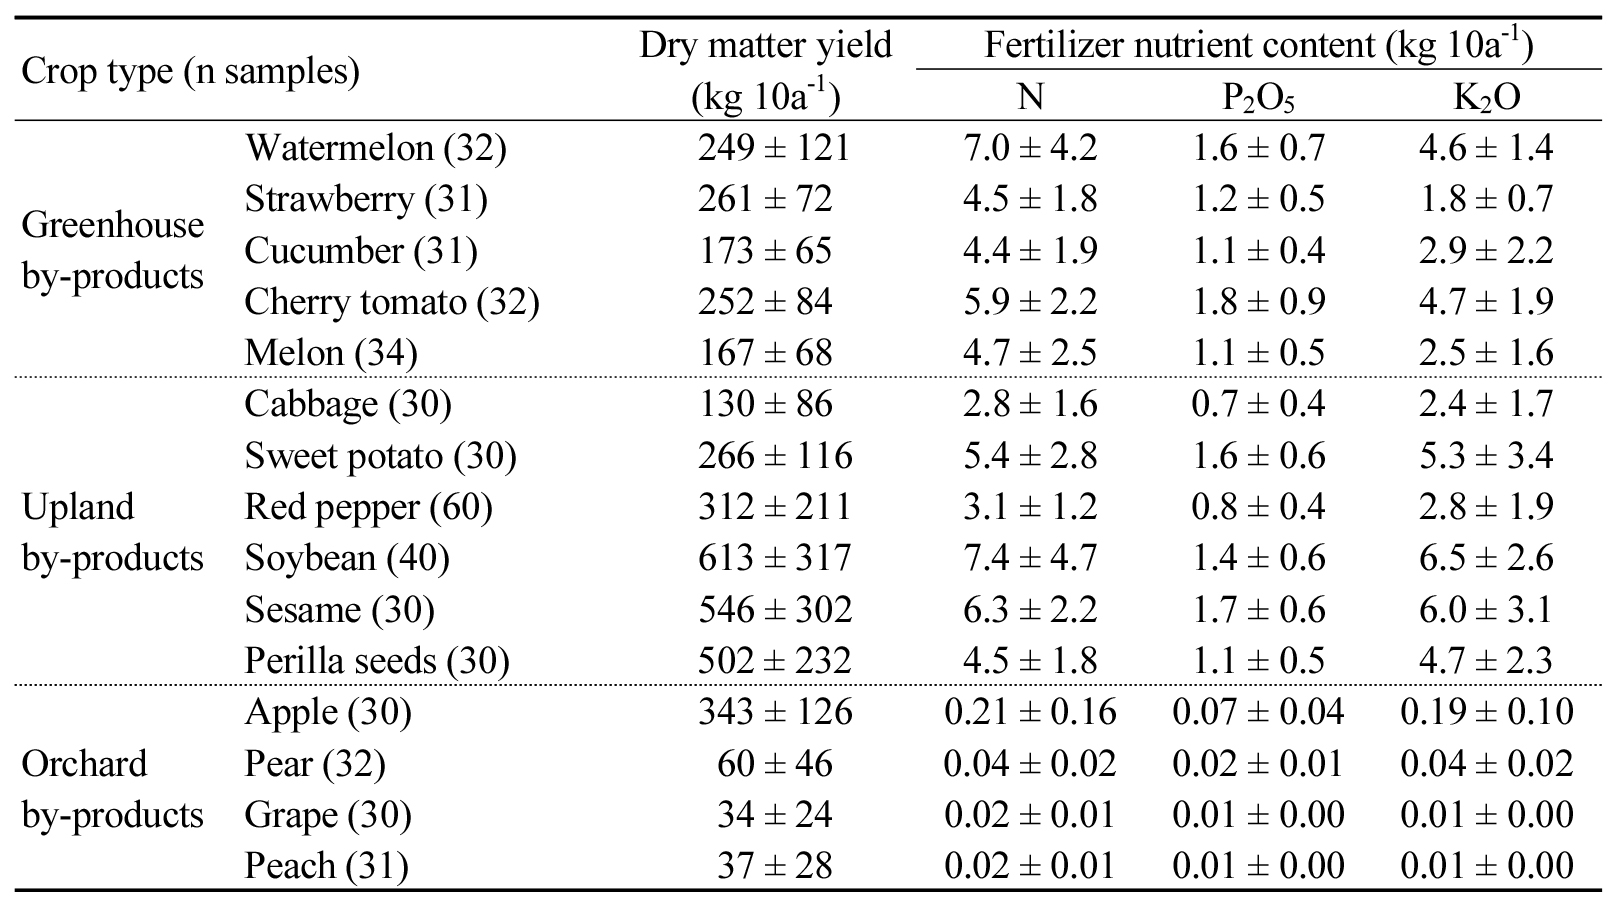
- Effective management of crop residues is essential for sustainable agriculture. This study assessed the quantity and nutrient composition of by-products from greenhouse, upland, and orchard crops in the Chungcheongnam-do region of South Korea based on a survey of 501 farms. Orchard by-products had the highest recycling rate (69.2%), followed by upland (48.6%) and greenhouse crops (44.2%). Residues of watermelon, cucumber, cabbage, and sweet potato had low C/N ratios, while upland and orchard residues with high lignin content showed relatively high C/N ratios, highlighting the need for utilization strategies based on crop-specific C/N characteristics. Leguminous crops such as soybean and sesame contained the highest nutrient concentrations per unit area, suggesting potential as substitutes for organic fertilizers. These findings provide crop-specific data to guide optimized recycling strategies and promote localized circular resource systems. Dry matter yield and nutrient content of agricultural by-products. Crop type (n samples) Dry matter yield (kg 10a-1) Fertilizer nutrient content (kg 10a-1) N P2O5 K2O Greenhouse by-products Watermelon (32) 249 ± 121 7.0 ± 4.2 1.6 ± 0.7 4.6 ± 1.4 Strawberry (31) 261 ± 72 4.5 ± 1.8 1.2 ± 0.5 1.8 ± 0.7 Cucumber (31) 173 ± 65 4.4 ± 1.9 1.1 ± 0.4 2.9 ± 2.2 Cherry tomato (32) 252 ± 84 5.9 ± 2.2 1.8 ± 0.9 4.7 ± 1.9 Melon (34) 167 ± 68 4.7 ± 2.5 1.1 ± 0.5 2.5 ± 1.6 Upland by-products Cabbage (30) 130 ± 86 2.8 ± 1.6 0.7 ± 0.4 2.4 ± 1.7 Sweet potato (30) 266 ± 116 5.4 ± 2.8 1.6 ± 0.6 5.3 ± 3.4 Red pepper (60) 312 ± 211 3.1 ± 1.2 0.8 ± 0.4 2.8 ± 1.9 Soybean (40) 613 ± 317 7.4 ± 4.7 1.4 ± 0.6 6.5 ± 2.6 Sesame (30) 546 ± 302 6.3 ± 2.2 1.7 ± 0.6 6.0 ± 3.1 Perilla seeds (30) 502 ± 232 4.5 ± 1.8 1.1 ± 0.5 4.7 ± 2.3 Orchard by-products Apple (30) 343 ± 126 0.21 ± 0.16 0.07 ± 0.04 0.19 ± 0.10 Pear (32) 60 ± 46 0.04 ± 0.02 0.02 ± 0.01 0.04 ± 0.02 Grape (30) 34 ± 24 0.02 ± 0.01 0.01 ± 0.00 0.01 ± 0.00 Peach (31) 37 ± 28 0.02 ± 0.01 0.01 ± 0.00 0.01 ± 0.00 - COLLAPSE
-
Original research article
- Assessment of temporal trends of water quality in agricultural watersheds of Jeonnam Province using the CCME-WQI
- Soyoun Lee, Hyeonji Kim, Sungwoo Kim, Kyungjin Kwak, Sunkook Kim, Sugju Ko, Byungmo Lee
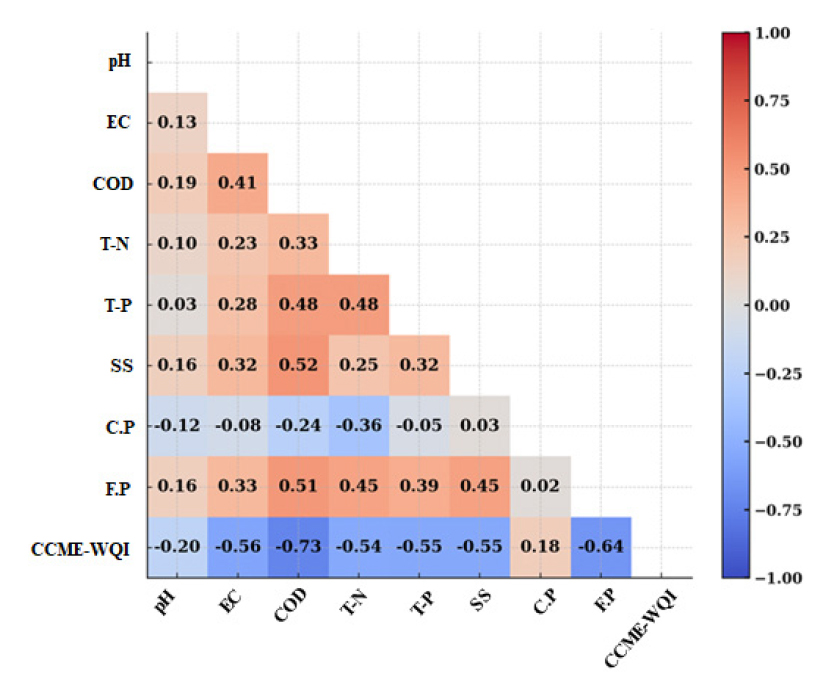
- This study investigated seasonal water quality characteristics and changes in agricultural watersheds of Jeollanam-do from 2021 to 2024 and analyzed their relationships …
- This study investigated seasonal water quality characteristics and changes in agricultural watersheds of Jeollanam-do from 2021 to 2024 and analyzed their relationships with farmland proportion and precipitation using the Canadian Council of Ministers of the Environment Water Quality Index (CCME-WQI). The results showed that during periods of high rainfall, concentrations of COD and SS significantly increased, and water quality deterioration was more pronounced in areas with higher farmland proportions. Strong negative correlations were observed between CCME-WQI and key water quality indicators such as COD, T-N, and T-P, indicating their significant contribution to water quality degradation. These findings suggest that CCME-WQI is a suitable tool for integrated water quality assessment in agricultural watersheds and may can serve as a basis for analyzing pollution sources and establishing effective management strategies under changing agricultural environments. For sustainable water quality management, further investigation of non-point pollution sources and long-term monitoring is recommended. Pearson correlation matrix among CCME-WQI, key water quality parameters, farmland proportion, and cumulative precipitation, based on average values from 2021 to 2024. - COLLAPSE
-
Original research article
- In-situ estimation of available nutrients through real-time monitoring of electrical conductivity in soil
- Su Kyeong Shin, Jwakyung Sung, Jin Hee Park
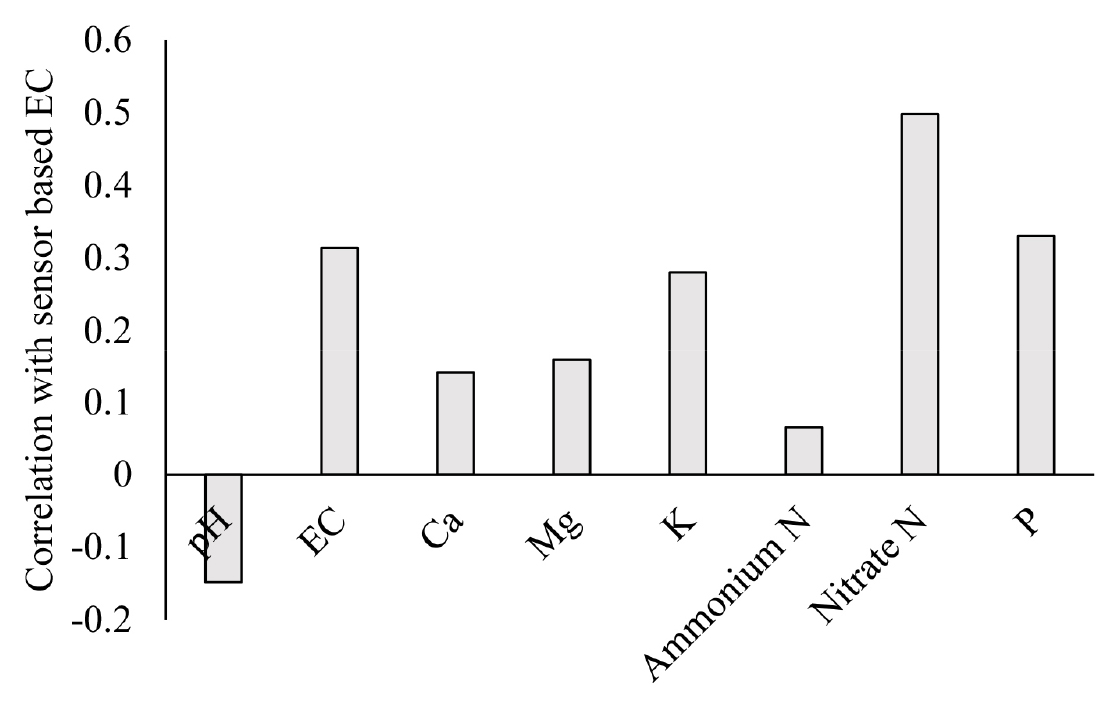
- Nutrient deficiency reduces crop productivity while excessive fertilizer supply leads to environmental pollution. Therefore, appropriate nutrient management for sustainable agriculture is required …
- Nutrient deficiency reduces crop productivity while excessive fertilizer supply leads to environmental pollution. Therefore, appropriate nutrient management for sustainable agriculture is required through continuous monitoring of soil nutrient levels during crop growth. Since there is no real-time monitoring of soil nutrients, application of indirect monitoring using in-situ electrical conductivity (EC) sensor was evaluated. The study aimed to evaluate the correlation between EC values measured by an EC sensor and available nutrients in soil during pepper cultivation. Soil was treated with chemical fertilizer, organic fertilizer and composted livestock manure as basal fertilizer. Urea and potassium chloride were applied as top dressing through fertigation. Soil samples were periodically collected, and nutrients were analyzed. Sensor-based EC value was the highest in soil treated with organic fertilizer, followed by chemical fertilizer and composted livestock manure. Fertigation increased EC while overall EC decreased during pepper growth. Sensor-based EC values showed significant correlation with nitrate in soil with correlation coefficient of 0.5 (p < 0.05). Available phosphorus also showed significant correlation although the coefficient was lower than nitrate. The results indicate that EC sensor can be used as a low-cost and practical means of monitoring available nitrate and phosphate in real-time under field conditions. Correlation coefficient between sensor-based EC and available nutrients in soil. - COLLAPSE
-
Original research article
- Primary drivers of soil loss under conventional potato (Solanum tuberosum L.) cultivation in slope lysimeters of highland agriculture
- Mavis Badu Brempong, Yang-Min Kim, Gye-Ryeong Bak, Jeong-Tae Lee
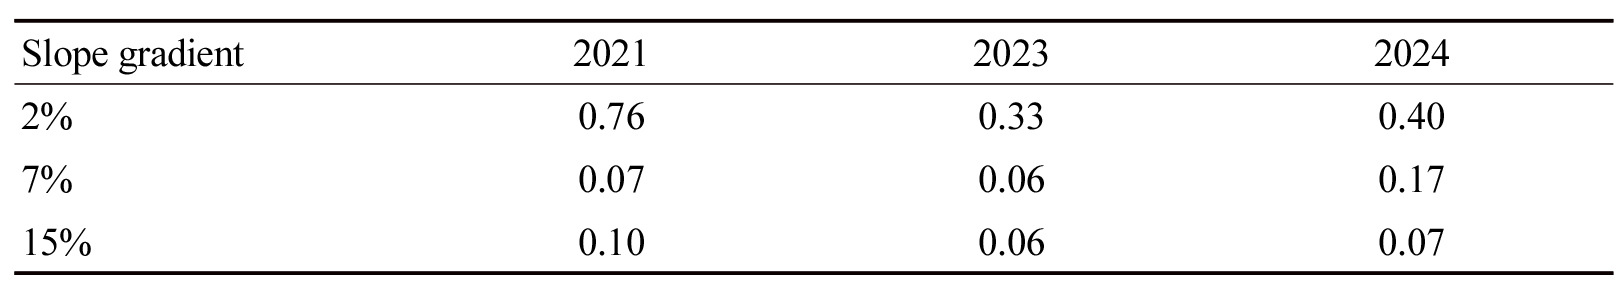
- Soil loss is a major concern in South Korea’s highland cropping systems due to high slope gradients. This study quantified soil loss …
- Soil loss is a major concern in South Korea’s highland cropping systems due to high slope gradients. This study quantified soil loss from conventionally cultivated potato (Solanum tuberosum L.) and bare soil lysimeters at 2%, 7%, and 15% slopes and assessed the primary drivers of soil loss over three growing seasons (2021, 2023, 2024) in Gangwon’s highland agriculture systems. Soil loss increased consistently with slope, showing stronger correlations with gradient (r = 0.32 - 0.79) than with rainfall intensity or runoff volume. Under potato cultivation, mean seasonal soil losses ranged from 1 - 3 Mg ha-1 (2% slope) to 11 - 30 Mg ha-1 (15% slope). In bare lysimeters, losses were far greater, ranging from 3 - 9 Mg ha-1 (2% slope) to 146 - 516 Mg ha-1 (15% slope). The presence of potato vegetation reduced mean seasonal soil loss by -92% compared to bare soil. Cover management factors (C-factors) for potato averaged 0.22 during the growing season, with lower values at steeper slopes (example 0.07 at 15%), indicating better erosion protection under higher slope gradients where bare soil losses were disproportionately large. These findings show that conventionally cultivated potato substantially reduces erosion compared to bare soil, especially on steep slopes, though substantial losses still occur during early growth stages with minimal canopy cover. Further integration of conservation practices such as mulching, contour planting, or cover cropping is recommended to achieve even lower C-factors and enhance long-term soil protection in highland potato systems. Cover management factors of conventionally cultivated potato across 2, 7 and 15% slope gradients, over three growing seasons in Gangwon’s highland agriculture systems. Slope gradient 2021 2023 2024 2% 0.76 0.33 0.40 7% 0.07 0.06 0.17 15% 0.10 0.06 0.07 - COLLAPSE
-
Original research article
- Crop productivity and nutrient use efficiency of water dropwort (Oenanthe javanica DC) under variable NPK fertilization levels
- Jin-Hee An, Yo-Sung Song, Chan-Wook Lee, Hye-Jin Park, Ye-Jin Lee
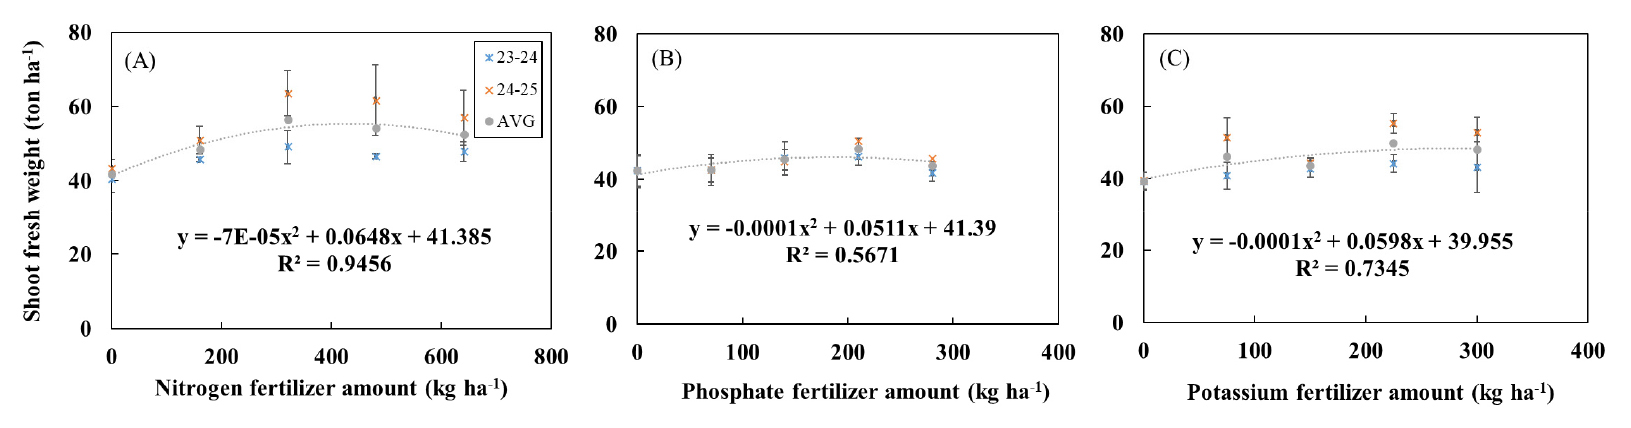
- Farmers participating in the public benefit direct payment system are required to comply with standard fertilizer use guidelines. However, the optimal fertilizer …
- Farmers participating in the public benefit direct payment system are required to comply with standard fertilizer use guidelines. However, the optimal fertilizer rates for water dropwort (Oenanthe javanica DC) cultivation have not yet been established, resulting in inefficient fertilizer use and inconsistent yields. To determine appropriate fertilizer standards, a two-year field experiment was conducted to evaluate the growth response and fertilizer use efficiency of water dropwort under five fertilization levels (0, 0.5, 1.0, 1.5, and 2.0 times the average farm application rate of N–P2O5–K2O = 320–140–150 kg ha-1). Plant height increased when nitrogen was applied at or above the standard rate and when phosphorus and potassium were applied at double the standard rate, whereas SPAD values showed no significant differences among treatments. The highest yields were obtained with nitrogen at 1.0×, phosphorus at 1.5×, and potassium at 1.5×. Fertilizer partial factor productivity (FPFP) was greatest at 0.5× for all nutrients, showing no significant variation between years, while fertilizer agronomic efficiency (FAE) did not differ significantly among phosphorus treatments. Fertilizer recovery (FR) was highest at 0.5× for nitrogen and phosphorus and at 1.5× for potassium. Based on two years of yield data, the optimal fertilizer rates for maximum yield were estimated to be 320 kg N ha-1, 140 kg P2O5 ha-1, and 225 kg K2O ha-1. These results provide a scientific basis for establishing customized fertilization guidelines that consider soil nutrient variability and aim to enhance fertilizer efficiency in water dropwort cultivation. The NPK fertilizer response curve of water dropwort (A: nitrogen, B: phosphate, C: potassium). - COLLAPSE
-
Original research article
- Evaluation of nitrogen dynamics under different nitrogen application levels in red pepper fields
- Yunsik Shin, Jong-Mun Lee, Hye-Ran Park, Minji Lee, Hyoung-Seok Lee, Jinho Kim, Young-Jae Jeong
- Excessive nitrogen (N) fertilization in agriculture leads to substantial nitrogen losses through ammonia (NH3) volatilization, nitrous oxide (N2O) …
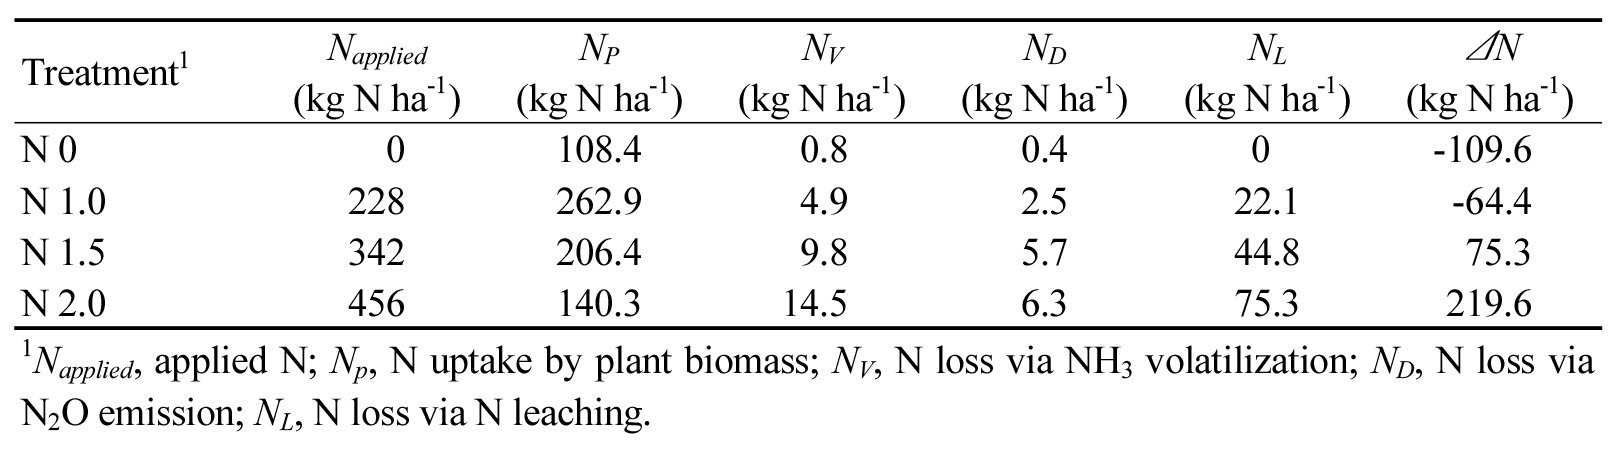
- Excessive nitrogen (N) fertilization in agriculture leads to substantial nitrogen losses through ammonia (NH3) volatilization, nitrous oxide (N2O) emissions, and nitrate (NO3−) leaching. To address N overuse and establish appropriate fertilizer management strategies, a comprehensive evaluation of N dynamics through different pathways including plant uptake, gaseous emissions and leaching. Therefore, this study evaluated N dynamics in red pepper (Capsicum annuum L.) fields under four N application rates (0, 228, 342, and 456 kg N ha-1). As a result, the cumulative emissions of NH3 and N2O ranged from 0.97 to 17.56 kg NH3 ha-1 and 0.69 to 9.92 kg N2O ha-1, respectively, increasing clearly with higher nitrogen input. The 228 kg N ha-1 treatment showed a more balanced nitrogen distribution, with the highest crop N uptake (262.9 kg N ha-1) and the lowest total N loss (29.5 kg N ha-1). In contrast, N uptake decreased by 21.5% and 46.6% in the 342 and 456 kg N ha-1 treatments, while nitrogen losses to the atmosphere and water pathways increased more than twofold. These results show that excessive N input reduces N use efficiency and shifts N flow toward environmental losses rather than crop uptake. Although some monitoring gaps occurred and nitrate leaching was estimated empirically due to practical constraints in field management, the overall pattern of nitrogen partitioning among treatments was consistent. These findings provide a quantitative baseline that captures the shift in N flow and loss structures across fertilization levels, offering a valuable reference for future N budgeting, modeling, and management framework development in red pepper cultivation systems. Nitrogen balance at each N application level in red pepper cultivation. Treatment1 Napplied NP NV ND NL ΔN (kg N ha-1) (kg N ha-1) (kg N ha-1) (kg N ha-1) (kg N ha-1) (kg N ha-1) N 0 0 108.4 0.8 0.4 0 -109.6 N 1.0 228 262.9 4.9 2.5 22.1 -64.4 N 1.5 342 206.4 9.8 5.7 44.8 75.3 N 2.0 456 140.3 14.5 6.3 75.3 219.6 1Napplied, applied N; Np, N uptake by plant biomass; NV, N loss via NH3 volatilization; ND, N loss via N2O emission; NL, N loss via N leaching. - COLLAPSE
-
Original research article
- Effect of organic and inorganic soil amendments on soil properties and crop growth in reclaimed land
- Jeong Min Lee, Young Kyu Hong, Jin Wook Kim, Ho Jin Jung, Sung Chul Kim, Yong Bok Lee
- As arable land continues to decline in South Korea due to rapid industrialization and urban expansion, reclaimed soils are being considered as …
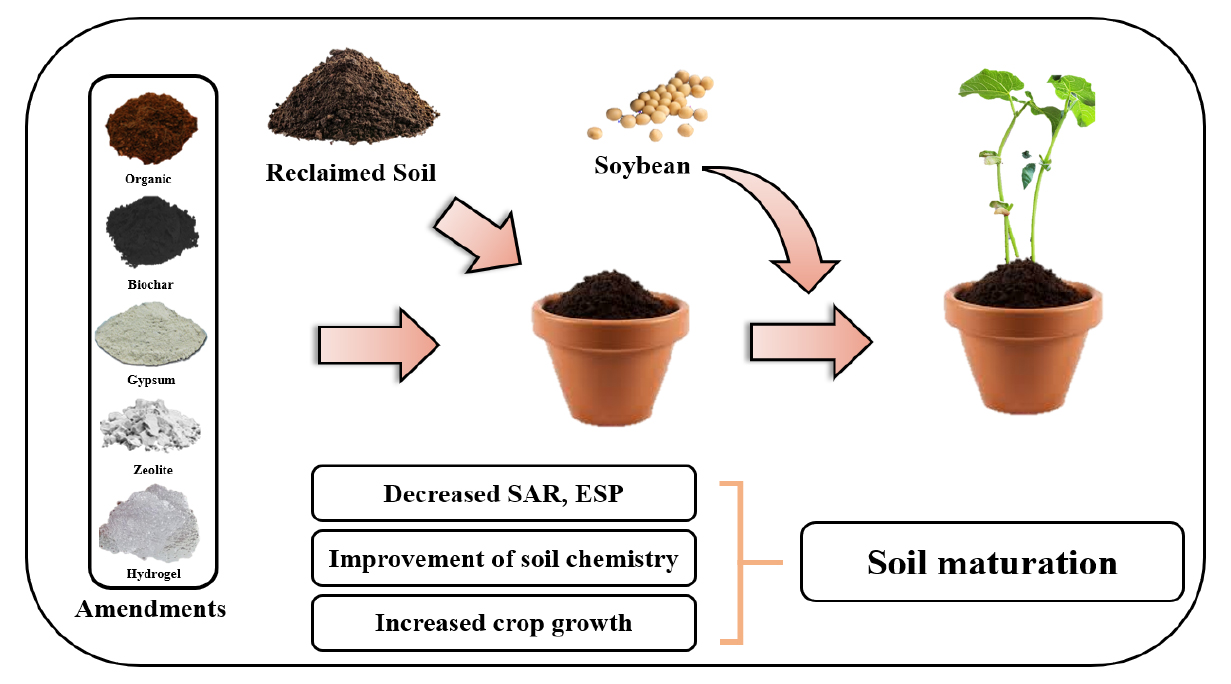
- As arable land continues to decline in South Korea due to rapid industrialization and urban expansion, reclaimed soils are being considered as a viable alternative for agriculture. However, these soils are often hindered by issues such as excessive salinity and poor physical structure. This study examined the impact of several organic (cocopeat, black peat, soft rice husk) and inorganic (biochar, zeolite, hydrogel) soil amendments—used both individually and in combination—on improving soil properties and supporting crop growth. Results showed that mixed applications consistently outperformed single-material treatments, particularly in enhancing soil quality and promoting plant development. Among the variables tested, Sodium Adsorption Ratio (SAR) and Exchangeable Sodium Percentage (ESP) were found to be strongly associated with crop performance. These findings suggest that integrated amendment strategies may offer an effective approach to rehabilitating saline reclaimed soils, though further field-based studies are needed to confirm their practical benefits. The research and result schematic that applied multiple amendment for the maturation of the reclaimed soil. - COLLAPSE
-
Original research article
- Effects of fertilizer deep placement on weed suppression and maize growth in different soil textures
- Jong-Mun Lee, Wook-Jae Lee, So-Jin Yeob, Soon-Kun Choi, Sang-Min Jun, Jinu Eo, Byungmo Lee, Young-Jae Jeong, Yerin Yang, Young-Eun Na
- Surface broadcasting of fertilizer in upland maize often causes a temporary accumulation of plant-available nitrogen (N) near the soil surface, leading to …
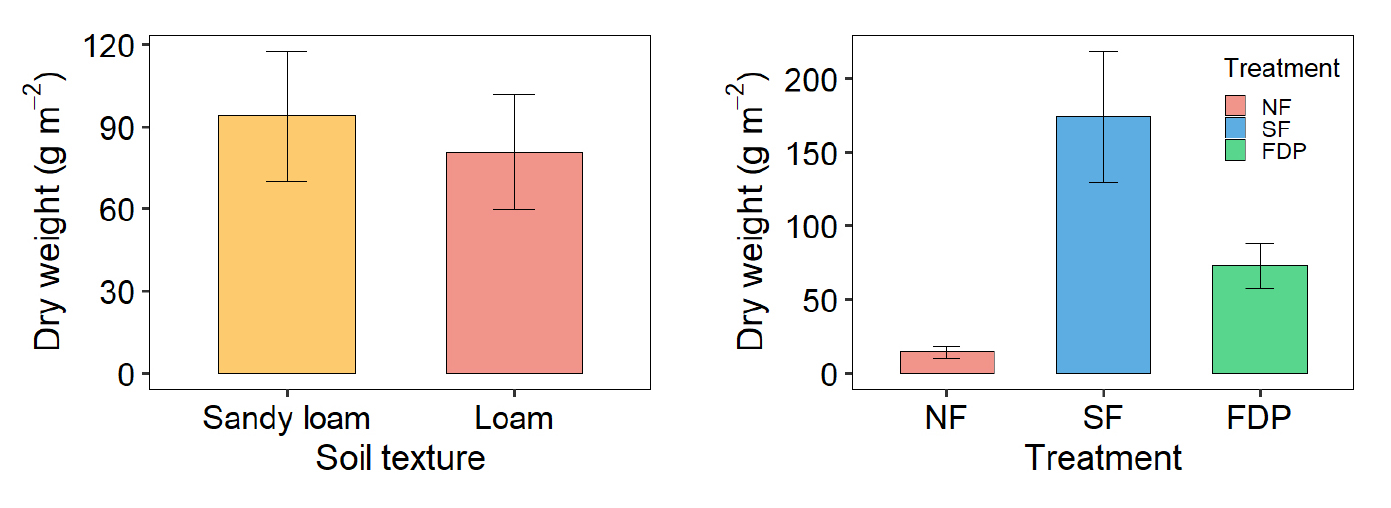
- Surface broadcasting of fertilizer in upland maize often causes a temporary accumulation of plant-available nitrogen (N) near the soil surface, leading to weed emergence and potential N losses. This study evaluated the effects of fertilizer deep placement (FDP) on weed growth, soil inorganic N dynamics, and maize yield across soil textures under field conditions. The experiment was arranged in a factorial combination of soil texture (sandy loam and loam) and fertilizer placement (no fertilizer, surface application, and FDP). Surface application increased inorganic N concentration in the upper soil layers and stimulated weed growth, whereas FDP reduced weed density and biomass while maintaining grain yield comparable to surface fertilization. Weed community diversity decreased under FDP, particularly in loam, indicating a shift toward dominance by a few species. These results suggest that FDP simultaneously suppresses weeds and stabilizes maize yield, providing a practical nutrient management strategy to reduce N loss and improve resource use efficiency in upland maize systems. Effects of soil texture and fertilizer treatment on weed growth characteristics. - COLLAPSE
-
Original research article
- Assessing future climate change impacts on hydrological processes in an agricultural watershed using SWAT+
- Min-Jin Kim, Won-Ho Nam, Eun-Mi Hong, Taegon Kim, Seongjoon Kim, Sang-Min Jun, Soon-Kun Choi
- This study assessed the hydrological impacts of future climate change in the Anseongcheon rural watershed using the SWAT+ model and CMIP6-based multi-model …
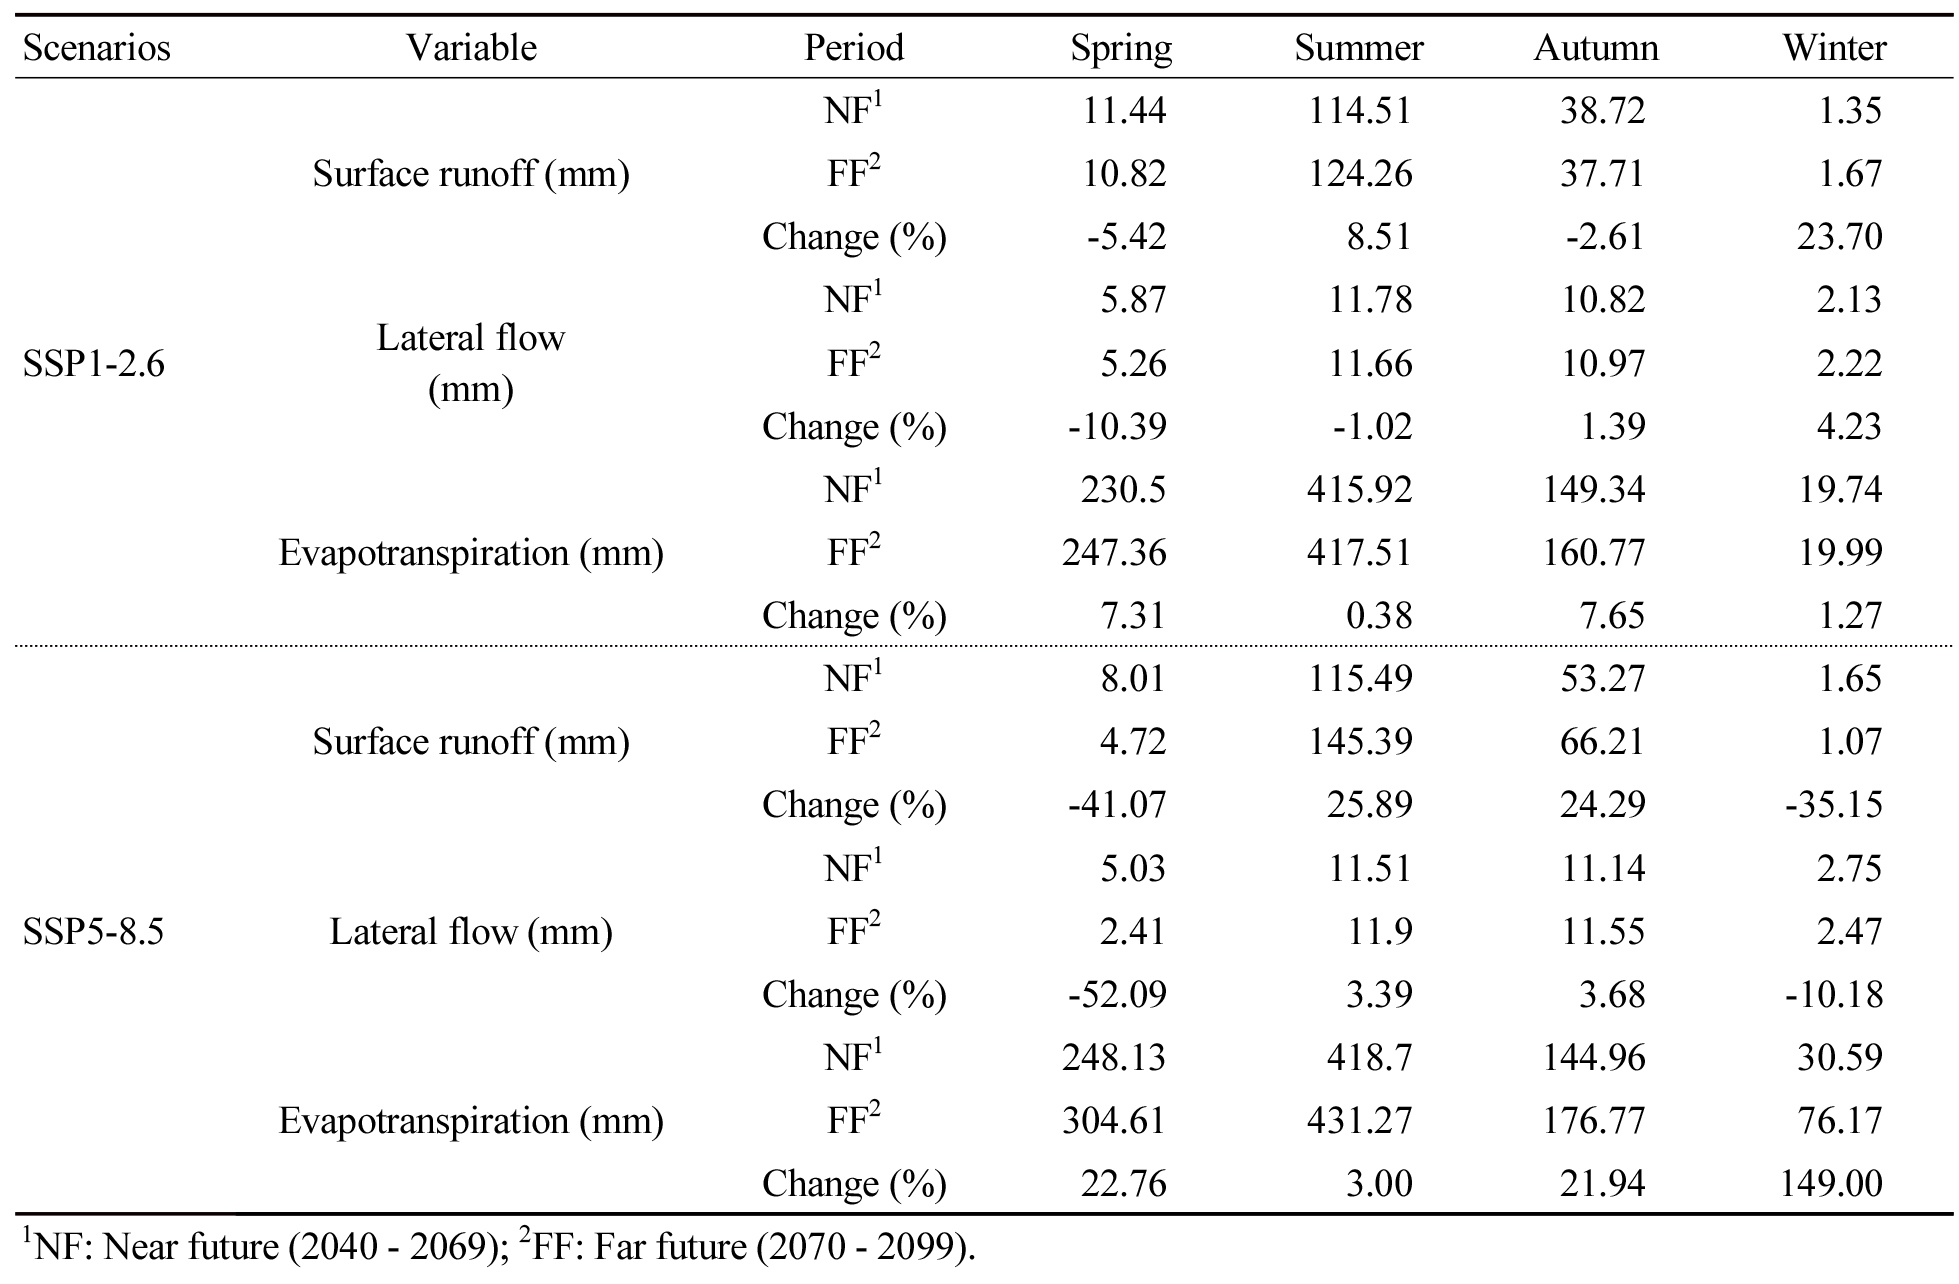
- This study assessed the hydrological impacts of future climate change in the Anseongcheon rural watershed using the SWAT+ model and CMIP6-based multi-model ensemble (MME) data. Two Shared Socioeconomic Pathways (SSP), SSP1-2.6 (low-emission) and SSP5-8.5 (high-emission), were analyzed for the near-future (2040 - 2069) and far-future (2070 - 2099) periods. To ensure model reliability, calibration (2018 - 2019) and validation (2020 - 2024) were conducted using observed streamflow data. The average model performance metrics demonstrated satisfactory accuracy, with NSE of 0.62, RSR of 0.64, and PBIAS of -3.05%, supporting the credibility of future projections. Future climate projections from the MME indicate a substantial increase in both precipitation and temperature relative to the historical baseline (1981 - 2010). Under the SSP5-8.5 far-future scenario, precipitation is projected to increase by 28.4%, and mean temperature to rise by 5.8°C. Analysis of hydrological components reveals pronounced seasonal variability, particularly under the high-emission scenario. Surface runoff is projected to decrease sharply in spring (-41.07%) and winter (-35.15%), whereas a significant rise in summer precipitation (up to +24.4%) leads to increased surface runoff (+25.89%) and lateral flow (+3.39%). Moreover, strong winter warming results in a remarkable 149.0% increase in evapotranspiration, driven by elevated temperatures despite potential reductions in winter precipitation. Overall, the findings highlight intensified seasonal fluctuations in hydrological processes within rural watersheds under high-emission conditions and demonstrate the robustness of SWAT+ as a tool for supporting adaptive water management strategies in a changing climate. Hydrological responses (SSP1-2.6, SSP5-8.5) were assessed. Under SSP5-8.5 far future, runoff rose +25.9% (summer) and evapotranspiration +149% (winter). Scenarios Variable Period Spring Summer Autumn Winter SSP1-2.6 Surface runoff (mm) NF1 11.44 114.51 38.72 1.35 FF2 10.82 124.26 37.71 1.67 Change (%) -5.42 8.51 -2.61 23.70 Lateral flow (mm) NF1 5.87 11.78 10.82 2.13 FF2 5.26 11.66 10.97 2.22 Change (%) -10.39 -1.02 1.39 4.23 Evapotranspiration (mm) NF1 230.5 415.92 149.34 19.74 FF2 247.36 417.51 160.77 19.99 Change (%) 7.31 0.38 7.65 1.27 SSP5-8.5 Surface runoff (mm) NF1 8.01 115.49 53.27 1.65 FF2 4.72 145.39 66.21 1.07 Change (%) -41.07 25.89 24.29 -35.15 Lateral flow (mm) NF1 5.03 11.51 11.14 2.75 FF2 2.41 11.9 11.55 2.47 Change (%) -52.09 3.39 3.68 -10.18 Evapotranspiration (mm) NF1 248.13 418.7 144.96 30.59 FF2 304.61 431.27 176.77 76.17 Change (%) 22.76 3.00 21.94 149.00 1NF: Near future (2040 - 2069); 2FF: Far future (2070 - 2099). - COLLAPSE
-
Original research article
- Baseline characterization of soil micronutrients in arable soils of Korea
- Seok Soon Jeong, Jung-Hwan Yoon, Hyuck Soo Kim, Sang Phil Lee, Sung Chul Kim, Sang Soo Lee, Jae E. Yang
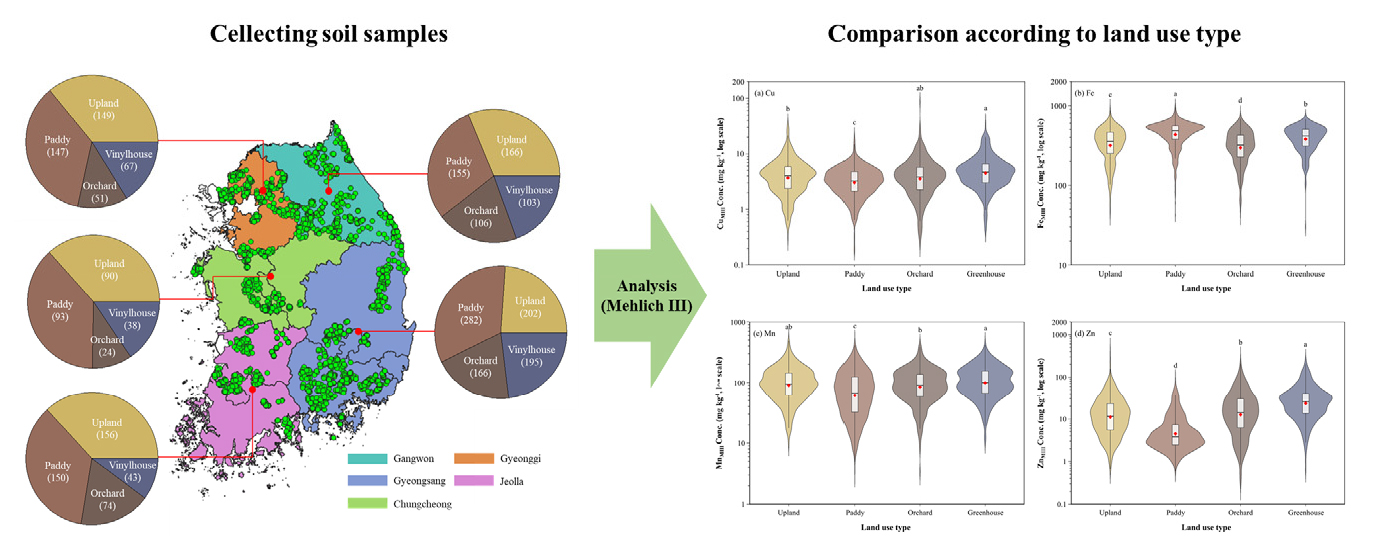
- Soil is the primary source of nutrients, prociding approximately 95% of human food directly or indirectly. Although macronutrient management in agriculture has …
- Soil is the primary source of nutrients, prociding approximately 95% of human food directly or indirectly. Although macronutrient management in agriculture has been substantially improved through fertilizer application, micronutrient supplementation has received considerably less attention, resulting in widespread deficiencies in agricultural soils with conseuquent impacts on crop productivity and food nutritional quality. To date, no comprehensive nationwide survey assessing soil micronutrient status has been conducted in Korean agricultural soils.This study aimed to provide the first nationalwide assessment of soil micronutrient satus (Cu, Fe, Mn, Zn) in Korean agirucltuyral soils. A total of 2,457 soil samples collected from different land use types and parent materials throughout Korea. Plant-available micronutrients were quantified using the Mehlich Ⅲ extraction method. Correlations between soil micronutrient contents and soil properties (pH, organic matter, available phosphate, exchangeable cations) were evaluated. Mean soil micronutrient contents were Cu 4.5 mg kg-1, Fe 394.8 mg kg-1, Mn 101.7 mg kg-1, and Zn 18.2 mg kg-1. Greenhouse soils exhibited the highest contents among land use types. Soils derived from sedimentary rocks exhibited the greatest micronutrient contents among parent materials. Soil micronutrient contents were significantly correlated with soil properties. This study provides the first comprehensive assessment of micronutrient status in Korean agricultural soils. The findings establish a baseline for future research and highlight the need for improved micronutrient management in relation to land use, soil parent materials, and soil properties. Soil samples for analysis and status of soil micronutrients in different land uses. - COLLAPSE
-
Original research article
- Estimation of soil EC sensor placement and optimal fertilization rates for nitrogen fertigation in Peach orchards
- Periyasamy Rathinapriya, Tae-Jun Lim, Pyoung-Ho Yi
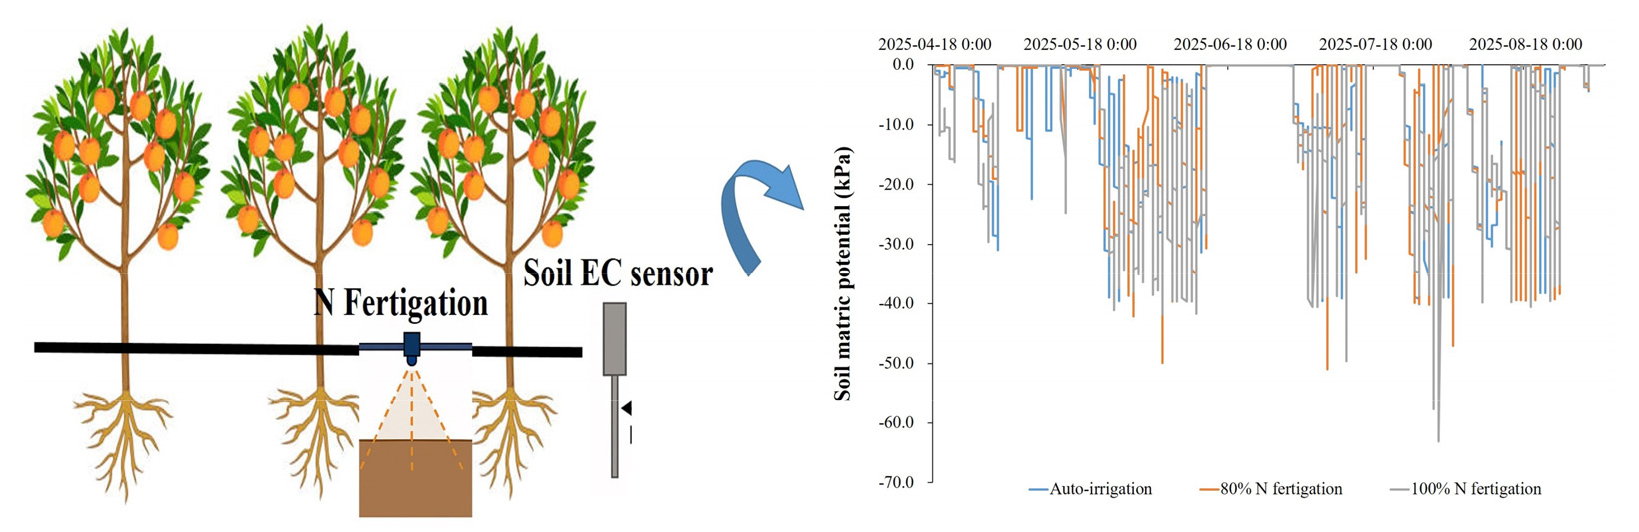
- Efficient nutrient management is essential for sustaining fruit yield and quality in peach orchards while minimizing environmental impacts. This study evaluated the …
- Efficient nutrient management is essential for sustaining fruit yield and quality in peach orchards while minimizing environmental impacts. This study evaluated the effects of reduced nitrogen (N) fertigation and the installation position of soil electrical conductivity (EC) sensors on soil nutrient dynamics, peach tree growth, and fruit productivity in an 11-year-old peach orchard in Wanju, South Korea. Treatments consisted of control, auto-irrigation with full N manual fertilization, 80% N fertigation, and 100% N fertigation. Soil EC sensors were installed at 0, 12.5, and 25 cm from drippers to monitor spatial variation in nutrient availability. Results showed that soil inorganic N and EC concentrations were highest near drippers, confirming strong spatial gradients, and decreased with distance from emitters. Peach shoot growth, and fruit yield were significantly enhanced by fertigation compared with auto-irrigation and the control. Importantly, no significant differences were observed between 80% N and 100% N fertigation, or between 80% N fertigation and manual fertilization at full N, indicating that N inputs can be reduced by 20% without compromising fruit productivity. These findings demonstrate that fertigation efficiency, coupled with proper soil EC sensor placement, can enhance fertilizer-use efficiency, reduce nutrient losses, and sustain high-quality peach production. Schematic illustration of N fertigation with soil EC sensor placement in a peach orchard, showing that sensor accuracy varies with distance from the drip emitter. - COLLAPSE
-
Short communication
- Long-term monitoring of changes in chemical properties of orchard soils in Gyeongnam province from 2002 to 2022
- Hee-Jeong Je, Mi-Jin Lee, Hyeon-Ji Cho, Young-min Jin, Young Han Lee, Eunjin Lee
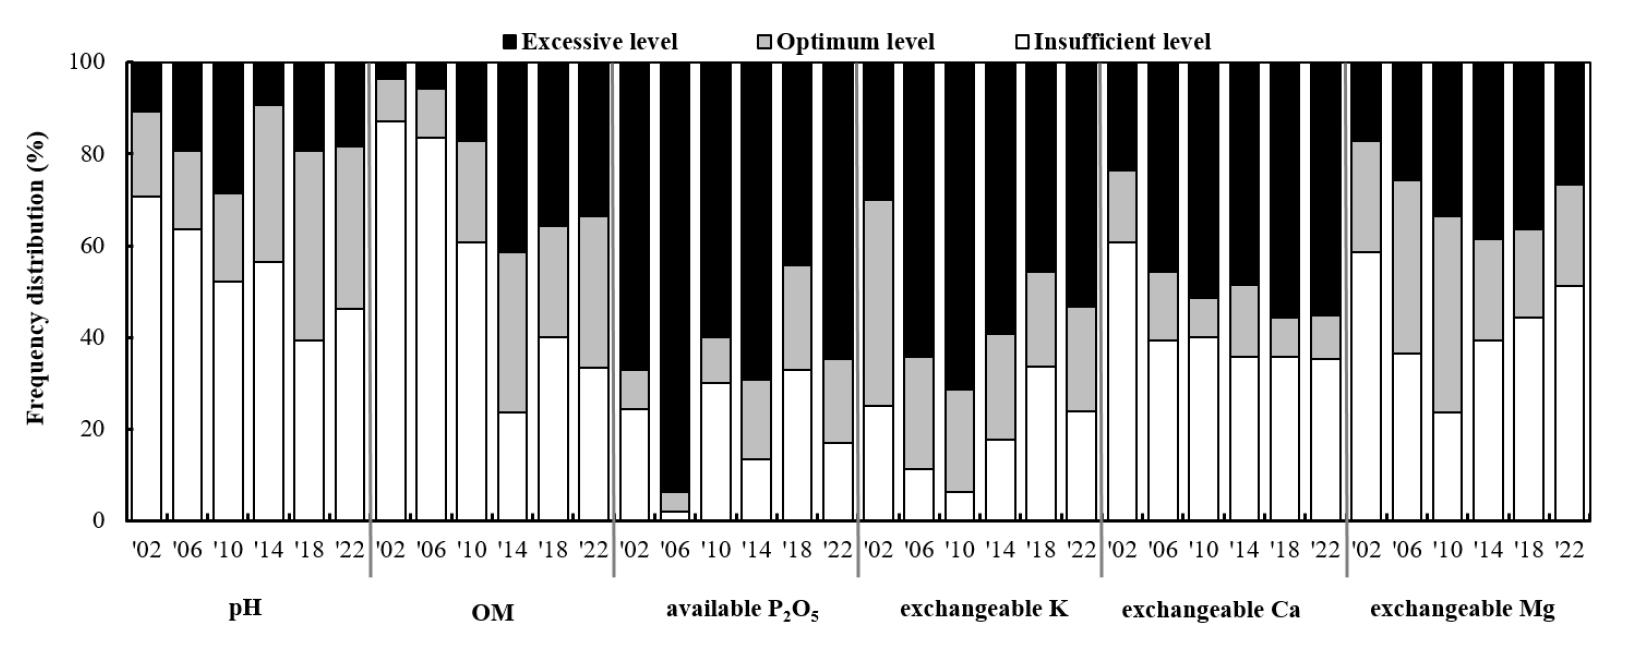
- Field monitoring was conducted to evaluate the chemical properties of 158 orchard soils in Gyeongnam Province every four years from 2002 to …
- Field monitoring was conducted to evaluate the chemical properties of 158 orchard soils in Gyeongnam Province every four years from 2002 to 2022. In 2022, the pH of the orchard soils was 6.2, indicating a suitable level within the optimum range. The percentage of soils within the optimum pH range was 35.4%, whereas 46.2% were below the optimum level. The organic matter content significantly increased from 2002, reaching 42 g kg-1 in 2022. Available phosphate consistently exceeded the optimum level from 2002 and increased to 900 mg kg-1 by 2022. Exchangeable potassium and calcium levels were maintained at 1.6 and 1.5 times higher than their respective optimum upper limits, whereas the deficiency rate of exchangeable magnesium reached 51.3%. Principal component analysis (PCA) of subsoil chemical properties over the years indicated that PC1 was associated with exchangeable calcium content, and PC2 was related to pH, which was thought to result from applying soil amendments. Regarding soil texture, the surface soil and subsoil of fine sandy loam showed significantly higher pH values than other soil textures. The organic matter content was significantly higher in the subsoil of the loamy fine sand. The topographic distribution of orchard fields in Gyeongnam Province includes local valleys and fans, mountain foot slopes, alluvial plains, hills and mountains, and diluvium deposits. Effective nutrient management in orchard soils requires consideration of chemical properties and physical characteristics, including topography. These results indicate that balanced management of soil chemical properties can optimize fertilizer application for sustainable agriculture in orchards. Frequency distribution of subsoil chemical properties of orchard field in Gyeongnam province (n = 158). - COLLAPSE
-
Short communication
- Variation of soil physical properties of greenhouse fields in Chungbuk Province from 2016 to 2024
- Mejee Jin, Juhee Yu, Minja Kim, Juhyoung Kim, Seungoh Hur
- Soil physical property monitoring is conducted in accordance with the Rural Development Administration’s notice (2017-12) in Korea, as mandated by the Framework …
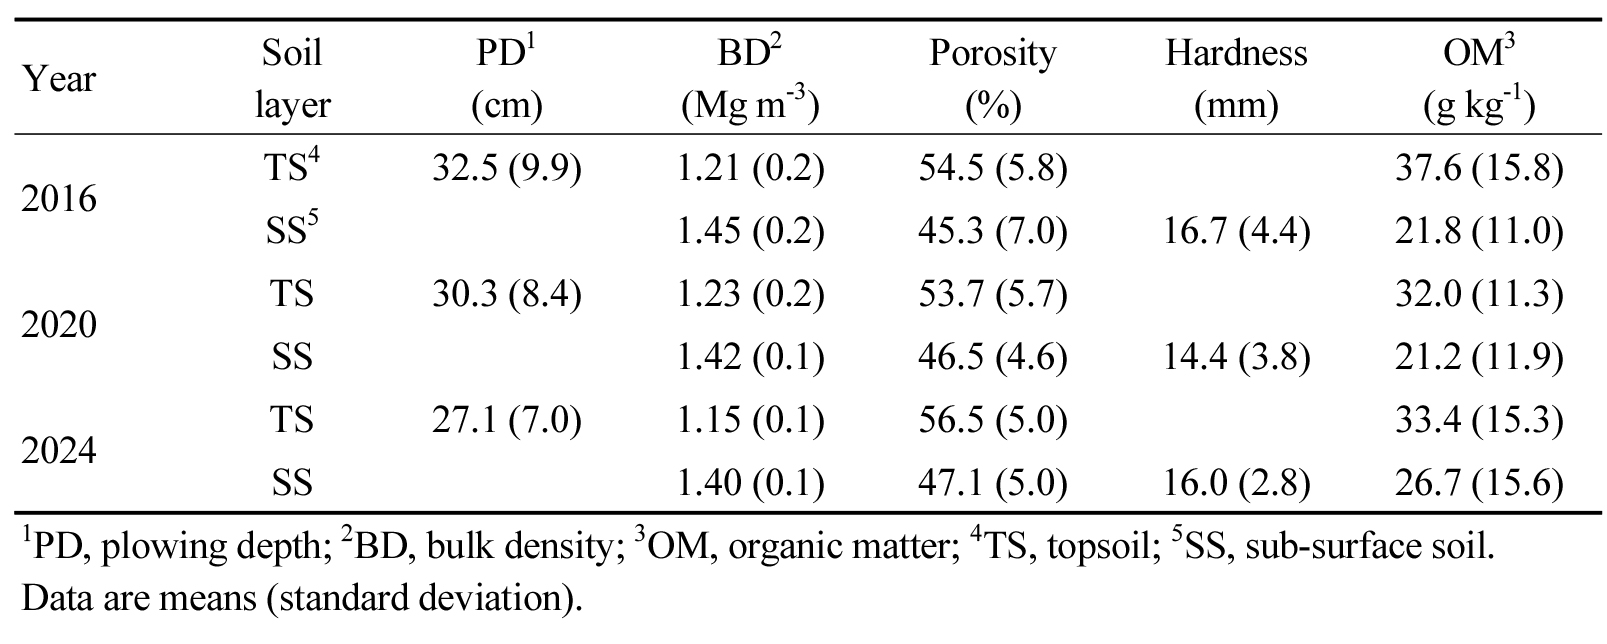
- Soil physical property monitoring is conducted in accordance with the Rural Development Administration’s notice (2017-12) in Korea, as mandated by the Framework Act on the Promotion of Environment-Friendly Agriculture and Fisheries and the Management of and Support for Organic Foods, etc. This study aimed to analyze the physical characteristics and temporal changes of greenhouse soils in Chungbuk province, based on soil physical property surveys conducted every four years from 2016 to 2024. The main soil series identified in the region were Gangseo and Gocheon, predominantly distributed in fluvial plains, with subsoil (soil below plowing depth) textures mainly consisting of sandy loam. Since 2016, the plow layer depth has shown a decreasing trend, while organic matter content in the subsoil has increased. The bulk density of the subsoil decreased from 1.45 Mg m-3 in 2016 to 1.40 Mg m-3 in 2024, indicating that the physical properties of greenhouse soils have been appropriately maintained. However, as of 2024, 22.5% of the sites still exhibited subsoil bulk densities exceeding 1.5 Mg m-3, suggesting the need for continuous soil improvement practices to enhance soil physical properties. Soil physical properties of greenhouse soils by years. Year Soil layer PD1 (cm) BD2 (Mg m-3) Porosity (%) Hardness (mm) OM3 (g kg-1) 2016 TS4 32.5 (9.9) 1.21 (0.2) 54.5 (5.8) 37.6 (15.8) SS5 1.45 (0.2) 45.3 (7.0) 16.7 (4.4) 21.8 (11.0) 2020 TS 30.3 (8.4) 1.23 (0.2) 53.7 (5.7) 32.0 (11.3) SS 1.42 (0.1) 46.5 (4.6) 14.4 (3.8) 21.2 (11.9) 2024 TS 27.1 (7.0) 1.15 (0.1) 56.5 (5.0) 33.4 (15.3) SS 1.40 (0.1) 47.1 (5.0) 16.0 (2.8) 26.7 (15.6) 1PD, plowing depth; 2BD, bulk density; 3OM, organic matter; 4TS, topsoil; 5SS, sub-surface soil. Data are means (standard deviation). - COLLAPSE
-
Short communication
- Chemical characteristics of agricultural groundwater with different land use type, period, and season in Chungbuk Province from 2021 to 2024
- Juhee Yu, Mejee Jin, Minja Kim, Juhyoung Kim
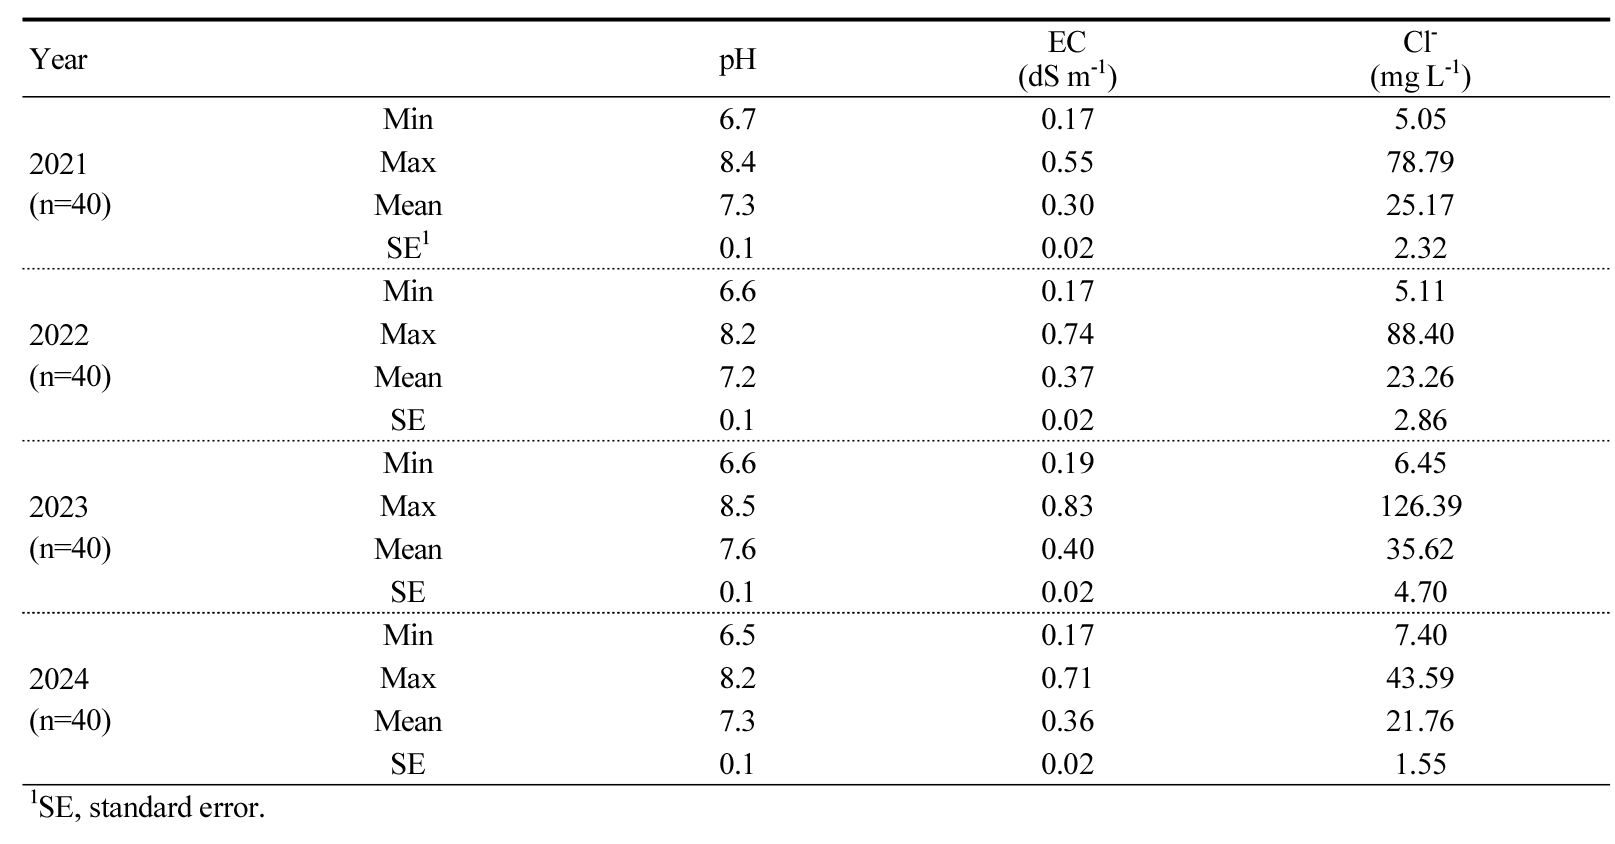
- This study investigated the seasonal and annual variations in the quality of agricultural groundwater in Chungbuk Province, Korea, from 2021 to 2024. …
- This study investigated the seasonal and annual variations in the quality of agricultural groundwater in Chungbuk Province, Korea, from 2021 to 2024. Groundwater samples were collected from paddy fields, upland fields, and greenhouse sites each April and July, and analyzed for pH, electrical conductivity (EC), nitrate nitrogen (NO3--N), total nitrogen (T-N), total phosphorus (T-P), chloride (Cl-), calcium (Ca), potassium (K), magnesium (Mg) and sodium (Na). The results showed that all major parameters, including pH, NO3--N, and Cl-, met the irrigation water quality standards throughout the study period, However, concentrations of NO3--N, K and Mg tended to increase in greenhouses and during the summer season. A gradual rise in EC and major cations was observed over the years. These findings suggest that intensive fertilizer application during the cropping season and increased rainfall infiltration contribute to temporary increases in dissolved ion concentrations in groundwater. Overall, agricultural groundwater in Chungbuk province is suitable for irrigation, but continued monitoring and management are recommended to prevent potential deterioration due to non-point source pollution and intensive agricultural practices. Chemical properties (pH, EC, and Cl⁻) of agricultural groundwater in Chungbuk Province from 2021 to 2024. Year pH EC (dS m-1) Cl- (mg L-1) 2021 (n=40) Min 6.7 0.17 5.05 Max 8.4 0.55 78.79 Mean 7.3 0.30 25.17 SE1 0.1 0.02 2.32 2022 (n=40) Min 6.6 0.17 5.11 Max 8.2 0.74 88.40 Mean 7.2 0.37 23.26 SE 0.1 0.02 2.86 2023 (n=40) Min 6.6 0.19 6.45 Max 8.5 0.83 126.39 Mean 7.6 0.40 35.62 SE 0.1 0.02 4.70 2024 (n=40) Min 6.5 0.17 7.40 Max 8.2 0.71 43.59 Mean 7.3 0.36 21.76 SE 0.1 0.02 1.55 1SE, standard error. - COLLAPSE
-
Short communication
- Physical properties of greenhouse soils in Chungnam Province: current status and temporal changes from 2016 to 2024
- Jeong Su Lee, Yeo-Uk Yun, Jang-Yong Choi, Yun-Gi Cho, Jae-Han Lee, Seung-Oh Hur
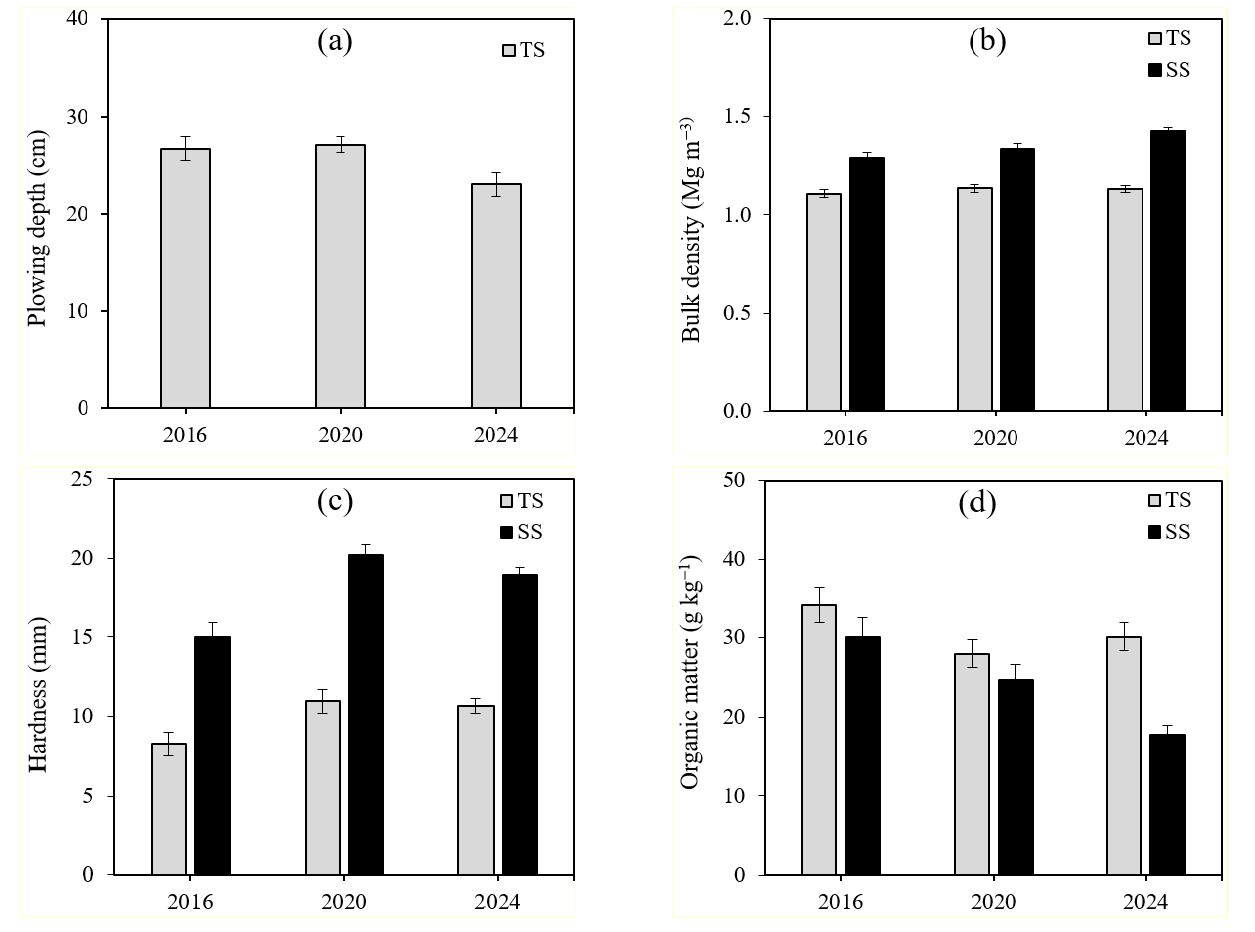
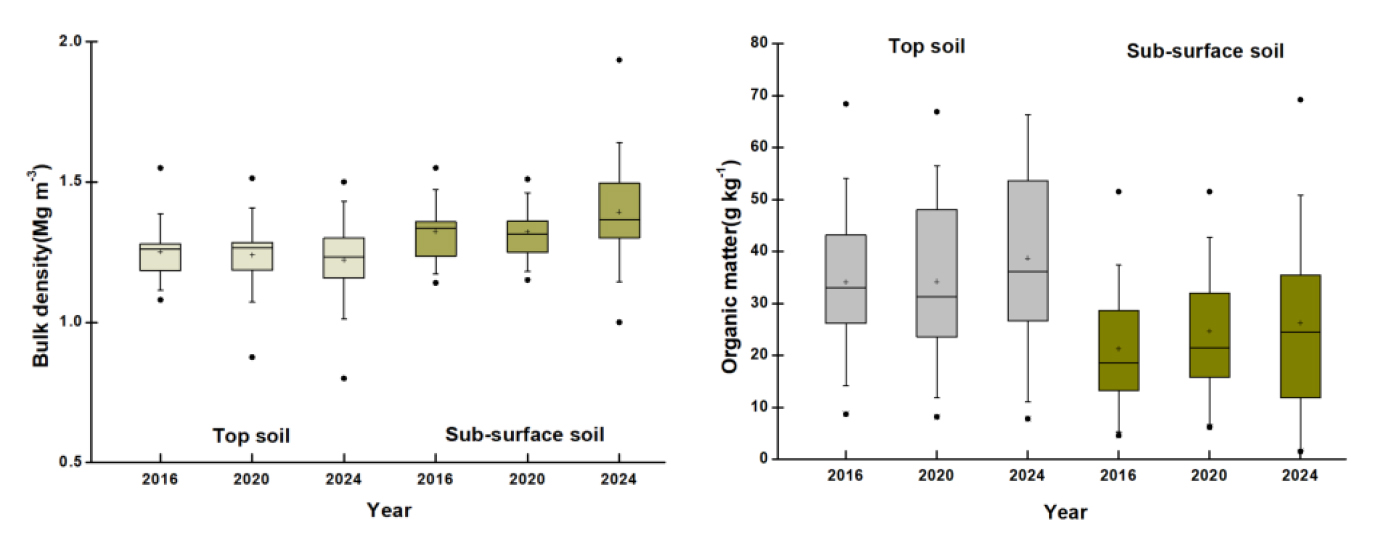
- Greenhouse cultivation areas have been steadily expanding in South Korea. However, intensive tillage and excessive fertilizer use can deteriorate key soil physical …
- Greenhouse cultivation areas have been steadily expanding in South Korea. However, intensive tillage and excessive fertilizer use can deteriorate key soil physical properties, such as bulk density and structure. This study investigated temporal changes in soil physical properties at 37 greenhouse cultivation sites in Chungnam province over three monitoring cycles (2016, 2020, and 2024). Sampling sites were selected based on the regional distribution of major greenhouse-crops such as watermelon and tomato. The soils were classified into 18 soil series and 4 topographic types, with river alluvium being the most dominant (75.7%). Soil texture in both topsoil and subsoil was dominated by silt loam, loam, and sandy loam. Among the topographies, river alluvium had the greatest average plowing depth (24.2 cm). In contrast, fluvio-marine deposits showed the lowest bulk density (1.08 Mg m-3) and the highest organic matter content. This suggests an inverse relationship between bulk density and organic matter. During the survey period, the plowing depth consistently met the recommended standard (>20 cm). However, a gradual decreasing trend was observed over time (from 26.7 cm to 23.0 cm). The bulk densities of both topsoil and subsoil remained within the appropriate standard (<1.6 Mg m-3 for sandy loam and 1.5 Mg m-3 for silty clay loam). However, the subsoil bulk density showed a steady increase over time(from 1.29 to 1.43 Mg m-3), indicating progressive soil compaction. Organic matter content declined in 2020 but slightly recovered by 2024. Overall, greenhouse soils in Chungnam are relatively well-maintained. However, the decline in plowing depth and the rise in subsoil compaction highlight the need for improved soil management. Practices such as deep tillage and regular application of organic amendments are recommended. Changes of average soil physical properties of greenhouse soils by 2016, 2020 and 2024. - COLLAPSE
-
Short communication
- Changes in fertilizer type and use patterns for major food crops cultivation between 2019 and 2023 in South Korea
- Yu-Na Lee, Sin-Sil Kim, Kyeong-yeong Kim, Jae-Hong Shim, Sang-Ho Jeon, Ahn-Sung Roh, Soon-Ik Kwon, Seong-Heon Kim
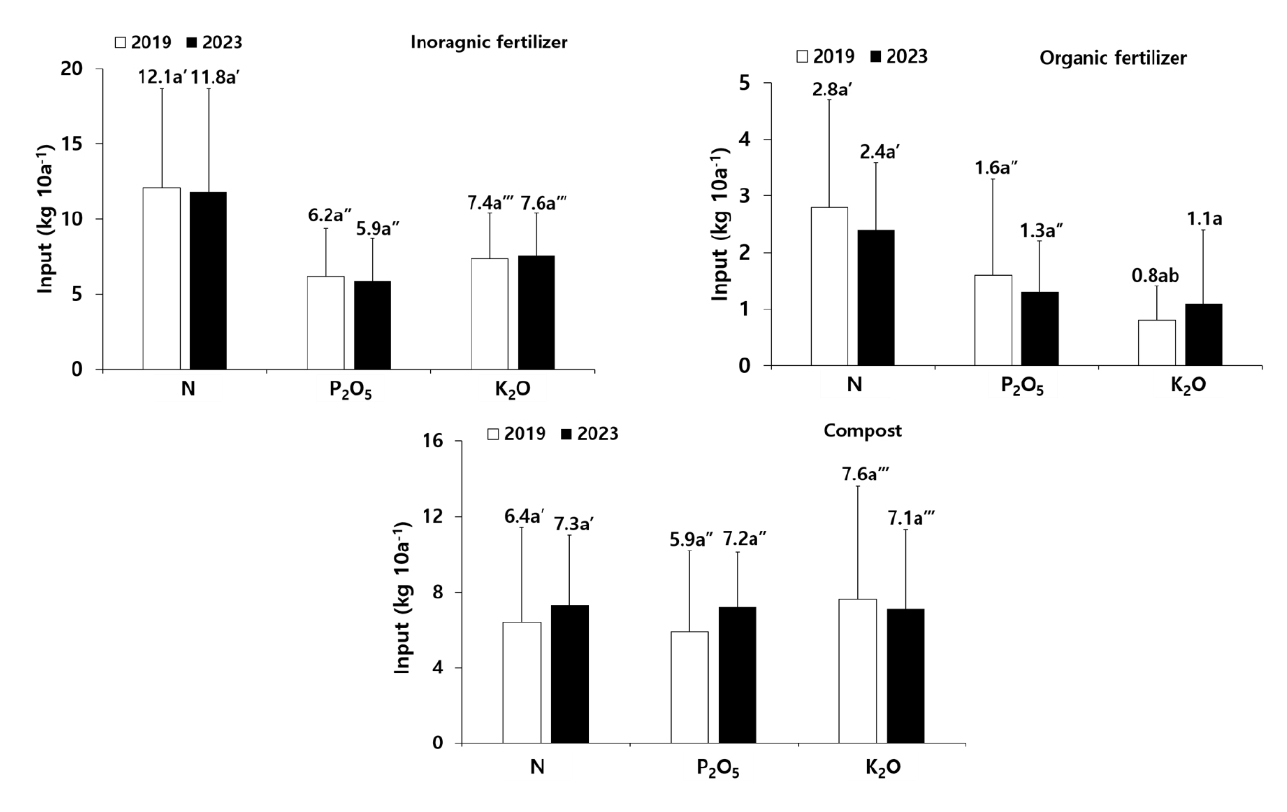
- Korea is one of countries that have high application rate of organic fertilizer and is known to cause significant environments issues. The …
- Korea is one of countries that have high application rate of organic fertilizer and is known to cause significant environments issues. The use of inorganic fertilizer has led to a nutrient supply that exceeds the nutrient requirements of crops, resulting in an excess of nutrients in agricultural soil. Hence, many agricultural policies have been legislated to reduce the fertilizer application rate since 1990s. This study aims to investigate fertilizer type and usage on food crops (rice, barley, bean, potato, sweet potato, corn) in 9 provinces in 2019 and 2023. The average of total fertilizer inputs (N-P2O5-K2O) showed a slight decrease in both inorganic and organic fertilizers in 2023 compared to 2019, while compost increased. In terms of N, the total fertilizer usage was highest for potato (37.0 kg 10a-1) in 2019 and for corn (37.7 kg 10a-1) in 2023. Moreover, the fertilizer usage for all crops exceeded the recommended levels. As a result, a primary concern is the excessive use of fertilizers, with a focus on compost. Because of the high nutrient content of compost, the application rate of compost should be controlled and monitored. Therefore, the proper training and monitoring are required to promote proper nutrient management of fertilizer in food crops cultivation. Distribution of gross nutrient input by inorganic fertilizer, organic fertilizer and compost in major food crops. - COLLAPSE
-
Short communication
- Identification of key factors for soil drainage classification via color metric comparison from soil images
- Danbi Lee, Kyoungchul Kim, Byeonghwan Seo, Songrae Cho, Minsan Im, Yeonkyu Sonn
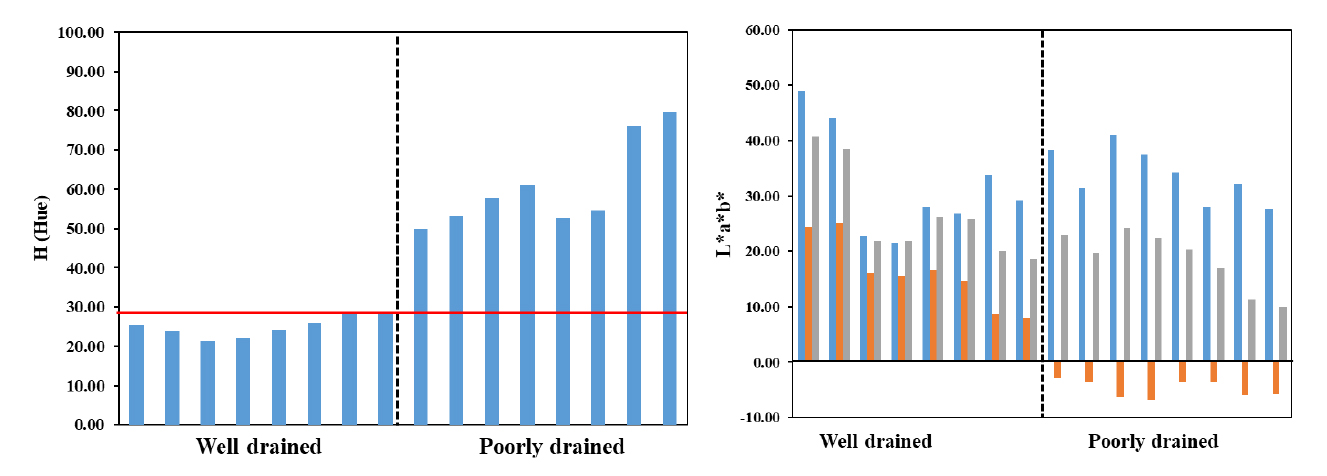
- Drainage class is a critical factor in evaluating soil for crop suitability, water management, and sustainable agricultural planning. Traditional classification methods, which …
- Drainage class is a critical factor in evaluating soil for crop suitability, water management, and sustainable agricultural planning. Traditional classification methods, which rely on field surveys and expert judgment, can be subjective. This study aims to establish objective criteria for soil drainage classification by analyzing color properties extracted from soil images. A total of 88 soil samples were collected from diverse parent materials and drainage classes. Soil colors were quantified using the Munsell soil color system, HSV, and CIELAB color spaces. In well drained and moderately well drained soils, matrix colors exhibited high chroma (≥3), while redoximorphic features showed low chroma (1 - 2), indicating strong oxidizing conditions. In contrast, poorly drained soils displayed grayish matrix colors with low chroma (≤2) and reddish mottles with high chroma (≥4), reflecting alternating redox conditions. Hue values in the HSV space and a* (red - green axis of the CIELAB color space) values in the CIELAB space were particularly effective in distinguishing drainage classes: well drained soils generally had higher Hue and a* values, whereas poorly drained soils tended toward lower Hue and negative a* values. Phyllite derived soils exhibited unique characteristics due to the inherent color of the parent material, highlighting the need for integrated interpretation. These findings demonstrate that digital image based soil color analysis, particularly using Hue and a* values, provides a quantitative and scalable approach to classifying soil drainage classes. It is proposed that image-based analysis using HSV and CIELAB models can classify soil drainage by quantifying hue and chroma. - COLLAPSE
-
Short communication
- Yield and water balance response of Italian ryegrass to different fertilizer application amount in weighable lysimeter
- Min-kyeong Park, Jung-hun Ok, Dong-hyun Kim, Seung-gyu Lee, Jeong-woo Son
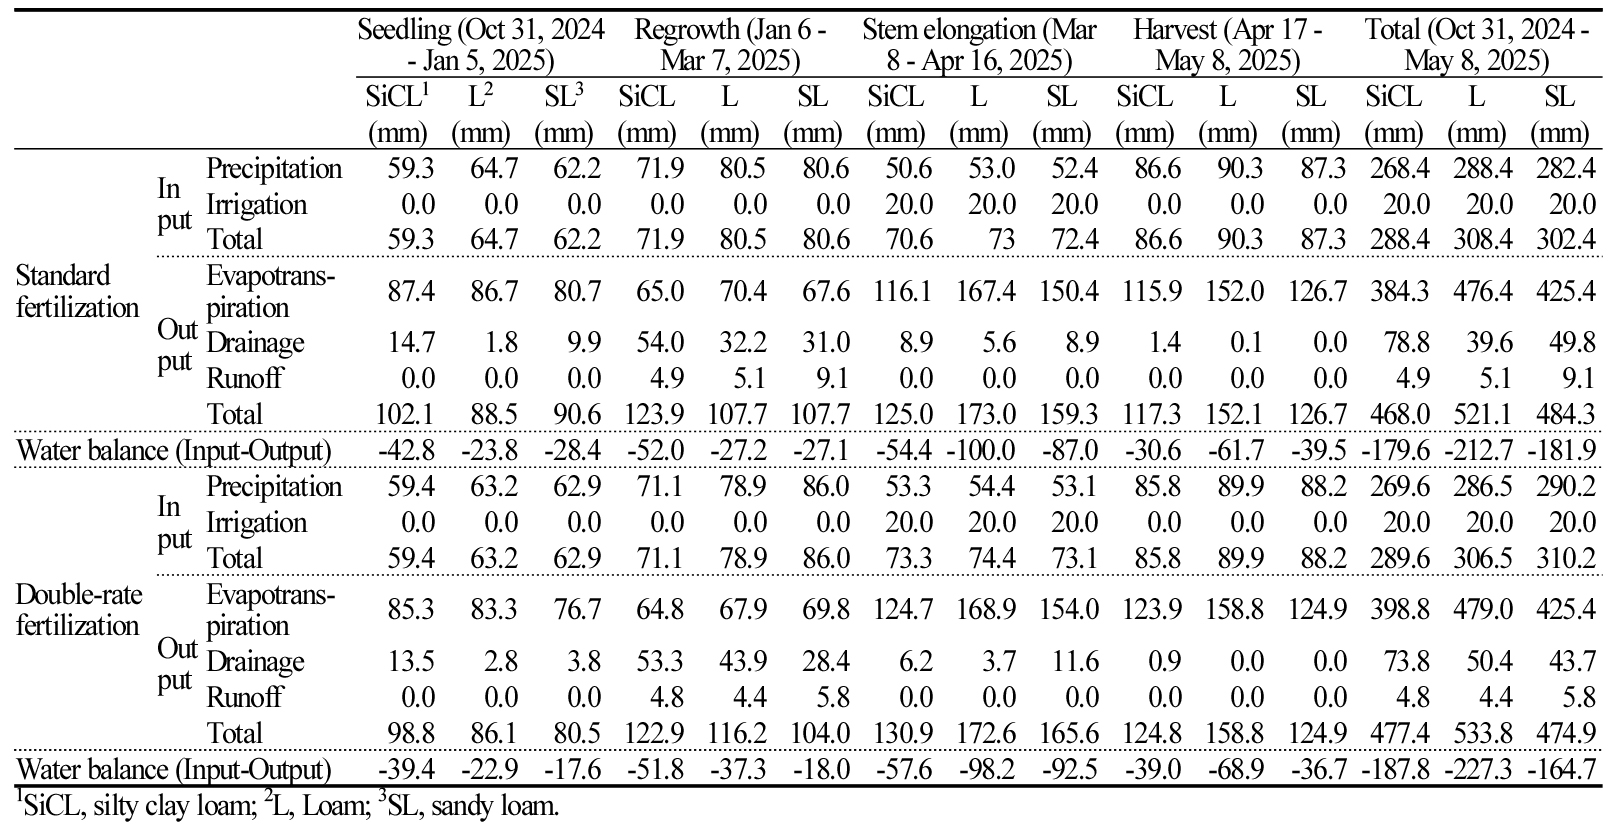
- This study investigated the growth characteristics and water balance of Italian ryegrass under different soil texture and fertilizer application amount using a …
- This study investigated the growth characteristics and water balance of Italian ryegrass under different soil texture and fertilizer application amount using a weighing lysimeter. Fertilizer treatments were set at one and two times of the standard application amount. Study used three soil textures including silty clay loam (SiCL), loam (L), sandy loam (SL). Water balance analysis was conducted by estimating rainfall, irrigation, and evapotranspiration from lysimeter weight changes, while drainage was measured with a tipping counter, and runoff was collected directly. The growth survey showed statistically significant differences depending on soil texture, with L providing the most favorable growth. In contrast, fertilizer application amount had no significant effect, suggesting that excessive fertilization may reduce yield in Italian ryegrass, despite its high nutrient demand. Water balance analysis showed similar water inflow among treatments, while water outflow was highest in L due to greater evapotranspiration. As evapotranspiration is positively correlated with yield, the higher yield in L likely led to increased evapotranspiration. Drainage was greatest in SiCL, possibly due to winter cracking associated with its high clay content. Fertilizer application showed no significant effect, likely because higher fertilizer levels increased transpiration through greater plant growth but reduced soil evaporation via larger leaf area, resulting in little difference in total evapotranspiration. Overall, water balance was negative values. These results indicate that water balance analysis by fertilizer input amount and growth stage, combined with meteorological factors, provides baseline information for water management optimization in Italian ryegrass under different fertilizer application amount. Estimation of water balance on different soil textures and applied fertilizer amount using weighable lysimeter. Seedling (Oct 31, 2024 - Jan 5, 2025) Regrowth (Jan 6 - Mar 7, 2025) Stem elongation (Mar 8 - Apr 16, 2025) Harvest (Apr 17 - May 8, 2025) Total (Oct 31, 2024 - May 8, 2025) SiCL1 L2 SL3 SiCL L SL SiCL L SL SiCL L SL SiCL L SL (mm) (mm) (mm) (mm) (mm) (mm) (mm) (mm) (mm) (mm) (mm) (mm) (mm) (mm) (mm) Standard fertilization In put Precipitation 59.3 64.7 62.2 71.9 80.5 80.6 50.6 53.0 52.4 86.6 90.3 87.3 268.4 288.4 282.4 Irrigation 0.0 0.0 0.0 0.0 0.0 0.0 20.0 20.0 20.0 0.0 0.0 0.0 20.0 20.0 20.0 Total 59.3 64.7 62.2 71.9 80.5 80.6 70.6 73 72.4 86.6 90.3 87.3 288.4 308.4 302.4 Out put Evapotrans- piration 87.4 86.7 80.7 65.0 70.4 67.6 116.1 167.4 150.4 115.9 152.0 126.7 384.3 476.4 425.4 Drainage 14.7 1.8 9.9 54.0 32.2 31.0 8.9 5.6 8.9 1.4 0.1 0.0 78.8 39.6 49.8 Runoff 0.0 0.0 0.0 4.9 5.1 9.1 0.0 0.0 0.0 0.0 0.0 0.0 4.9 5.1 9.1 Total 102.1 88.5 90.6 123.9 107.7 107.7 125.0 173.0 159.3 117.3 152.1 126.7 468.0 521.1 484.3 Water balance (Input-Output) -42.8 -23.8 -28.4 -52.0 -27.2 -27.1 -54.4 -100.0 -87.0 -30.6 -61.7 -39.5 -179.6 -212.7 -181.9 Double-rate fertilization In put Precipitation 59.4 63.2 62.9 71.1 78.9 86.0 53.3 54.4 53.1 85.8 89.9 88.2 269.6 286.5 290.2 Irrigation 0.0 0.0 0.0 0.0 0.0 0.0 20.0 20.0 20.0 0.0 0.0 0.0 20.0 20.0 20.0 Total 59.4 63.2 62.9 71.1 78.9 86.0 73.3 74.4 73.1 85.8 89.9 88.2 289.6 306.5 310.2 Out put Evapotrans- piration 85.3 83.3 76.7 64.8 67.9 69.8 124.7 168.9 154.0 123.9 158.8 124.9 398.8 479.0 425.4 Drainage 13.5 2.8 3.8 53.3 43.9 28.4 6.2 3.7 11.6 0.9 0.0 0.0 73.8 50.4 43.7 Runoff 0.0 0.0 0.0 4.8 4.4 5.8 0.0 0.0 0.0 0.0 0.0 0.0 4.8 4.4 5.8 Total 98.8 86.1 80.5 122.9 116.2 104.0 130.9 172.6 165.6 124.8 158.8 124.9 477.4 533.8 474.9 Water balance (Input-Output) -39.4 -22.9 -17.6 -51.8 -37.3 -18.0 -57.6 -98.2 -92.5 -39.0 -68.9 -36.7 -187.8 -227.3 -164.7 1SiCL, silty clay loam; 2L, Loam; 3SL, sandy loam. - COLLAPSE
-
Short communication
- Temporal changes in soil physical properties of greenhouse soils in Gyeonggi-do, Korea (2016 - 2024)
- Min-Hee Song, Min-Uk Kang, Min-Seok Kim, Seung-Woo Jeong, Jae-Won Jeong, Seung-Oh Hur
- Due to climate change, urbanization and the reduction of arable land protected cultivation systems are increasingly being adopted to ensure stable and …
- Due to climate change, urbanization and the reduction of arable land protected cultivation systems are increasingly being adopted to ensure stable and sustainable crop production. However, the enclosed structures limited space and continuous cropping practices in protected cultivation accelerate changes in soil conditions, particularly the deterioration of soil physical properties. Within Gyeonggi Province, 40 sites were surveyed annually from 2016 to 2024. Soil physical properties that could represent the characteristics of each site were compared and analyzed. soil physical characteristics in protected cultivation areas varied depending on regional and topographical conditions. Notably, a significant increase in bulk density and soil hardness was observed in the subsoil layers during the study period. These changes are attributed to repeated shallow tillage in confined spaces, reliance on conventional equipment, insufficient deep tillage and inadequate drainage and aeration. The results suggest that current soil management practices have primarily targeted surface layers, neglecting the subsoil. Therefore, improving subsoil structure and physical properties is essential for the long-term sustainability of protected cultivation systems. Regular monitoring of soil physical properties should be implemented. Technical solutions may include the application of compost and organic composite materials, as well as proper control of tillage depth. These practices can alleviate soil compaction and enhance aeration in deeper layers, contributing to the maintenance of soil health in protected cultivation. A long-term soil management strategy should integrate both surface and subsoil improvement measures. Changes in bulk density and organic matter contents of Greenhouse fields in 2016, 2020 and 2024. - COLLAPSE
-
Short communication
- Soil health assessment of conventional and organic grape orchards based on soil chemical properties
- Yeon-Ho Kim, Hye-Ban Namgung, Sang-Min Lee, Sung-chul Kim, Hyun-Young Hwang
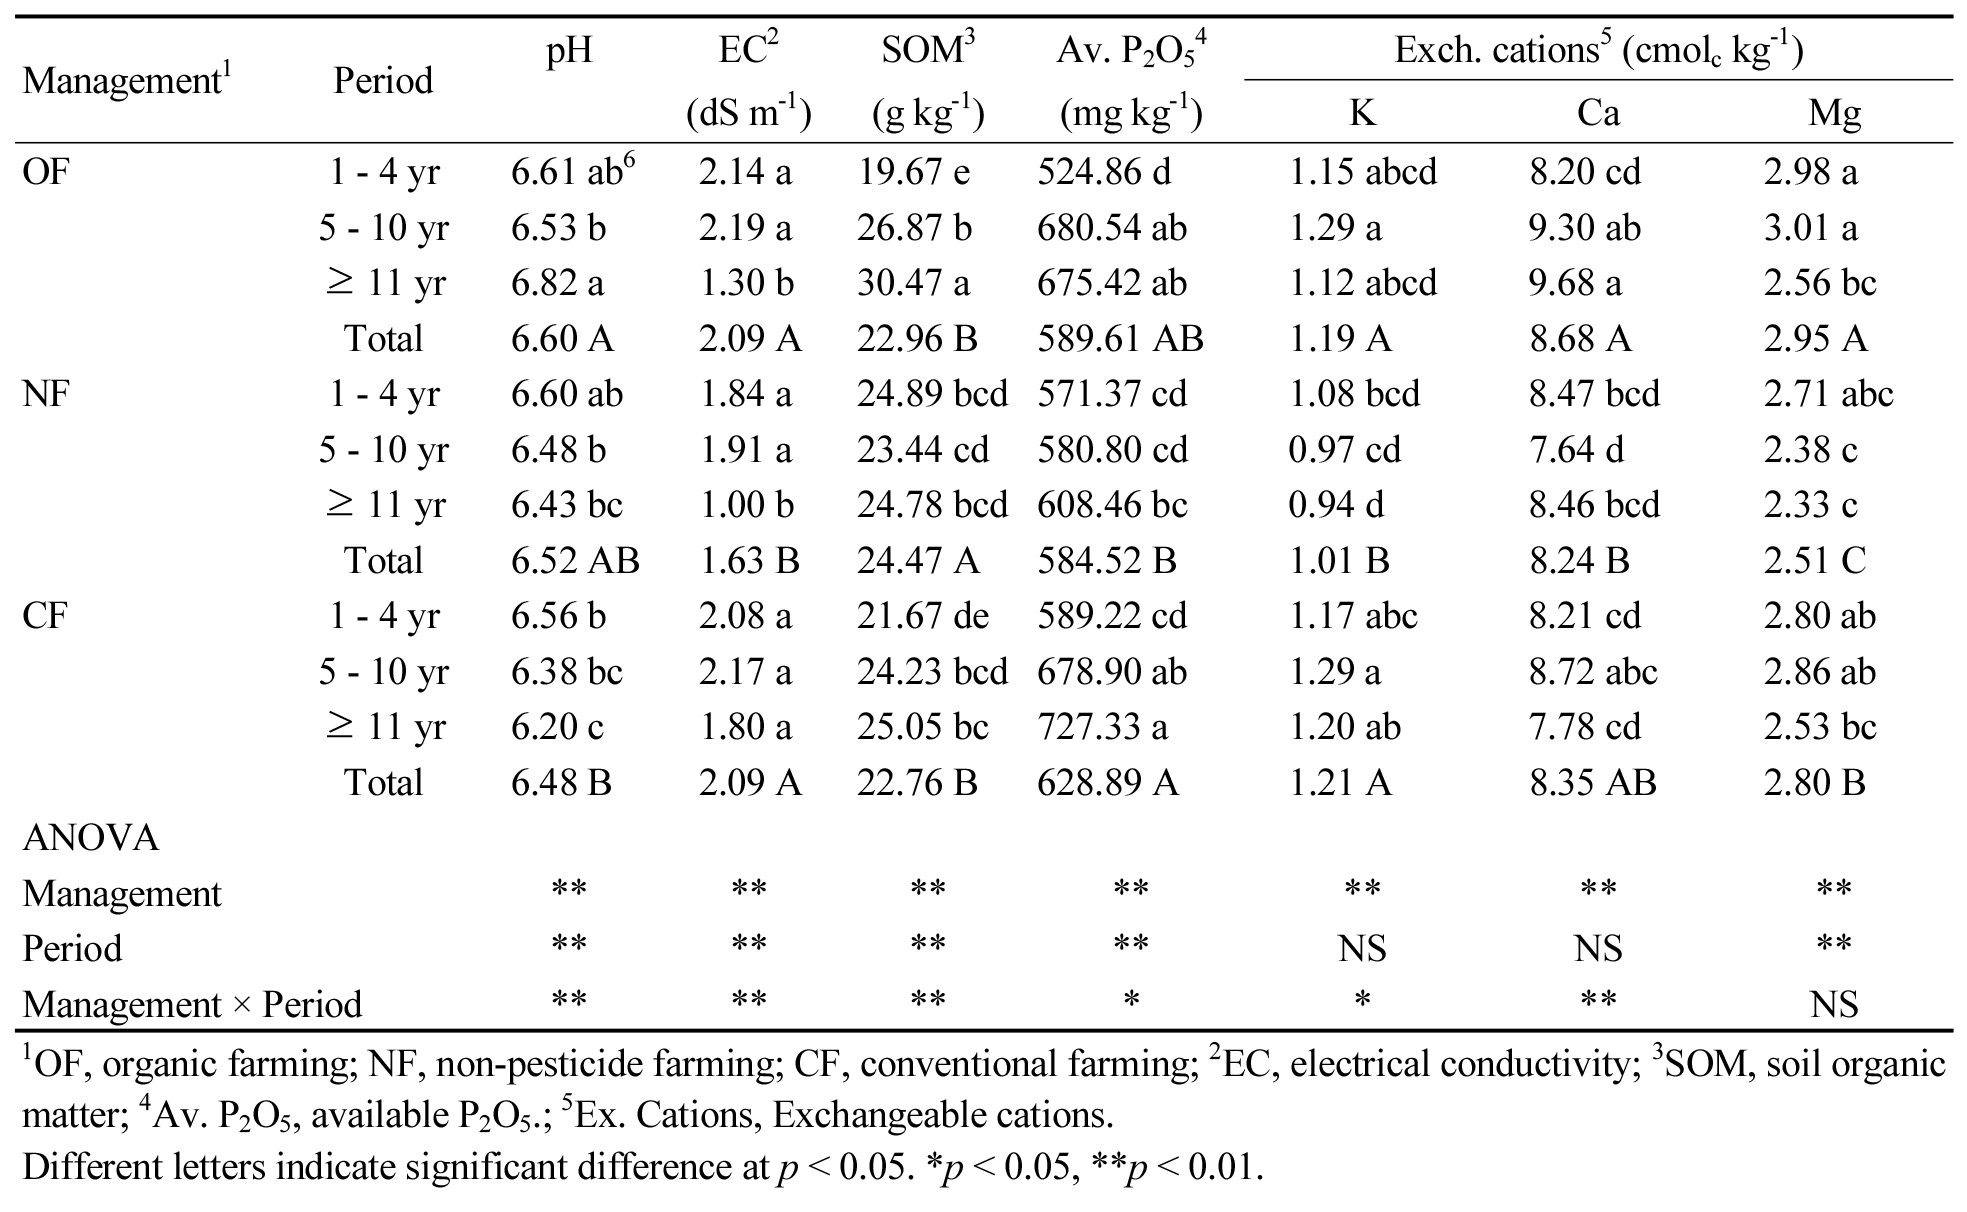
- Soil chemical properties play a key role in determining the growth, nutrient uptake, and fruit quality of perennial crops such as grapes. …
- Soil chemical properties play a key role in determining the growth, nutrient uptake, and fruit quality of perennial crops such as grapes. This study assessed soil health based on the chemical characteristics of under different management practices and orchard ages. These nationwide soil properties datas were obtained from Heuktoram, Korea’s national soil testing information system. The management systems were categorized into organic farming (OF), non-pesticide farming (NF), and conventional farming (CF), while orchard age was classified as 1 - 4 years, 5 - 10 years, and over 11 years. Under OF, Soil pH increased with orchard, whereas it tended to decrease under NF and CF. Soil organic matter (SOM), an indicator of soil health improvement, showed the highest content in OF orchard older than 10 years, with a 55% increase compared to 1 - 4 years, while CF exhibited only a 15% increase. Available P₂O₅ (Av. P₂O₅) content increased with orchard age across all management systems. Exchangeable cation (Ex. cation) contents were generally higher in OF and CF than in NF. However, both Av. P₂O₅ and Ex. cations levels exceeded the optimal range, precise nutrient management based on soil testing is essential to prevent potential environmental pollution. The soil health index, evaluated based on soil chemical properties, was highest in OF orchards aged 5 - 10 years and over 11 years, ranging from 5.16 to 5.19. This was primarily attributed to the elevated SOM index (0.63 - 0.74) in these orchards, indicating that long-term organic management enhances SOM content, thereby improving soil chemical properties and promoting overall soil health. Soil chemical properties under different management practices and orchard ages. Management1 Period pH EC2 SOM3 Av. P2O54 Exch. cations5 (cmolc kg-1) (dS m-1) (g kg-1) (mg kg-1) K Ca Mg OF 1 - 4 yr 6.61 ab6 2.14 a 19.67 e 524.86 d 1.15 abcd 8.20 cd 2.98 a 5 - 10 yr 6.53 b 2.19 a 26.87 b 680.54 ab 1.29 a 9.30 ab 3.01 a ≥ 11 yr 6.82 a 1.30 b 30.47 a 675.42 ab 1.12 abcd 9.68 a 2.56 bc Total 6.60 A 2.09 A 22.96 B 589.61 AB 1.19 A 8.68 A 2.95 A NF 1 - 4 yr 6.60 ab 1.84 a 24.89 bcd 571.37 cd 1.08 bcd 8.47 bcd 2.71 abc 5 - 10 yr 6.48 b 1.91 a 23.44 cd 580.80 cd 0.97 cd 7.64 d 2.38 c ≥ 11 yr 6.43 bc 1.00 b 24.78 bcd 608.46 bc 0.94 d 8.46 bcd 2.33 c Total 6.52 AB 1.63 B 24.47 A 584.52 B 1.01 B 8.24 B 2.51 C CF 1 - 4 yr 6.56 b 2.08 a 21.67 de 589.22 cd 1.17 abc 8.21 cd 2.80 ab 5 - 10 yr 6.38 bc 2.17 a 24.23 bcd 678.90 ab 1.29 a 8.72 abc 2.86 ab ≥ 11 yr 6.20 c 1.80 a 25.05 bc 727.33 a 1.20 ab 7.78 cd 2.53 bc Total 6.48 B 2.09 A 22.76 B 628.89 A 1.21 A 8.35 AB 2.80 B ANOVA Management ** ** ** ** ** ** ** Period ** ** ** ** NS NS ** Management × Period ** ** ** * * ** NS 1OF, organic farming; NF, non-pesticide farming; CF, conventional farming; 2EC, electrical conductivity; 3SOM, soil organic matter; 4Av. P2O5, available P2O5.; 5Ex. Cations, Exchangeable cations. Different letters indicate significant difference at p < 0.05. *p < 0.05, **p < 0.01. - COLLAPSE
-
Opinion

- Urgent need for a comprehensive assessment of large-scale microplastic pollution in plastic-intensive agriculture
- Juhwan Lee, Haegeun Chung
- Microplastic accumulation in agricultural soils poses a growing environmental concern, affecting soil fertility, microbial communities, and crop productivity. This paper reviews current …
- Microplastic accumulation in agricultural soils poses a growing environmental concern, affecting soil fertility, microbial communities, and crop productivity. This paper reviews current knowledge of soil microplastic toxicity, summarizes documented effects on plant and soil processes, and proposes a strategy for targeted analyses using existing soil archives. While laboratory and field studies have provided valuable mechanistic insights, their limited spatial and temporal scope constrains real-world applicability. Studies in soil systems, particularly those accounting for the origin, distribution, and environmental behavior of microplastics, are still limited. Moreover, current soil and crop evaluations often rely on single polymer type and assume a linear relationship with crop toxicity, which remains questionable. This study highlights the lack of data capturing both spatial and temporal variability of microplastics in the agricultural soils. Notably, no comprehensive Korean database currently links soil microplastic contamination to crop growth and yield under field conditions. Establishing such a database is essential to support risk assessment, agricultural management, and improving biogeochemical modeling tailored to Korean soils and cropping systems. Therefore, a unified information system for agricultural microplastic management is needed to integrate physiological and biogeochemical data across scales. A strategy for the development of a new soil-crop-microplastic database is proposed to enable targeted analyses and large-scale assessments. - COLLAPSE

Journal Informaiton
 Korean Journal of Soil Science and Fertilizer
Korean Journal of Soil Science and Fertilizer


한국토양비료학회
Room 313, National Institute of Agricultural Science, 166, Nongsaengmyeong-ro, Iseo-myeon, Wanju-gun, Jeollabuk-do, Korea, 55365
Tel: +82-63-226-7335 / Fax: +82-63-226-7335 / E-mail: ksssf733@naver.com Copyright© Korean Society of Soil Science and Fertilizer. Powered by APUB
Tel: +82-63-226-7335 / Fax: +82-63-226-7335 / E-mail: ksssf733@naver.com Copyright© Korean Society of Soil Science and Fertilizer. Powered by APUB

