

Introduction
Materials and Methods
Site description
Soil sample
Heavy metal analysis preparation
Soil contamination index and Soil Pollution index analysis
Statistical analysis
Results and Discussion
Assessment of heavy metals in soil
Contamination index of heavy metals in soil
Conclusions
Introduction
One of the most urgent issue for agriculture is to secure safe food worldwide (Kong, 2014). Evaluating soil quality and monitoring the agricultural process can help make better food and environmental quality (Kloke, 1979; Sutherland, 1999; Wu et al., 2010; Ahmadi et al., 2017). Soil is an important material and essential medium for agricultural production system. Many researchers determined how to use and manage soils for growing crops (Rowell, 1937). But some of the human activities affect negatively and detrimentally on the environment. Economic and industry expansion around the world is influenced on the environmental side (Kim et al., 1996; Kim et al., 2003; Jung et al., 2005; Lee et al., 2010). Especially, serious pollution issues around the agricultural field near industrial complexes should be prevented (Chen et al., 2005).
Near industrial complexes, growing vegetables and crops could be potential threat for human because crops containing heavy metals may be consumed by human. Heavy metals in soil is one of the major environment concerns at every industrial complex. Toxicity of heavy metals can be negatively influenced on crops growth, enzymatic and photosynthesis activity and also damages the root system (Johansson et al., 1998). The researchers in the many countries have found that various crops are accumulated with heavy metal through contaminated soil, and these heavy metals have detrimental effects on human health (Nriagu, 1996; Saby et al., 2011; Schneider et al., 2016; Hu et al., 2016). Heavy metals are easily transferred into food chains and stayed in the human body, such as the heart, liver, and kidney that can result in serious health disorders such as gastrointestinal cancer (Jarup et al., 2003; Duruibe et al., 2007; Jolly et al., 2013). Cadmium (Cd), chromium (Cr), copper (Cu), lead (Pb), nickel (Ni), and zinc (Zn) were found in soils. Soil Contamination Warning Standard (SCWS) which is regulated by Soil Environment Conservation Law (SECL) in the Republic of Korea is categorized. Warning levels for cultivated lands (Region 1) are 25, 4, 150, 100, 200, and 300 mg kg-1 for As, Cd, Cu, Ni, Pb, and Zn, respectively. Some of the heavy metals are the most hazardous elements for human health such as arsenic (As) (Karaca et al., 2010). Cadmium (Cd) and mercury (Hg) can be absorbed in the plant tissue and cause direct impact on human and animal health if they were consumed (Holmgren et al., 1993; Kim, 1996; Vulava et al., 1997). Lead (Pb) and cadmium (Cd) were accumulated in rice, basil, ginger, and onion (Kim et al., 2008). The quality of agricultural products is closely related to human health and environment (Jarup, 2003; Akoto et al., 2008).
This study will help us understand how much heavy metals in soils contain near industrial complexes in Jeon-Nam province. Also, this research can provide some important information on food and soil safety issues based on Soil Contamination Warning Standard (SCWS) which is regulated by Soil Environment Conservation Law (SECL). The objective of this study was to investigate heavy metal concentrations and to provide heavy metal concentrations in agricultural soils around industrial complexes in Jeon-Nam province, Korea.
Materials and Methods
Site description
This study was conducted in 2018 in Jeon-Nam Province. Soil sampling sites were selected at agricultural fields near industrial complexes in 10 counties (Gwangyang, Muan, Yeongam, Hampyeong, Haenam, Naju, Jangheung, Boseong, Yeosu, Damyang) in Table 1. Ten agricultural fields near industrial complexes in each county were randomly selected, with four directions (east, west, south, and north). Two depth soils (0 - 15 and 15 - 30 cm) were collected within 0 - 500 meter and 500 - 1000-meter radius at each industrial complex. Five of ten agricultural fields were located at within 0 to 500-meter radius from the borderline of each industrial complexes, while the other half was located within 500- to 1000-meter radius from the borderline of each industrial complexes.
Table 1.
Monitored industrial complexes in Jeon-Nam province in 2018 in Korea.
Soil sample
Five soil cores were collected using soil auger (Eijelkamp one-piece soil auger, Gempler’s, Giesbeek, Netherlands) and thoroughly mixed well and stored in a plastic bag. The total numbers of soil samples were 300 soil samples (150 for 0 - 15 cm depth and 150 soil sample for 15 - 30cm depth). Collected soil samples were air-dried and sieved with a 2 mm sieve for further analysis (MOE, 2016).
Heavy metal analysis preparation
Dried soil samples were milled with Zirconia balls (DAIHAN, Korea) by mill machine for 5 days at 10000 rpm. The soil samples are finely ground. For heavy metal analysis, three grams of soils were weighed and mixed with 21 ml. of hydrochloric acid (HCI) and 7 ml of nitric acid (HNO3). Then, soils with mixed solution were heated for 2 hours at 120°C using heating plate (Block Heating Sample Preparation System, US/MHB-250, Ctrl-M Science). Total volume of wet-digested samples as filled up to 100 ml. The wet-digested samples were filtered through filter paper No. 2 (Advantec No.2, 110 mm), and analyzed for arsenic (As), cadmium (Cd), chromium (Cr), cupper (Cu), nickel (Ni), lead (Pb), mercury (Hg), and zinc (Zn) (MOE, 2016). The heavy metal concentration was measured using an ICP-OES, (Optima 7300DV, Perkin Elmer, USA). The standard solutions were prepared using ICP grade multi-element standard for Cd, Cr, Cu, Ni, Pb, and Zn (Inorganic ventures, USA) and single-element standard for As and Hg (Kriat Co.,Ltd., Korea). A calibration curve using a standard solution was obtained. An individual heavy metal standard solution was prepared. In details, single-element standard As and Hg concentrations were 0.1, 0.5, 1, 5, 10, 20, 50 and 100 mg kg-1 and multi-element standard (Cd, Cr, Cu, Ni, Pb and Zn) were 0.1, 0.5, 1, 5, 10, 20, 50 and 100 mg kg-1. For soil sample analysis a batch of 20 samples were a blank, control (lab soil standard), BAM (BAM-U112a) (Federal Institute for materials research and testing, Germany), a soil sample, duplicate the first soil sample, and rest of soil samples.
Soil contamination index and Soil Pollution index analysis
The assessment of the soil contamination was carried out using several evaluating methods, pollution index (PI) and pollution load index (PLI), and the soil pollution index (SPI). The pollution index (PI) was calculated using the modified formula based on Hakanson (1980).
Where Cn is the concentration of the examined element in the soil, Bn is the geochemical background value. The background values were used from a study (Liao and Chao, 2004). The selected reference background values are usually background concentration of heavy metals in earth’s crust. The background values for this study were averaged values from 2070 paddy rice soil samples (Yun et al., 2018; Lee et al., 2019). The background values serve to assess contamination by comparing current and pre-industrial concentration of heavy metal concentrations. The concentration of As, Cd, Cu, Ni, Pb, and Zn were 3.68, 0.22, 14.9, 14.1, 16.7, and 56.8 mg kg-1 respectively. The PI values are classified into 4 classification index (Table 2).
Table 2.
Classfication of different soil contamination assessment of pollution index (PI).
| Classification index | PI value | Description of class |
| 1 | PI<1 | Uncontaminated |
| 2 | 1≤PI<2 | Slightly polluted |
| 3 | 2≤PI<3 | Moderately polluted |
| 4 | 3<PI | Highly polluted |
The contamination level of heavy metals was assessed by pollution load index (PLI). The pollution load index was evaluated for the extent of the metal pollution. Where n is the number of metals studied, for in this paper is 7 elements and PI is the pollution index value from equation (1). The pollution load index (PLI) was calculated using the modified formula based on Angulo (1996) and Jorfi et al. (2017). The PLI values are classified into 4 classification index (Table 3).
Soil pollution index was evaluated based on the levels of Soil Contamination Warning Standard (SCWS) which is regulated by Soil Environment Conservation Law (SECL). Warning levels for cultivated lands (Region 1) were 25, 4, 150, 100, 200, and 300 mg kg-1 for As, Cd, Cu, Ni, Pb, and Zn, respectively. Soil pollution index was calculated the equation below.
If SPI is greater than 1 each heavy metal concentration is higher than soil contamination warning standard, while SPI is less than 1 soil heavy metal concentration is within the levels of soil contamination warning standard.
Table 3.
Classification of different soil contamination assessment of pollution load index (PLI).
| Classification index | PLI | Description of class |
| 1 | PLI=0 | Background concentration |
| 2 | 0<PLI≤1 | Unpolluted |
| 3 | 1<PLI≤2 | Moderately polluted |
| 4 | 2<PLI | Highly polluted |
Statistical analysis
All experiments data are expressed as means and standard deviation. The 0.05 p values were considered a statistically significant using SPSS program version 12.0, USA.
Results and Discussion
Assessment of heavy metals in soil
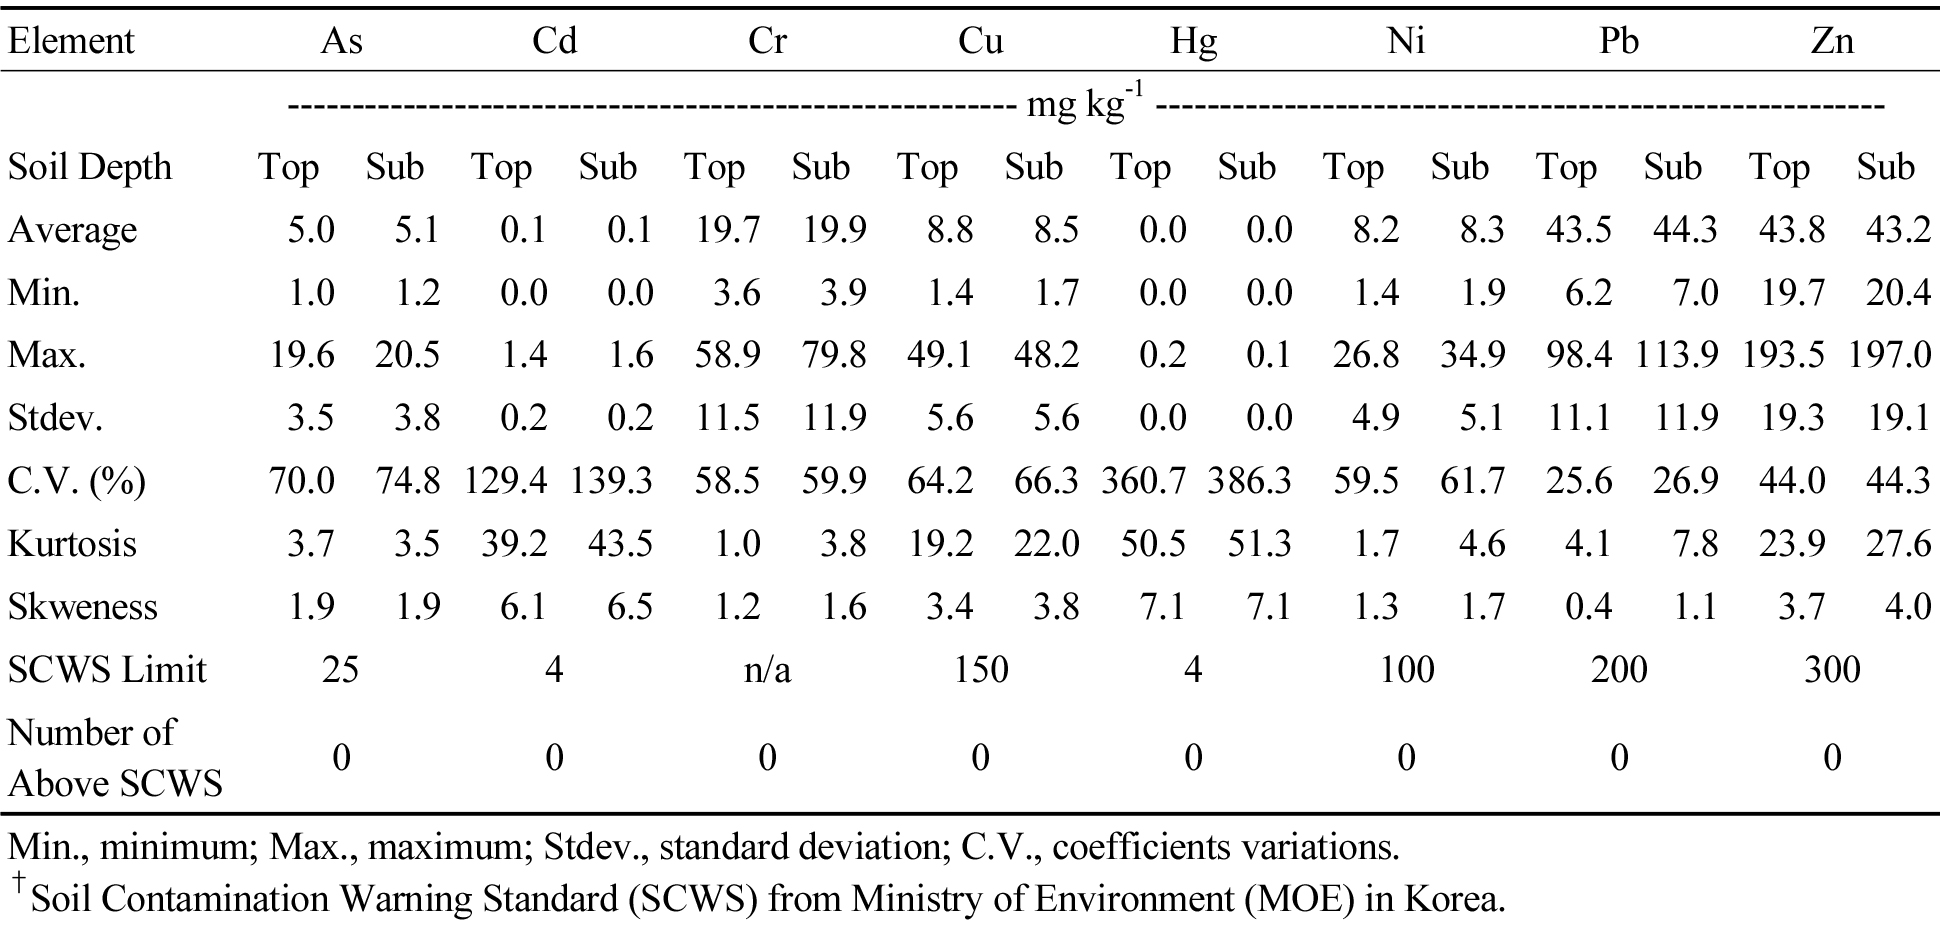
The descriptive statistics of heavy metal concentration in soil in Jeon-Nam province was listed in Table 4. The values in table 4 showed for average, minimum (Min.), maximum (Max.), standard deviation (stdev), coefficients of variation (C.V(%)), Kurtosis, and Skweness with two soil depths (0 - 15 cm depth for top soil and 15 - 30 cm depth for subsoil). Eight heavy metals were As, Cd, Cu, Hg, Ni, Pb, and Zn,. Averaged value for top and sub soils were 5.0, 5.1 mg kg-1 for As, 0.1, 0.1 mg kg-1 for Cd, 19.7, 19.9 mg kg-1 for Cr, 8.8, 8.5 mg kg-1 for Cu, 0.0017, 0.0014 mg kg-1 for Hg, 8.2, 8.3 mg kg-1 for Ni, 43.5, 44.3 mg kg-1 for Pb, 43.8, 43.2 mg kg-1 for Zn. Overall, averaged eight heavy metals for all soil samples were below the levels of Soil Contamination Warning Standard (SCWS) for cultivated lands, which is regulated by Soil Environment Conservation Law (SECL), Ministry of Environment (MOE) in Korea.
Table 4.
Descriptive statistics of heavy metal concentrations in agricultural soils near the industrial complexes in Jeon-Nam Province in Korea.
The averaged heavy metal concentrations of top and sub soils for each individual averaged industrial complexes in Jeon-Nam province were shown in Table 5. The highest As concentrations were shown in Jangheung and Milyeog counties. The highest concentration of Cr and Ni were shown in Milyeog and Joseong counties. However, all of the heavy metal concentrations were lower than SCWS.
Table 5.
Heavy metal concentrations for top and sub agricultural soils near the industrial complexes in Jeon-Nam Province in Korea.
Contamination index of heavy metals in soil
The pollution index (PI) is another indicator to evaluate pollution. The average PI values of all seven heavy metals ranged between 0.0 to 0.6 for top and sub soils (Table 6). Pollution index indicated that all soil sample are not polluted because pollution index values are less than 1 (Table 2) (Wu et al., 2014; Mohammadpour et al., 2016; Jorfi et al., 2017). Kim et al. (2016) reported that PI was ranged from 0.29 to 0.47. The average PI values of all 8 heavy metal elements were less than 1. These results suggested that agricultural soils near industrial complexes in Jeon-Nam province were not contaminated by heavy metals. For this study, heavily to extremely contaminated and extremely contaminated were not observed. The highest PI values were shown for As at Milyeog and Jangheung agricultural industrial complex and for Pb at Milyeog agricultural industrial complex.
Table 6.
Pollution index (PI) and pollution load index (PLI) for top and sub agricultural soils near the industrial complexes in Jeon-Nam Province in Korea.
The PLI for all trace elements ranged from 0.10 to 0.24 for top and sub soils (Table 7). The pollution load index (PLI) was classified into Group2: 0< PLI≤1 (Unpolluted) (Table 3) (Jorfi et al., 2017). The highest PLI values were at Milyeog and Joseong agricultural industrial complex, and Jangheung agricultural industrial complex. The PLI values were less than 1. These results suggested that agriculture soils near industrial complexes in Jeon-Nam province were unpolluted by heavy metals and safe for agriculture activities.
Table 7.
Soil Pollution index (SPI) for top and sub agricultural soils near the industrial complexes in Jeon-Nam Province in Korea.
These results were suggested that 10 counties agriculture soils near industrial complexes in Jeon-Nam province was unpolluted by heavy metals. For this study, the pollution index (PI) and pollution load index (PLI) were categorized in Group 1, unpolluted. In case of mercury (Hg) elements, the Hg data were not present because Hg concentration in soil is lower than pollution background factor.
Soil contamination assessment was evaluated with soil pollution index (Table 7). All soil sample is unpolluted because soil SPI is lower than 1. SPI of As ranged from 0.01 to 0.07, SPI of Cd ranged from 0.00 to 0.02, SPI of Cu ranged from 0.00 to 0.01, SPI of Hg ranged from 0.00 to 0.00, SPI of Ni ranged from 0.01 to 0.03, SPI of Pb ranged from 0.02 to 0.04, and SPI of Zn ranged from 0.01 to 0.03. Although, highest SPI values were shown in As. SPI values of As was the highest at Jangheung and Miyeog agricultural industrial complex than other sites. These results suggested that agriculture soils near industrial complexes in Jeon-Nam province was uncontaminated by heavy metal. Kim et al. (2015) reported that SPI for As, Cd, Cu, and Pb was 0.92 for sub soil and 0.68 for sub soil from closed mine area, while Min et al. (2016) reported that SPI was ranged from 0.03 to 0.27.
Conclusions
In this study, 300 agricultural soil near industrial complexes in Jeon-Nam, Korea were analyzed for 8 heavy metals. All of heavy metal concentrations were below the SCWS and categorized into Group 1 which is not polluted for any heavy metals. Other soil pollution indicators, such as PI, PLI, SPI showed that monitored sites near industrial complexes in Jeon-Nam province are not polluted. For PI of Hg element, the Hg data may not be well present for pollution status because Hg concentration in soil is lower than pollution background factor. These results suggest that for calculating PI, heavy metal concentration and background concentration should be used very carefully if heavy metal concentration in soil is lower than background concentration. Further research is needed to monitor and evaluate soil contaminations based on heavy metals levels.
