

Introduction
Materials and Methods
Materials
Particle distribution
Prediction of soil water retention characteristics using vG model with TRETC
Statistical analysis
Results and Discussion
Conclusions
Introduction
The selection of a growing medium is important in the culture of hydroponic crops. Individual components of mixed growth media are to be chosen by considering their properties so that they complement each other and the resultant medium possesses most of the desirable attributes for good plant growth and production (Markoska et al., 2018). Therefore, knowledge of physical properties of the growth media, particularly bulk density and air-filled porosity which have a significant impact on plant growth, is essential in properly managing irrigation and fertilization programs.
Popularity for perlite as horticultural growth media is largely due to the balance between water-holding capacity and drainage. Perlite which has unusual property of greatly expanding up to 15 - 20 times its original volume when sufficiently heated is an amorphous volcanic glass. The typical expanded perlite has a bulk density of about 0.03 - 0.15 g cm-3, while unexpanded (raw) perlite has a bulk density around 1.1 g cm-3. The expanded perlite has different physical properties including surface area, bulk density, porosity, water absorption and a low bulk density from 0.03 - 0.15 g cm-3 (Yeager et al., 2000; Abad et al., 2001; Samar and Saxena, 2016). Also, it has a relatively high water content, typically formed by the hydration of obsidian (Reka et al., 2019). The amount of water taken up by particles of perlite is largely dependent on particle sizes. Perlite holds water in one of three ways: in between individual grains, in channels leading to the cores of the grains and on the highly irregular surfaces of each particle (Perlite Institute, 2019). The water that can be superficially retained on perlite and released slowly at a low tension is decisive factor for plant growth (Maloupa et al., 1992). The ability of the growth media to retain and maintain moisture is crucial for improving the efficiency of water use for growing crops in greenhouses. The various grades of perlite can significantly influence the amount of water retained in perlite. Horticultural grades of perlite retain between 20 - 50% water by volume depending on size and gradation (Perlite Institute, 2019). Size gradation and the amount of pressure applied to the growth media are factor of capacity to determine the accessible amount of water in growth media (Perlite Institute, 2019). Therefore, growth media manufacture needs method to select the best particle size distribution in production of growth media using the various grades of perlite.
According to Richards (1955), water retention curves (WRC) have great practical and theoretical importance, because they show all important information about water properties and management in growth media. The WRC is commonly used to evaluate the water sensitivity of growth media, that provides information about the water storage capacity of growth media of which water is controlled by the flow of free water through the macropores and the water adsorption at micro porosity (Olivella and Gens, 2000; Romero and Vaunat, 2000). However, the water retention curve of which measurement is time consuming and labor intensive has to be determined about capacity for available moisture content that can be calculated by the difference between field capacity as the upper limit and permanent wilting point as the lower limit.
Pedotransfer functions (PTFs) as a predictive functions describing soil water retention curves have been widely used in crop, soil, and land surface models. The water retention curves represented by van Genuchten equation (van Genuchten, 1980) which can be constructed by point and parametric estimation. The point estimation is estimated at selected water potentials (Batjes, 1996; Pachepsky et al., 1996; Minasny et al., 1999) while the parametrization method estimates the parameters of soil water retention models (Vereecken et al., 1992; Wösten et al., 1995; Schaap et al., 1998; Minasny and McBratney, 2002). The parametrization of the WRC introduced by van Genuchten is maybe the most common computer model.
The focus of this work is to predict the water retention characteristics of perlite by parametrization method based on the van Genuchten equation after several quality measurements of volumetric water content at matric potential corresponding to saturation to residual state of perlite. Therefore, this investigation helps to determine that a PTF using the van Genuchten equation can be used to calculate mixing ratio for different sizes of perlite for adequate water management of perlite as growth media for plant growth.
Materials and Methods
Materials
To investigate water retention curves of perlite, several bags of expanded perlite was obtained from a growth media manufacturer located in Jinchun, Choongbuk Province. The perlite had been screened to exclude particles greater than 10 mm in diameter. The density of perlite which was first dried for 48 h at 70°C in a hot air oven was determined by a pycnometer following the methods used by Monteiro et al. (2008). Bulk density filled in specific aluminum cylinders was calculated by dividing dry weight (24 h at 105°C) by volume. The porosity (P) was measured using P = 1 - (ρb/ρs) (ρb and ρs are bulk density and particle density, respectively). As basic chemical properties of screened and oven-dried perlite samples, pH and EC were measured with pH-EC combination meter (Thermo AK-150, USA) using a perlite-to-water ratio of 1:5. Cation exchange capacity (CEC) were determined by the ammonium acetate exchange method.
Particle distribution
The particle size distribution using 200 g of perlite was determined by a dry sieving the perlite through standard sieves which were grouped into 5 mechanical sieves (0 - 0.50, 0.50 - 1.0, 1.0 - 2.36, 2.36 - 4.75 mm, and 4.75 - 10.0 mm). The mass of fragments remaining on each sieve after the process was used to calculate the distribution of fragments, which were then normalized with respect to the total mass. The equations of particle distribution curves for the perlite samples can be expressed as Eq. 1 while Rosin-Rammler-Bennet (RRB) distribution describing the percentage by mass of particles (R) greater than screen size (d) is given as Eq. 2.
where, do represents the particle size corresponding to the 36.8th percentile of the cumulative probability distribution (size constant), and n controls the shape of the distribution (uniformity coefficient). The uniformity coefficient and the coefficient of gradation are given by the relation:
where, Cumi is the uniformity coefficient and D60 is the diameter corresponding to 60% finer in the particle-size distribution. Cgrad is the coefficient of gradation and D30 diameter corresponding to 30% finer.
Prediction of soil water retention characteristics using vG model with TRETC
The water retention curves of perlite were determined with five different sizes of the perlite prepared by the mechanical sieve method. Before measuring water retention characteristics of each particle distribution, the samples were loosely filled into open-ended metal cubes and compressed with a pressure of 10 g cm-2. According to the method described in Klute (1986), the samples in open-ended metal cubes were saturated by capillary rise to measure the volumetric water content (θv) at 11 matric potentials (0, -1, -5, -10, -33, -50, -100, -300, -500, -1,000, -1,500 kPa). The water retention characteristics between 0 and 50 kPa and 50 and 1,500 kPa were measured by the sand-box and kaolin-plate and by pressure chamber method, respectively. The volumetric water retention for each sample at different matric potentials was calculated in relation to the initial wet sample volume at -0.1 kPa matric potential.
The best fitted parameter values (θs, θr, n, α) of the vG model (Eq. 5, Eq. 6) using the RETC with the parameter m = 1-1/n for the perlite samples were obtained as proposed by Mualem (1976). Each parameter set was then fitted to the vG equation which was adopted as the basic functional relationship between estimated soil water content [θ(ψ), cm-3 cm-3) and the corresponding absolute value of the matric potential (|ψ|, kPa), given as follows:
in which θs and θr are the saturated and residual water contents, respectively, expressed on a volume basis (cm-3 cm-3); α (kPa-1), |ψ| is the absolute value of the matric potential (kPa); n and m (dimensionless) are shape parameters subjected to the restriction m = 1 - 1/n.
Saturated water content, θs, can be determined based on the water content of saturated soil samples. Residual water content, θr, can be obtained from WRC or determined by measurement of water content in dry soil samples. However, since θs can be either measured directly or estimated as a fraction of the total soil porosity, then an alternative approach is to optimize only the other three parameters, which can be adjusted under the following restrictions: θr ≥ 0.0001; n ≥ 1.0001; α ≥ 0.0001. For these experiments, there were five replicates and statistiꠓcal analysis was performed using Excel to assess the differences among the values of the five replicates.
Statistical analysis
The perlite particle distribution along with their standard deviations (SD) and standard error (SE) in Table 2 were calculated. To evaluate the accuracy of the estimated vG model parameters, the root mean square error (RMSE) of the estimated and measured water content values to reflect a magnitude of the mean difference between observations and predictions, the mean bias error (MBE) to represent the systematic error in the regression model, and the coefficient of determination (R2) to compare the relation between measured and predicted parameters were used (Eq. 3, Eq. 4, Eq. 5), respectively (Baker and Ellison, 2008). SSR is the regression sum of squares to quantify the estimated sloped regression line, Pi, is from the horizontal “no relationship line”, the sample mean or . SSE is the “error sum of squares” and quantifies how much the data points, Mi, vary around the estimated regression line Pi. Total sum of squares (SSTO) quantifies how much the measured data points, Mi, vary around their mean, . SSTO can be expressed as sum of SSE and SSR. SSR tell us that most of the variation in the response of value of SSTO is just due to random variation (SSE), not due to the regression of y on x by regression sum of squares (SSR).
(1) root mean square error (RMSE)
(2) mean bias error (MBE)
(3) coefficient of determination (R2)
where, Pi and Mi are the predicted and measured values of the i-th measured data, respectively; is the mean of measured values.
Results and Discussion
The size proportion of the perlite sample was in the order of 45.9% (1.0 - 2.36 mm), 38.9% (1.0 - 2.36 mm) and 5.89% (2.36 - 4.75 mm), revealing that particle distribution of the perlite sample consists of mainly sand-sized particles (92.8 %) with gravel-sized particles (7.14 %) (Table 1).
Table 1
Particle size distribution of perlite.
The particle distribution curve for the particle sizes, a grade size distribution curve including D60, D30, and D10. D10 are represented as shown in Fig. 1.
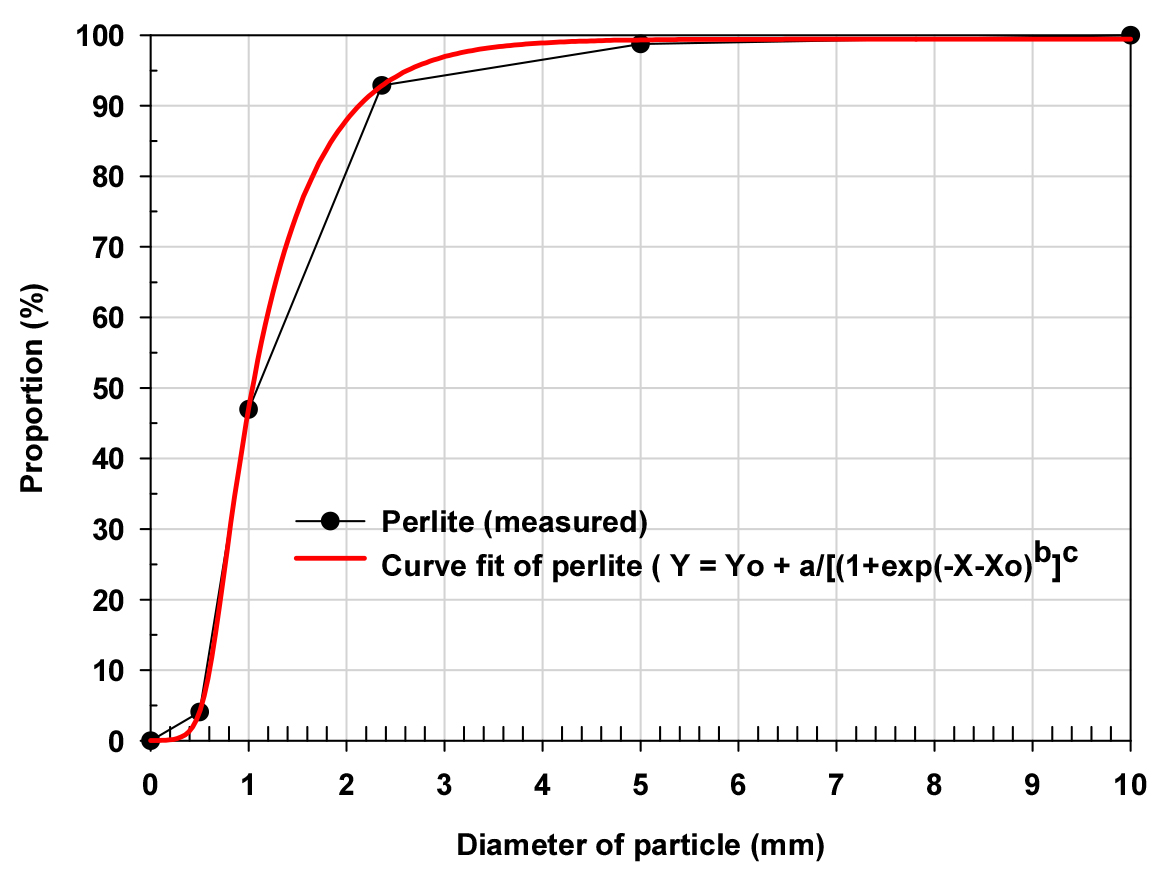
The parameters and coefficients were obtained from Fig. 1 by substitution of measured value of the proportion corresponding to D60, D30, and D10 in Table 2. Then, the Eq. 3 were can be expressed as Eq. 13 to calculate particle diameter corresponding to DN that means proportion of particle size at which N% of the particles are finer and 100-N % of the particles are coarser than DN size. The actual equation to figure out the actual perlite particle size can be expressed as Eq. 13. X and Xo in Eq. 13 mean the designated and initial diameter of the particle corresponding to the uniformity coefficient (Cumi) for a given proportion.
Table 2
Parameters and coefficients of equations describing the particle distribution curves of the perlite and the cocopeat.
| Parameter | a | b | c | Xo | Yo |
| a | 9.858 × 10 | 0.371 | 1.738 × 10³ | -1.879 | -0.661 |
The particle size (do) corresponding to 36.8 percentage by mass of particles (R) was 0.80065 mm. The particle diameter of the perlite corresponding to D60, D30, and D10 were 0.612, 0.809 and 1.204 mm, respectively. Using these values, the calculated uniformity coefficient Cumi and the coefficient of gradation Cgrad for the perlite were 1.96 and 2.51. Compared the Cumi class classified as poorly graded (2 - 3) with the calculated Cumi value of the perlite, the perlite can be estimated as poorly graded but well graded. The percentages by mass of particles (R) greater than screen size (d) based on D60, D30, and D10 in Table 3 showed that the particle sizes greater than D10 was 55.4 % for the perlite (Table 3).
Table 3
Uniformity coefficient (Cumi), curvature coefficient (Cgrad) and R of the perlite.
| Parameter | D10 | D30 | D60 | Cumi | Cgrad | do | R | ||
| D10 | D30 | D60 | |||||||
| Perlite | 0.612 | 0.809 | 1.204 | 1.96 | 0.89 | 0.8007 | 55.4 | 36.04 | 7.10 |
The results of the particle density, pH and EC for different sizes of the perlite are presented in Table 4. The mean particle density of the perlite were similar regardless of the particle size while the mean pH and EC of both substrates were decreased with increasing particle size, that can be attributed by decrease in surface area with increasing particle size. The CEC of the perlite that represent the available nutrient capacity depending on the chemical properties of perlite was also decreased with increasing particle size. Thus, we can assume that pH, CEC and EC can be influenced by particle size.
Table 4
Particle density, pH and EC of the perlite and the cocopeat depending on the particle size.
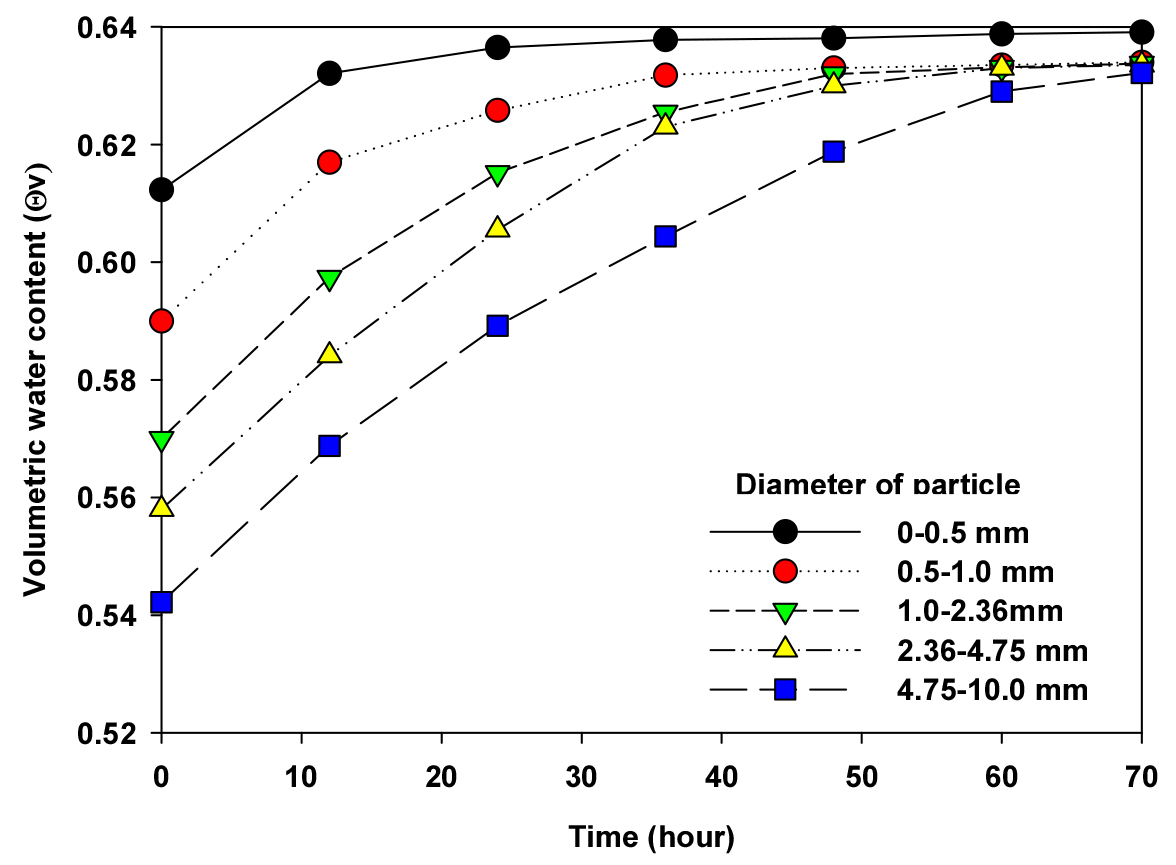
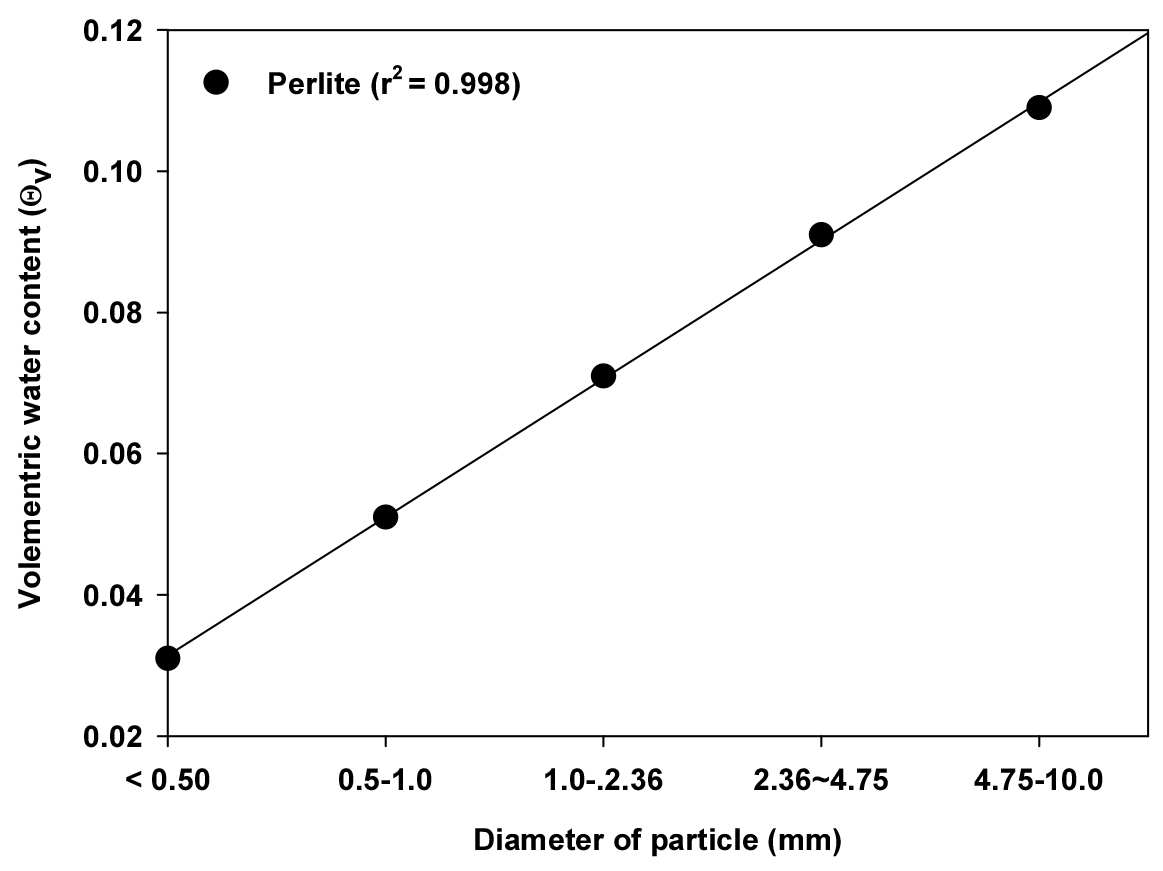
The mean particle densities of five levels of the perlite sample was 0.272 g cm-3. The calculated porosities of the perlite for 9 levels of bulk density ranged from 0.09 to 0.17 g cm-3 were linearly decreased with increasing bulk density. This can be attributed by decrease in effective pore size by compaction of particle arrangement. Measured pore volumes by saturation with water for the five levels of perlite particle size were increased with decreasing particle size of perlite (Fig. 2) while the difference between initial and final pore volumes were increased with increasing particle size. We can assume that the results of the saturated pore volumes can be attributed by lower initial bulk density with decreasing particle size and increasing internal pore volume within perlite particle with increasing particle size (Fig. 3). The time required to saturate the whole pore volume including internal and external pore was approximately 24 hours and 72 hours for the particle sizes of less than 0.5 and 4.75 - 10.0 mm, respectively. Like this, the time to saturate the whole pore was increased with increasing particle sizes up to approximately 70 hours. This indicates that increase in time can be caused by retarded absorption by the indigenous internal pore within the perlite particle of perlite and decrease in external porosity.
The statistical parameters, RMSE, MBE and R2 of median, minimum and maximum which are calculated based on the predicted value (Pi), the sample mean () and the data points (Mi) are presented in Table 5. The highest RMSE values of 0.0276 from maximum of 2.36 - 4.75 mm indicate that experimentally measured θv led to the best fit of all the soil samples for all five soil series while the values of MBE which were below zero show that means the θv measured at the water potentials are under-predicted. From these results, we could assume that PTF performance based on van Genuchten equation using perlite particle distribution and measured BD can be applicable to figure out θv for different sizes of the perlite because the PTF performance increases when RMSE values approaches zero (Pachepsky and Rawls, 2004). As regards the values of R2 as the predictive capacity of the PTFs, the trend can be divided into tow categories depending on particle distribution. R2 of for all sizes of the perlite particle were greater than 0.88. From this, The median can suitable to predict θv in soils of RTFS because the measured data points do not vary around the estimated regression line.
Table 5
Experimentally measured moisture water content at the values of the water potential ranging from 0 to -1,500 kPa for five size levels of the perlite particle.
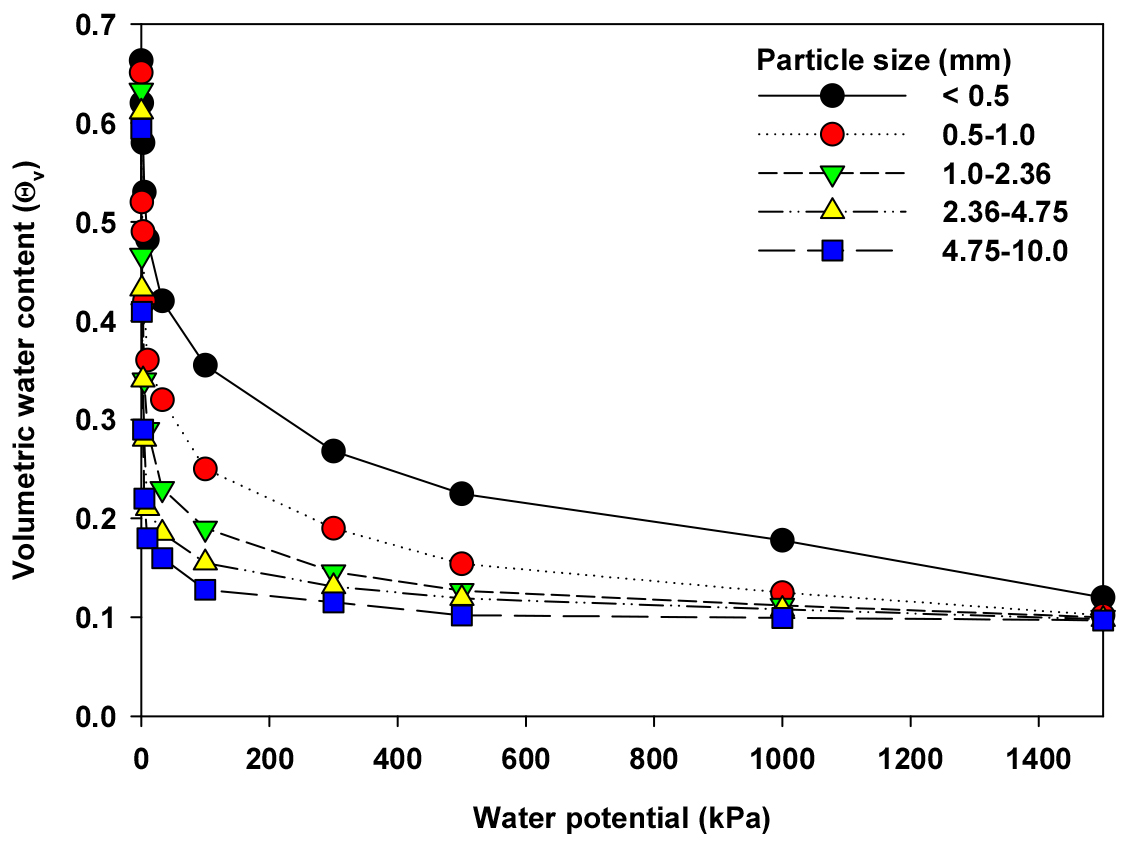
Fig. 4 show the water retention curves measured at the water potential ranging from 0 to -1,500 kPa for five levels of particle sizes of the expanded perlite. As seen in Fig. 3, the saturated θv for each particle size can be varies due to variable surface areas and indigenous internal pore volumes that can influence the water holding capacity depending on the different sizes of the perlite. For all sizes of the perlite particle, θv was decreased with the increasing matric potential and the decrease in θv corresponding to each matric potential was distinctive with increasing particle size, especially with the particle size greater than 2.36 mm in diameter while the θr regarded as residual water content that can considered as permanent wilting point was increased with decreasing particle size (Fig. 4a). Generally, soil starts to desaturate and the amount of water in soil decreases significantly with increasing suction in the transition stage when the metric suction is larger than the air-entry value as the point at the largest pores which air starts to displace water in a porous medium. Also, the AWC that can be calculated by difference of θv between FC and PWP also rapidly decreased with increasing particle size, especially by water retained in internal pores of the perlite. Fig. 4b shows θv plotted as log scale matric potential to observe the air-entry value. As seen in Fig. 4b, perlite became rapidly desaturated with increasing particle size of the perlite, indicating that the air-entry value can be observed at increased matric potential that should be calculated by the method suggested by Konyai et al. (2009). For these results, we can assume that water content retained by the different sizes of the perlite could be attributed by pore volume that could be changed by external and internal pores depending on size and surface area in the perlite particle.
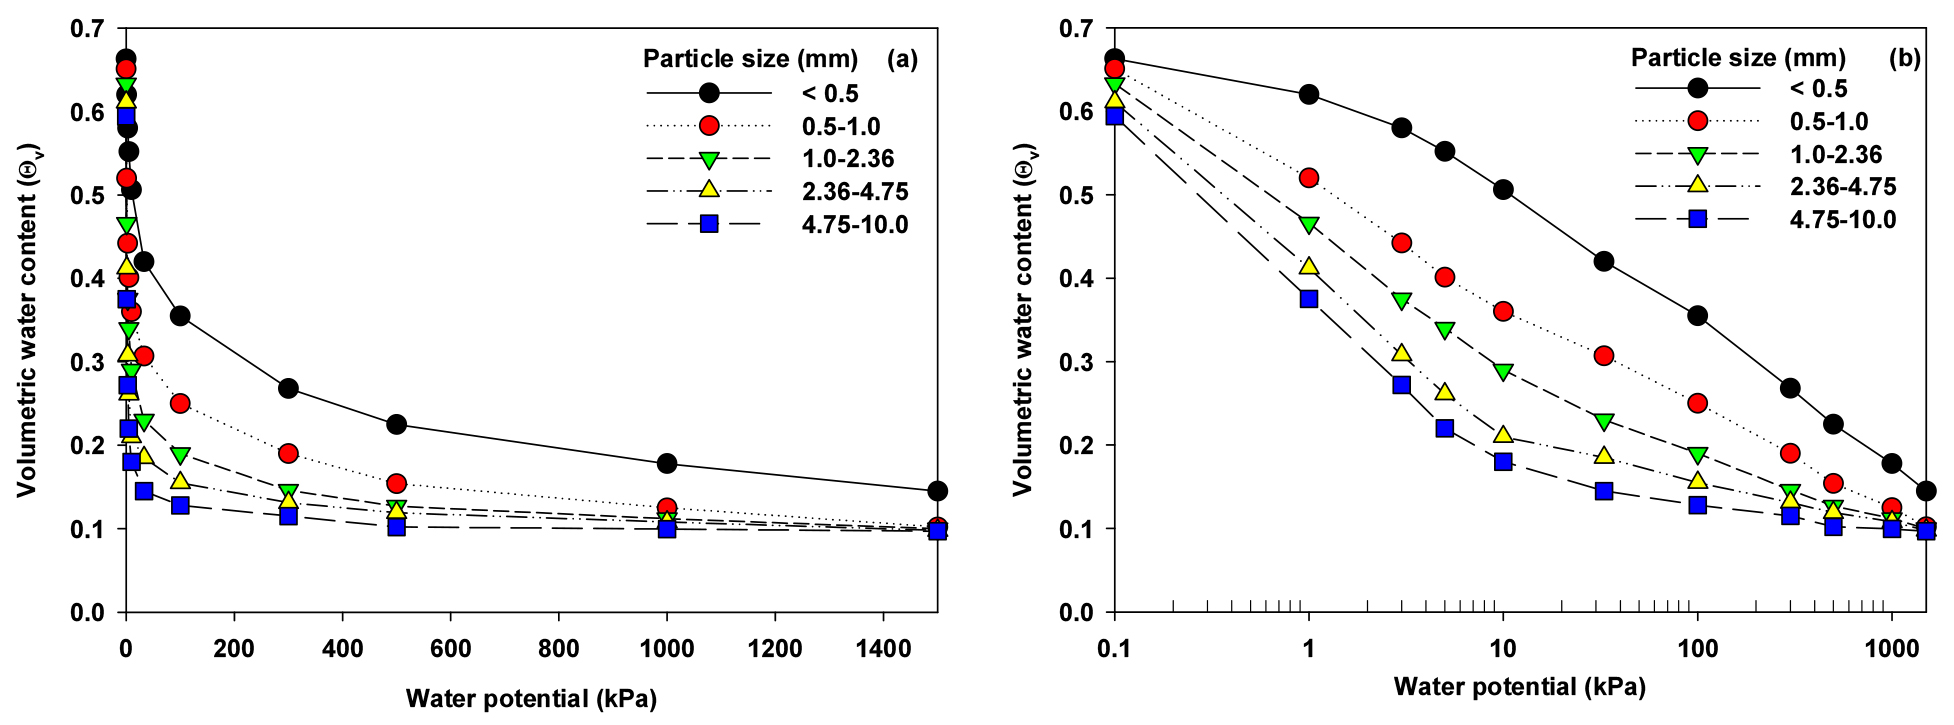
Table 6
The estimated van Genuchten model parameters of residual and saturated volumetric water contents, θr and θs, respectively, and shape parameters α and n estimated by the RETC for selected particle size and BD of the perlite.
The estimated vG model parameters θs, θr, α, n and m were calculated directly by fitting the vG model to the measured data using the RETC (RETention Curve) program (van Genuchten et al., 1991), given the condition that m = 1 - 1/n in Table 6. The estimated values of θr calculated by van Genuchten equation was slightly lower than those of experimentally measured θr for all particle sizes, From these results, vG equation is suitable to estimate the water content of particle size of perlite although it was slightly higher with increasing particle size of the perlite that can be estimated by RTFS. For this, there are various reasons for the scatter between measured and estimated of θr due to fewer measured data points, particularly in the range where the moisture content is most sensitive to variations of matric potential, as well as there are methodological problems in deriving the water retention curve using pressure chambers (Moraes et al., 1993). However, vG model parameters using the RETC need to be modified to predict the water content close to actual water content. A comparison of the estimated mean m values showed that m values of all particle sizes were ranged from 0.296 to 0.378, indicating that m value corresponding to the particle size of perlite was slightly higher than those of the perlite with smaller particle sizes (Table 6).
Conclusions
The expanded perlite particles that have internal pore in its particle can not hold enough water on the particle surface due to lack of surface charge, resulting in very low in plant available water although θr. was relatively high. The measured mean θv was not only drastically changes with perlite particle distribution, regardless of particle size but also the estimated θv was slightly lower than those of perlite particles measured at each water potential. The results of RMSE and MBE showed that the measured and estimated θv were closely correlated to figure out θv of all levels of perlite particle of RTFS. The estimated θv versus the measured ones were highly correlated with R2 (<0.907) while θs was θr of the estimated were much lower than those of mean θs and θr. PTF performance based on van Genuchten equation using data set including perlite particle size and their BDs can be applicable to estimate water content in perlite particle. However, further studies are recommended to verify air-entry-value to calculate accurate AWC depending on the particle sizes and the proportion of external and internal pore that can influence hydraulic conductivity and water retention as growth media for horticultural vegetables.
