

Introduction
Materials and Methods
Site description and soil sample
Heavy metal analysis
Soil pollution index (PI) and pollution load index (PLI)
Statistical analysis
Results and Discussion
Assessment of heavy metals in soil
Contamination index of heavy metals in soil
Conclusions
Introduction
Soil quality is a top priority for producing safe agricultural products (Kong, 2014) and the importance of soil for this purpose cannot be exaggerated. Economic expansion for the industrial sector close to agricultural farmland may deteriorate the soil (Jung et al., 2005; Lee et al., 2010). Therefore, monitoring the agricultural soil quality can provide a critical information for consumers and policy makers to support for better quality of food, health, and environment (Kloke, 1979; Sutherland, 1999; Wu et al., 2010; Ahmadi et al., 2017).
Industry expansion is another concern to exert a negative influence on the environment, that resulting in the high possibility soil, air, surface water and groundwater contamination (Lambert et al., 2000; Wang et al., 2010; Morais et al., 2012). Agricultural farmlands neighboring industrial sites can be polluted with both directly industry-related sources and other practices as well. For example, they are industrial effluents, sewage discharge, dust, and industrial wastewater. They may contain heavy metals flowing into agricultural fields from industrial complexes (Jung et al., 2005; Lee et al., 2010). Especially, heavy metals from industry near farmland are the most hazardous contaminants of agricultural soils where agricultural products grow. The human health is depending on quality of agricultural product from well managed farmland (Järup, 2003; Akoto et al., 2008).
Heavy metals are one of environmental pollutants from industrial activities. Accumulation of heavy metals in the agricultural soil can negatively influence on crops and easily transferred into food chains (Järup, 2003; Duruibe et al., 2007; Jolly et al., 2013). Toxicity of heavy metals and its residues in plants enter the human body when consumed or direct contact of soil by skin (Johansson and Campbell, 1998). Consequently, food containing heavy metals have detrimental effects on human organs such as the heart, liver, kidney for a short or long period time (Holmgren et al., 1993; Vulava et al., 1997). The most hazardous elements, such as arsenic (As) can result in serious health disorders such as epigenetics, inflammatory and neoplastic changes in skin and cancer along with their respective system (Järup, 2003; Duruibe et al., 2007; Karaca et al., 2010; Jolly et al., 2013; Mohammed Abdul et al., 2015; Prakash and Verma, 2021). Many researchers found heavy metals in soils, such as cadmium (Cd), chromium (Cr), copper (Cu), lead (Pb), nickel (Ni), and zinc (Zn) (Jung et al., 2005; Lee et al., 2010; Min et al., 2016). In South Korea, Contamination Warning Standard (SCWS) for cultivated lands (Region 1) are 25, 4, 150, 100, 200, and 300 mg kg-1 for As, Cd, Cu, Ni, Pb, and Zn, respectively.
The aim of this study was to investigate heavy metal concentrations in agricultural soils adjacent to industrial complexes in Jeon-Buk province, Korea. This study will help us understand how dense heavy metals are accumulated in soils near industrial complexes in Jeon-Buk province. Also, this research can give us some crucial information on food and soil safety issues based on heavy metal levels which is regulated by Soil Environment Conservation Law (SECL).
Materials and Methods
Site description and soil sample
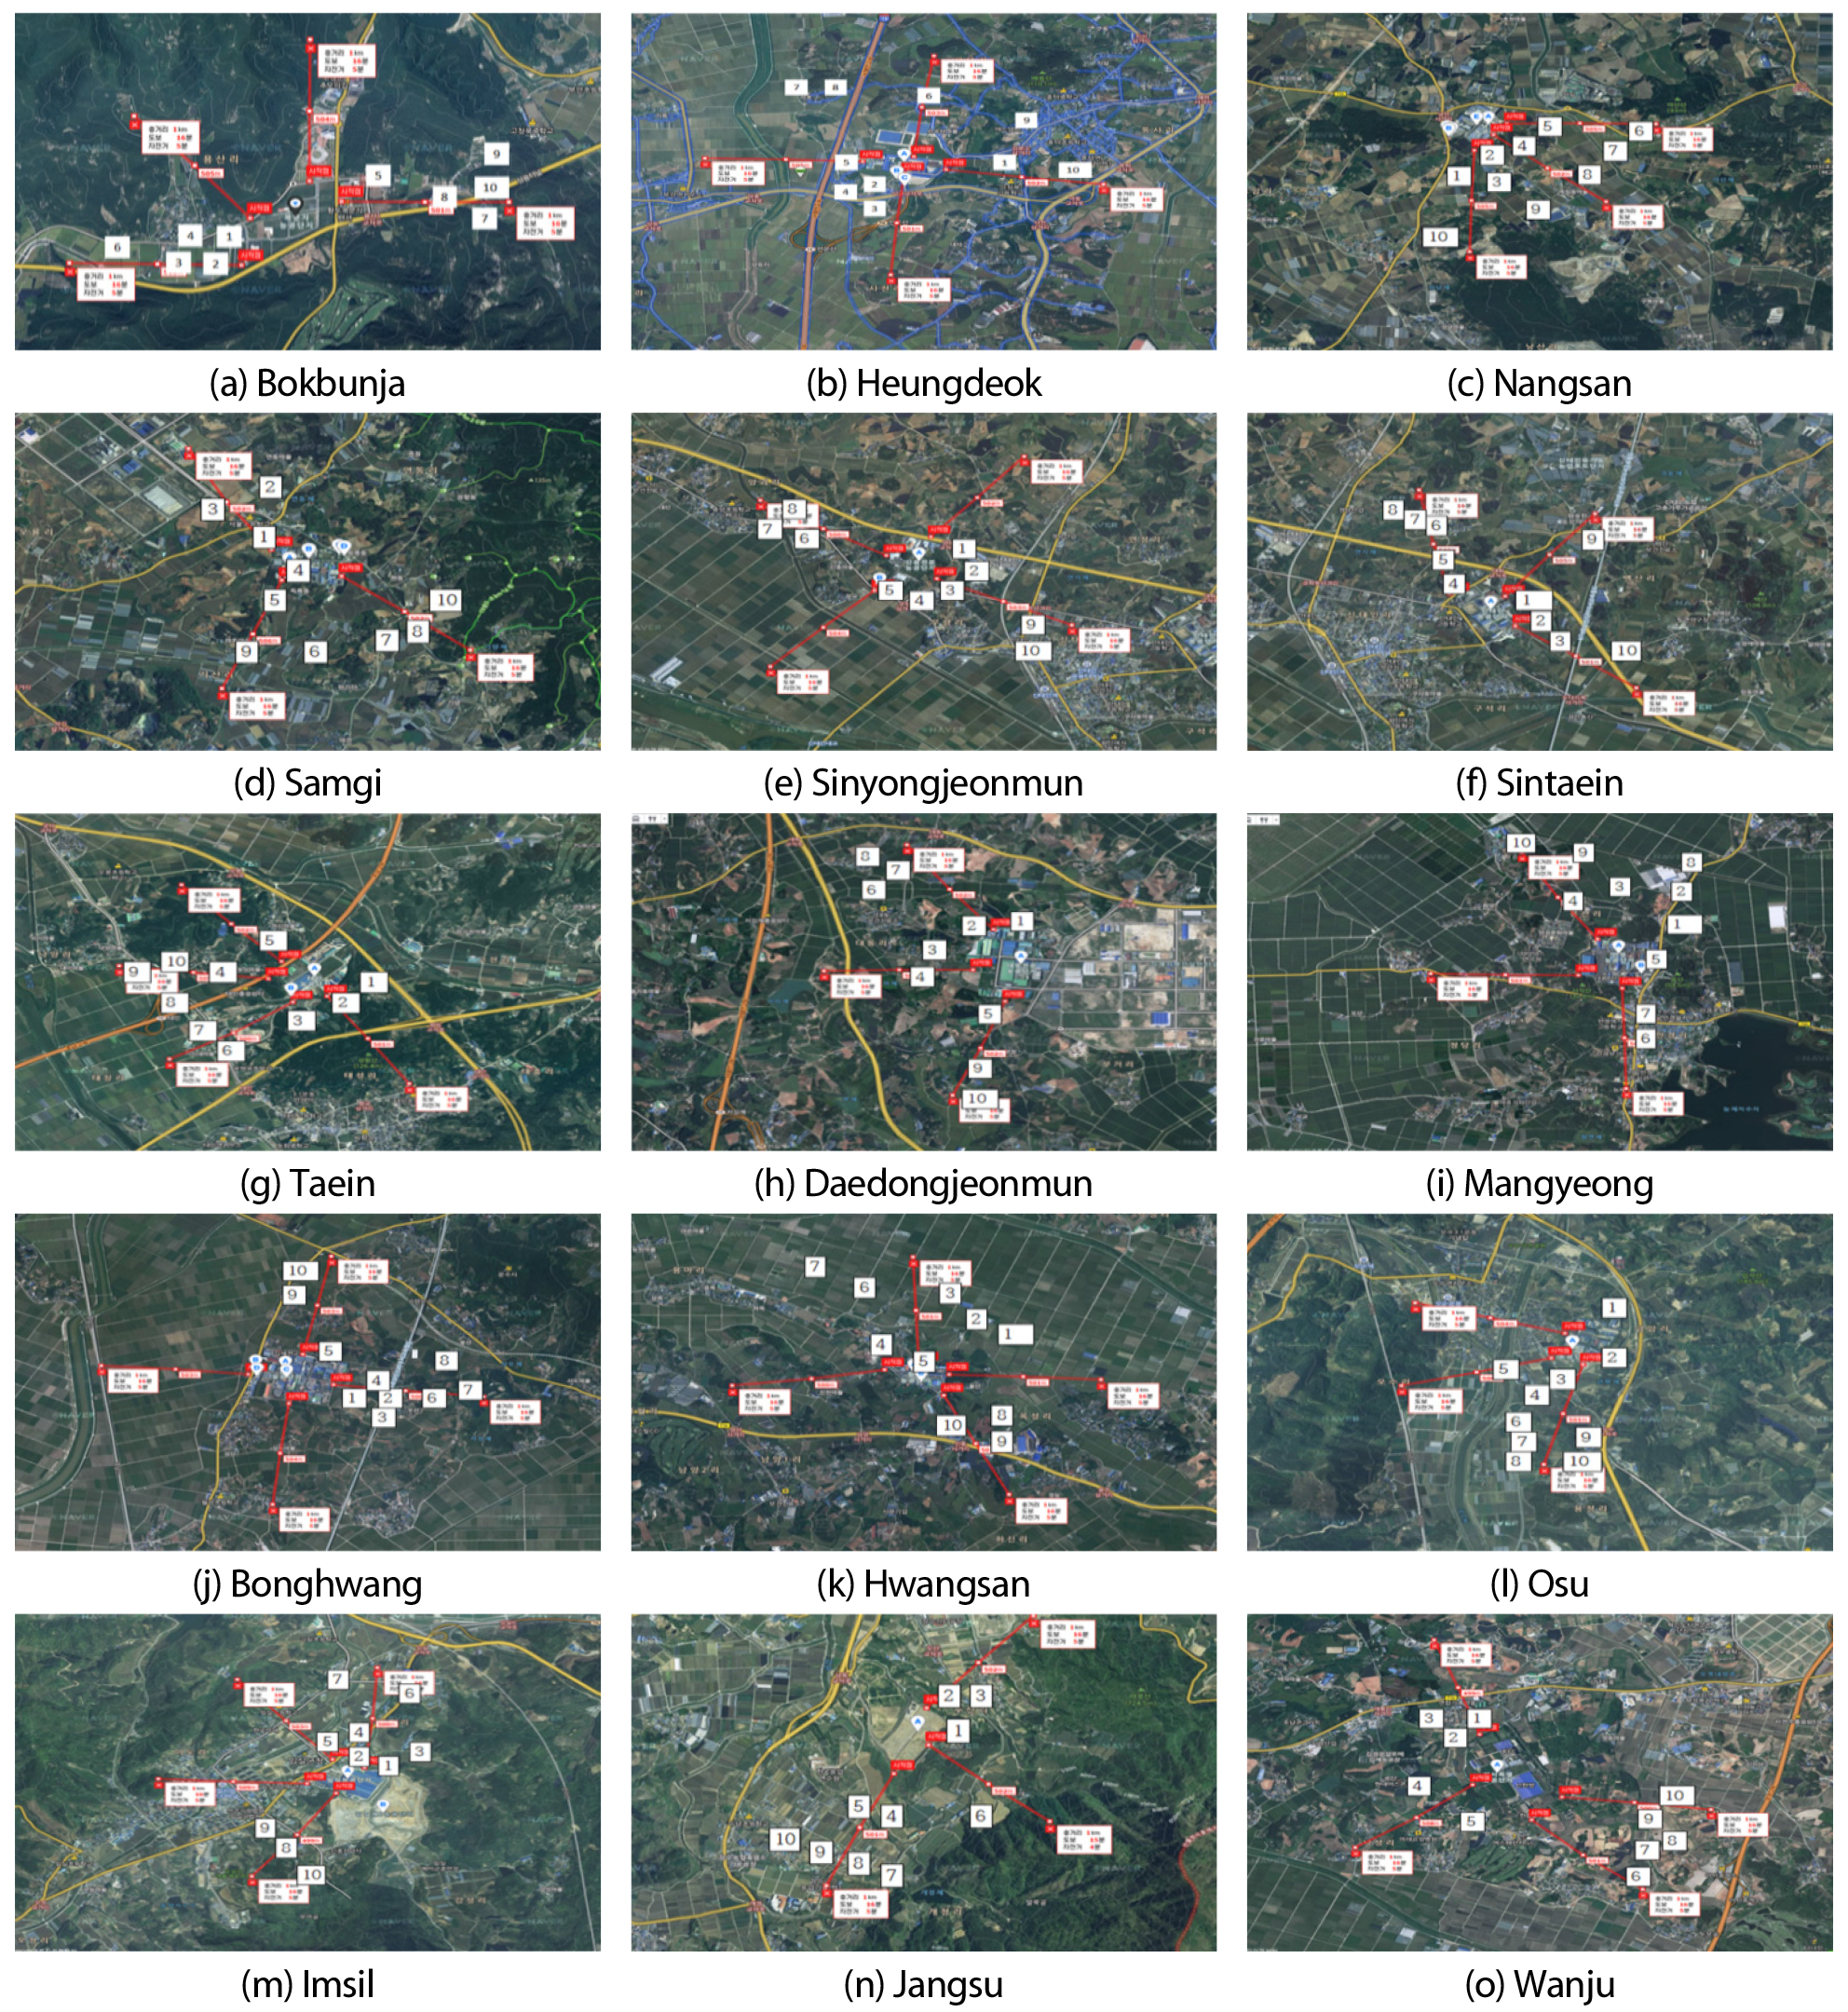
This study was conducted in 2019 in Jeon-Buk Province. Soil samples were collected at agricultural fields near 15 industrial complexes in 7 counties (Gochang, Iksan, Jeongeup, Gimje, Imsil, Jangsu, and Wanju) (Table 1, Fig. 1). Ten agricultural fields near each industrial complex were randomly selected, with four directions (east, west, south, and north). Two depth soils (0 - 15 and 15 - 30 cm) were collected within 0 - 500 meter and 500 - 1,000-meter radius from the borderline of each industrial complex. Five soil cores were collected using soil auger (Eijelkamp one-piece soil auger, Gempler’s, Giesbeek, Netherlands) and combined well in a plastic bag. Total three hundred soil samples were collected (150 for 0 - 15 cm depth and 150 soil samples for 15 - 30 cm depth). These collected soil samples were air-dried and sieved with a 2 mm sieve for heavy metal analysis (MOE, 2016).
Table 1
Monitored industrial complexes in Jeon-Buk province in 2019 in Korea.
Heavy metal analysis
Prepared dried soil samples were finely ground with Zirconia balls (DAIHAN, Korea) by mill machine at 10,000 rpm. For heavy metal analysis, three grams of finely ground soils were mixed with 21 mL of hydrochloric acid (HCI) and 7 mL of nitric acid (HNO3), then heated for 2 hours at 120°C using heating plate (Block Heating Sample Preparation System, US/MHB-250, Ctrl-M Science), releasing arsenic (As), cadmium (Cd), chromium (Cr), cupper (Cu), nickel (Ni), lead (Pb), mercury (Hg), and zinc (Zn) in soils (NIAST, 1998; MOE, 2016), the samples need to be digested in acid and heat, followed by its quantification by ICP-OES, (Optima 7300DV, Perkin Elmer, USA). Wet digested soil samples were filtered through filter paper No. 2 (Advantec No.2, 110 mm) and filled up to 100 mL. The standard solutions were prepared using ICP grade multi-element standard for Cd, Cr, Cu, Ni, Pb, and Zn (Inorganic ventures, USA) and single-element standard for As and Hg (Kriat Co.,Ltd., Korea). Individual heavy metal standard solutions were prepared. In detail, single-element standard As and Hg concentrations were 0.1, 0.5, 1, 5, 10, 20, 50 and 100 mg kg-1 and multi-element standard (Cd, Cr, Cu, Ni, Pb and Zn) were 0.1, 0.5, 1, 5, 10, 20, 50 and 100 mg kg-1. Calibration curve using a standard solution was obtained.
Soil pollution index (PI) and pollution load index (PLI)
The assessment of the soil contamination was carried out using several evaluating methods, pollution index (PI) and pollution load index (PLI). Hakanson (1980) used the pollution index (PI) to evaluate soil quality using the modified formula.
where, Cn is the concentration of the examined element in the soil, Bn is the geochemical background value. The background values were obtained from a study by Liao and Chao (2004). The selected reference background values are usually background concentration of heavy metals in earth’s crust. The background values for this study were averaged values from 2,070 paddy rice soil samples (Yun et al., 2018; Lee et al., 2019). The background values serve to assess contamination by comparing current and pre-industrial concentration of heavy metal concentrations (Suwanmanon and Kim, 2019) and the background concentration of As, Cd, Cu, Ni, Pb, and Zn used for this study were 3.68, 0.22, 14.9, 14.1, 16.7, and 56.8 mg kg-1 respectively. Yoon et al. (2009) reported that natural background levels of As, Cd, Cu, Ni, Pb, Cr, and Zn, from various geological units in Korea were 6.83, 0.287, 15.26, 17.68, 18.43, 25.36, and 54.27 mg kg-1, respectively, while Kwon et al. (2013) suggested that background Cr and Ni concentrations by soil parental materials in Korea were 36.4 mg kg-1 and Ni 19.8 mg kg-1.
The PI values are classified into 4 classification index (Table 2). The contamination level of heavy metals was assessed by pollution load index (PLI). The pollution load index was evaluated for the extent of the metal pollution. Where n is the number of metals studied, for in this paper is 7 elements and PI is the pollution index value from Eq. 1. The pollution load index (PLI) was calculated using the modified formula based on Angulo (1996) and Jorfi et al. (2017). The PLI values are classified into 4 classification index (Table 3).
If PLI is less than 1, the soil is classified into index 2, which is unpolluted.
Table 2
Classification of different soil contamination assessment of pollution index (PI).
| Classification index | PI value | Description of class |
| 1 | PI < 1 | Uncontaminated |
| 2 | 1 ≤ PI < 2 | Slightly polluted |
| 3 | 2 ≤ PI < 3 | Moderately polluted |
| 4 | 3 < PI | Highly polluted |
Table 3
Classification of different soil contamination assessment of pollution load index (PLI).
| Classification index | PLI | Description of class |
| 1 | PLI = 0 | Background concentration |
| 2 | 0 < PLI ≤ 1 | Unpolluted |
| 3 | 1 < PLI ≤ 2 | Moderately polluted |
| 4 | 2 < PLI | Highly polluted |
Statistical analysis
All experiments data are expressed as means and standard deviation. The 0.05 p-value was considered statistically significant using SPSS program (version 12.0, IBM, USA).
Results and Discussion
Assessment of heavy metals in soil
Descriptive statistics of heavy metal concentrations of agricultural soil samples near the industrial complexes in Jeon-Buk province in 2019 are summarized and listed in Table 4. The values were average, minimum (Min.), maximum (Max.), standard deviation (stdev), coefficients of variation (C.V (%)), kurtosis, and skewness with two soil depths (0 - 15 cm depth for top soil and 15 - 30 cm depth for subsoil. Overall, 8 heavy metals (As, Cd, Cr, Cu, Hg, Ni, Pb, and Zn, respectively) were analyzed in the soil samples that were regulated by Ministry of Environment (MOE).
Table 4
Descriptive statistics of heavy metal concentrations in agricultural soils near the industrial complexes in Jeon-Buk Province in Korea.
The percentile of these heavy metal concentration based on MOE for cultivated lands were less than 12, 22, 10, 0.3, 9.9, 6.2, 24.4% for As, Cd, Cu, Hg, Ni, Pb, and Zn, respectively. These heavy metal concentrations were below heavy metal warning levels for cultivated lands (Region 1) which were 25, 4, 150, 4, 100, 200, and 300 mg kg-1 for As, Cd, Cu, Hg, Ni, Pb, and Zn respectively.
The averaged heavy metal concentrations of top and sub agricultural soils for individual industrial complexes in Jeon-Buk province were shown in Table 5. The averaged heavy metal concentrations of top soil ranged from 1.3 to 4.8 for As, from 0.6 to 1.2 for Cd, from 6.3 to 22.1 for Cr, from 12.7 to 23.2 for Cu, from 0.0000 to 0.017 for Hg, from 3.8 to 15.2 for Ni, from 6.4 to 16.3 for Pb, and from 59.2 to 90.7 for Zn, respectively (Table 5). On the other hand, the averaged heavy metal concentrations of sub soil ranged from 1.3 to 4.9 for As, from 0.6 to 1.1 for Cd, from 6.1 to 22.2 for Cr, from 9.8 to 20.8 for Cu, from 0.0000 to 0.015 for Hg, from 3.7 to 13.3 for Ni, from 6.3 to 16.8 for Pb, and from 52.7 to 84.7 for Zn, respectively.
Table 5
Heavy metal concentrations for top and sub agricultural soils near the industrial complexes in Jeon-Buk Province in Korea.
The highest As, Cr, and Ni concentrations were shown in Gimje county. The heavy metal concentrations for top and sub soils were 4.2 and 4.0 mg kg-1 for As, 20.2 and 18.7 mg kg-1 for Cr, and 13.8 and 12.4 mg kg-1 for Ni, respectively. The highest Hg concentrations for top and sub soils were 0.015 and 0.012 mg kg-1 in Gochang county. The greatest Cd and Pb concentrations in Wanju county were 1.1 and 1.1 mg kg-1 for Cd and 13.6 and 14.1 mg kg-1 for Pb, respectively. The highest concentration of Cu and Zn were found in Jangsu county and their averaged heavy metal concentrations for top and sub soils were 23.2 and 20.8 mg kg-1 for Cu and 90.7 and 84.7 mg kg-1 for Pb, respectively. Although heavy metals were found in all soil sampling sites, all of the heavy metal concentrations were lower than Soil Contamination Warning Standard (SCWS) for cultivated lands, which is regulated by Soil Environment Conservation Law (SECL), Ministry of Environment (MOE) in Korea.
Contamination index of heavy metals in soil
To evaluate whether soil is polluted or contaminated by heavy metals or not, some indexes such as pollution index (PI) and pollution load index (PLI) are used to determine soil’s contamination by heavy metals. Pollution index (PI) and PLI for top and sub agricultural soils near the industrial complexes in Jeon-Buk province in Korea was listed in (Table 6). The averaged PI values of all seven heavy metals (As, Cd, Cr, Cu, Ni, Pb, and Zn) ranged from 0.1 to 0.4 for top and sub soils. The contamination level of heavy metal was classified into Group 1: PI < 1 (Uncontaminated) (Table 2) that identified soil is not polluted (Wu et al., 2014; Roudposhti et al., 2016; Jorfi et al., 2017; Kim et al., 2018). The highest PI values were 0.4 and 0.4 for top and sub for Cd at Hwangsan and Wanju agricultural industrial complexes. These results suggested that monitored agriculture soils near industrial complexes in Jeon-Buk province were not contaminated by heavy metals. Kim et al. (2016) reported that PI ranged from 0.3 to 0.5 for top and sub soil.
The PLI values using 7 heavy metals at each county ranged from 0.10 to 0.24 for top and sub soils (Table 6) and they were categorized into Group 2: 0 < PLI ≤ 1 which is unpolluted (Table 3) (Jorfi et al., 2017). The highest PLI values were 0.24 for top soil at Daedongjeonmun and Hwangsan and 0.21 for sub soil at Wanju. These results suggested that agriculture soils near industrial complexes in Jeon-Buk province were unpolluted by heavy metals and safe for agricultural activities.
Table 6
Pollution index (PI) and pollution load index (PLI) for top and sub agricultural soils near the industrial complexes in Jeon-Buk Province in Korea.
Conclusions
Heavy metals in soil samples near industrial complexes in Jeon-Buk province were found. However, all heavy metal concentrations were below the SCWS. Soil pollution indicators, such as PI and PLI were evaluated and showed that monitored sites near industrial complexes in Jeon-Buk province are unpolluted. The averaged PI values of all seven heavy metals (As, Cd, Cr, Cu, Ni, Pb, and Zn) ranged from 0.1 to 0.4 for top and sub soils, indicating these soils are not polluted. The PLI values using 7 heavy metals at each county ranged from 0.10 to 0.24 for top and sub soils and they were categorized into Group 2: 0 < PLI ≤ 1 which is unpolluted. These results suggested that monitored agriculture soils near industrial complexes in Jeon-Buk province in 2019 were unpolluted by heavy metals and safe for agriculture activities. Further research is needed to monitor and evaluate soil contaminations based on heavy metal concentrations.
