Introduction
Biochar is a promising soil amendment to improve the physicochemical properties of soils because of its high surface area and abundant functional groups besides its carbon sequestration potential (Han et al., 2023, 2024; Novair et al., 2023). It has also been reported that biochar application decreases greenhouse gas (GHG) emissions; methane (CH4) from paddy (Pia et al., 2024) and nitrous oxide (N2O) from upland soils (Lee et al., 2021). However, the strategy of biochar utilization should be different depending on the purpose of biochar application. For polluted or abandoned soils, high applications of biochar to soils may be a good strategy for pollution control and climate change mitigation because of the immobilization of pollutants and C sequestration by biochar (Yun et al., 2023). For arable lands, however, a high application of biochar may not be recommended because of the potential for soil and food contamination by toxic compounds contained in the biochar as well as the increased cost of biochar application (Wang et al., 2019b). For example, biochar contains a substantial concentration of zinc (>1,000 mg kg-1), copper (>780 mg k-1), and polycyclic aromatic hydrocarbons (PAHs, >60 mg kg-1), depending on feedstock type and pyrolysis temperature (Quilliam et al., 2013; Zhao et al., 2018).
Because of the potential mitigation of GHG by biochar, several studies have reported that biochar can reduce GHG while maintaining crop yield for paddy (Nan et al., 2021; Novair et al., 2023) and upland (Cayuela et al., 2014; Borchard et al., 2019). Despite that, some review studies that synthesized data on the changes in the GHG emission biochar have revealed that increased biochar application does not enhance the mitigation of CH4 from paddy (Pia et al., 2024) and N2O from upland (Lee et al., 2021). In this study, to address the potential risks of high application of biochar, we re-investigated the overall pattern of the changes in CH4 and N2O mitigation by biochar with the biochar application rate using the data from Pia et al. (2024) for paddy (CH4) and from Lee et al. (2021) for upland (N2O) to address the potential risk of a high application of biochar.
Materials and Methods
Data were collected from Pia et al. (2024) for CH4 emission from paddy fields (n = 107) and from Lee et al. (2021) for N2O from upland fields (n = 174). In this study, for the paired comparison of the pattern of CH4 and N2O emission, area-scaled GHG emission was investigated as the majority of studies investigated N2O mitigation by biochar did not report yield data. The data sources are available from the literature (Lee et al., 2021; Pia et al., 2024). The feedstock of biochar was divergent including wood, crop (rice, wheat, barley, and maize) residue and livestock manure, and the pyrolysis temperature ranged from 350 to >600°C for both paddy and upland fields (Lee et al., 2021; Pia et al., 2024). Biochar application rates were 2 - 48 t ha-1 for paddy (Pia et al., 2024) and 0.5 - 61.1 t ha-1 (Lee et al., 2021).
The percentage of reduction in CH4 and N2O by biochar application, Rindex, was calculated as the difference between the control without biochar and the biochar treatments (Eq. 1). In addition, the Unit Rindex, Rindex of the unit application rate of biochar (1 t ha-1), was also computed to explore the response of the Unit Rindex to increasing biochar application rate (Eq. 2).
where Rbiochar and Rcontrol are emissions of CH4 and N2O in biochar-treated soils and control, respectively.
The patterns of the Unit Rindex with biochar application rate were assessed with a regression analysis using the data set showing decreased GHG by biochar application to investigate the performance of unit weight of biochar on GHG mitigation.
Results and Discussion
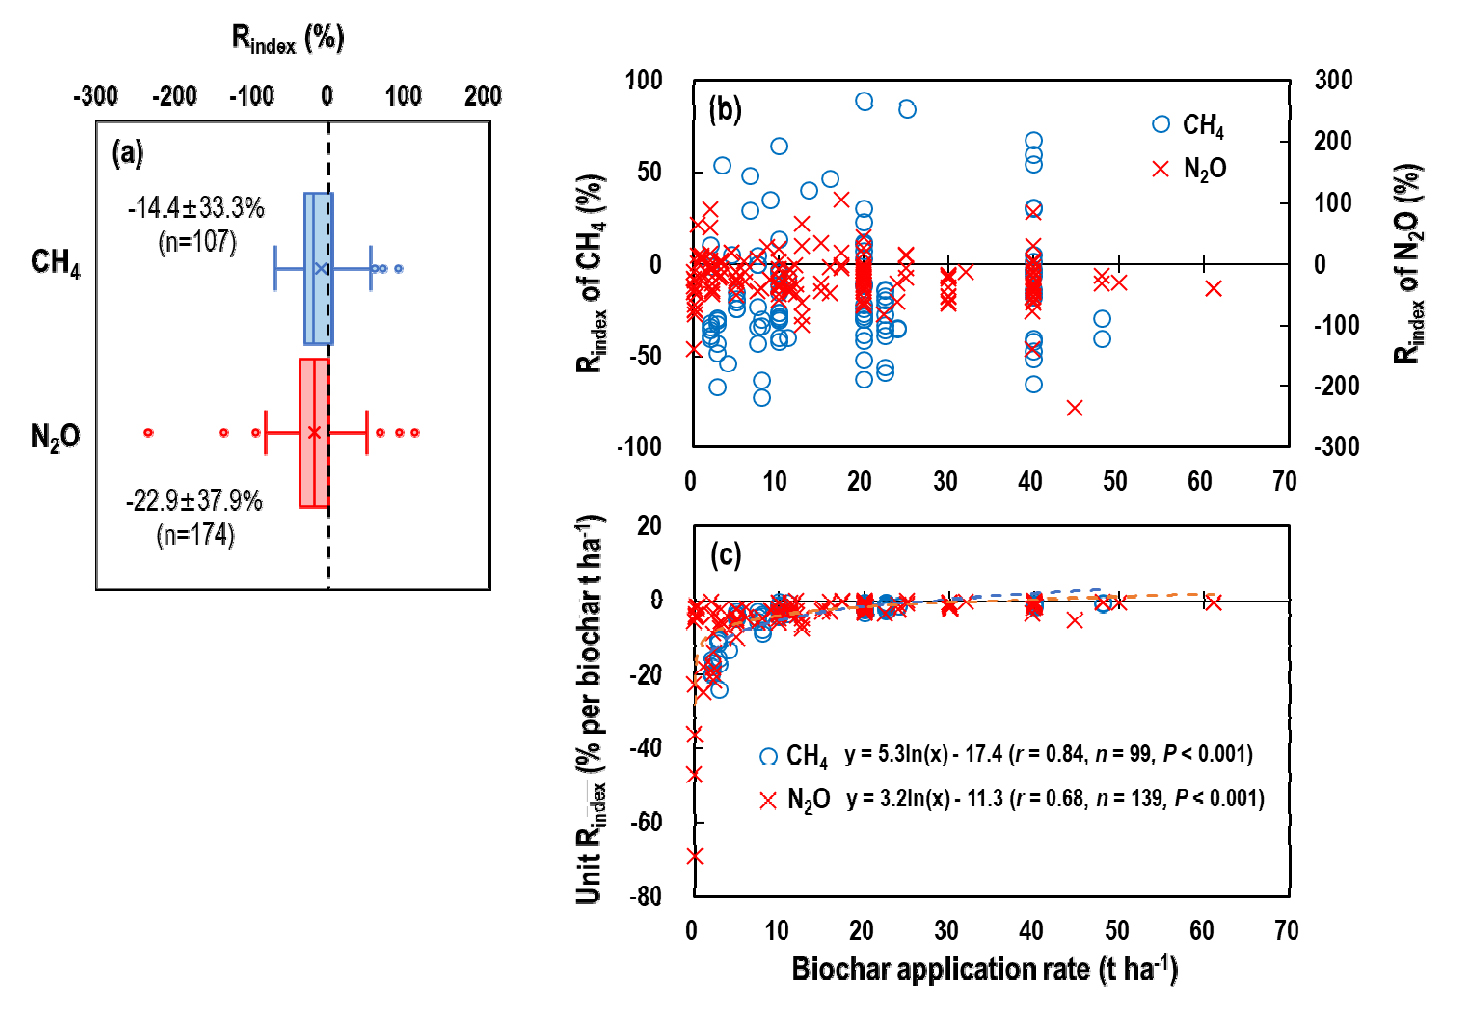
Biochar applications decreased CH4 emissions by 14.4% (range of Rindex: -72.9 to 88.9%) and N2O emissions by 22.9% (-235.0 to 105.6%) on average across the biochar application rates (Fig. 1a). Biochar may reduce CH4 emission by increasing ratio of methanotrophs to methanogens through increased soil pH (Wang et al., 2019a), improved soil aeration (Dong et al., 2013), and decreased organic substrate availability by sorption on to biochar surface (Han et al., 2016). Biochar may also directly reduce CH4 emission via the electron-accepting ability of biochar (Zhang et al., 2019a, 2019b) and the entrapment of CH4 in the micro-pores of the biochar (Sadasivam and Reddy, 2015). The potential mechanisms of N2O reduction by biochar are suggested as complete reduction of NO3- to N2 instead of N2O under increased soil pH (Lee et al., 2021), decreased substrate availability (NH4+ for nitrification and NO3- for denitrification) for N2O production via physicochemical sorption and microbial immobilization of mineral N (Cayuela et al., 2014), and inhibition of microbial processes to produce N2O caused by microbiologically toxic compounds contained in biochar (Spokas et al., 2010). Despite the overall effects of biochar on reducing GHG emissions, the Rindex of GHG was not proportional to the biochar application rates (Fig. 1b), suggesting that a high application rate of biochar does not enhance GHG mitigation. Among the data set, increased GHG emissions by biochar were also observed (Fig. 1b), suggesting that the effects of biochar on GHG emissions are variable being affected by biochar type (feedstock and pyrolysis temperature), soil properties, and agricultural practices including fertilization as summarized by our previous studies (Lee et al., 2021; Pia et al., 2024).
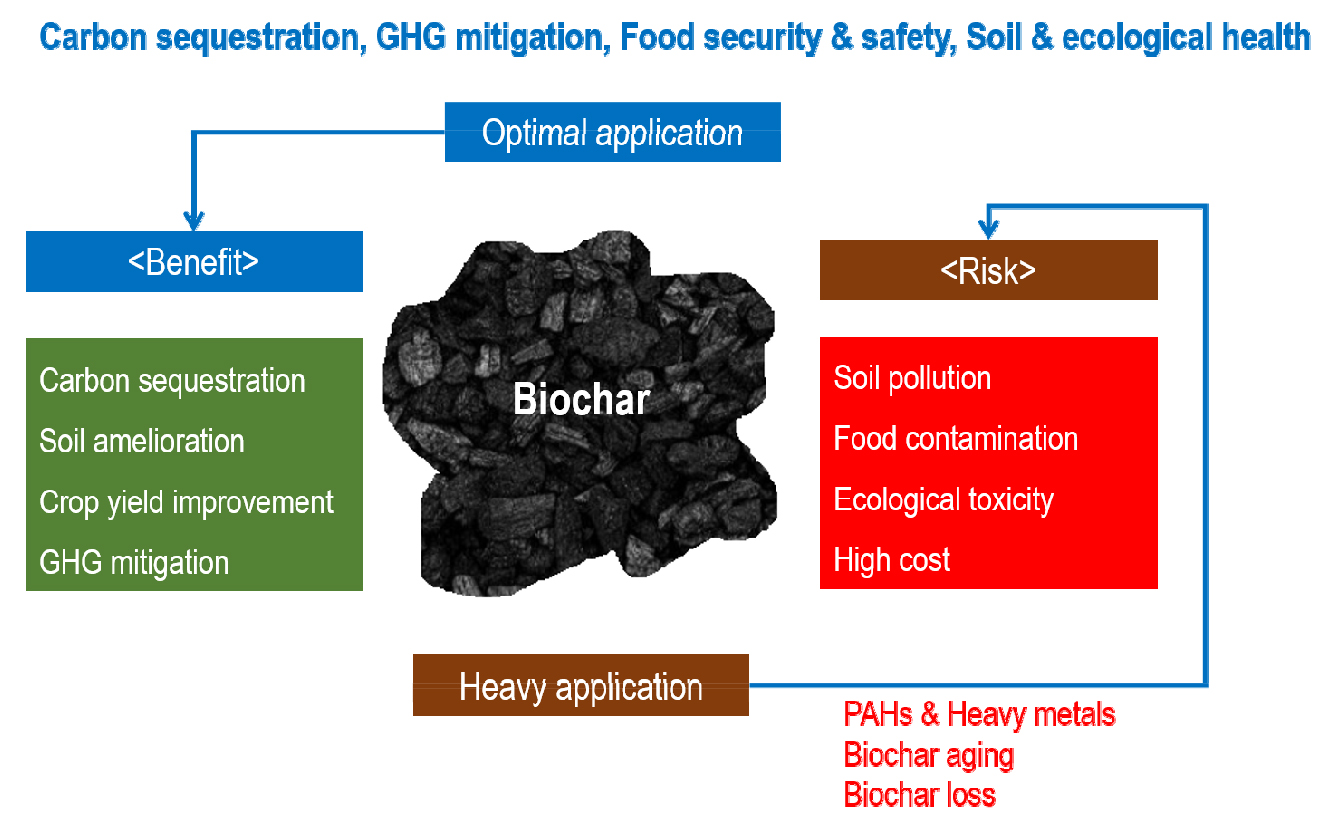
The regression analysis for the effects of biochar application on the Unit Rindex indicated that the performance of unit weight of biochar on GHG mitigation decreases (range: -24.0 to -0.1% for CH4 and -69.0 to -0.1%) with the increased biochar application rate for both CH4 and N2O (Fig. 1c). As the Unit Rindex is a measure of the GHG mitigating performance of biochar applied at 1 t ha-1, the decreased Unit Rindex with increased biochar application rates indicates that the biochar’s performance decreases at a higher biochar application rate. The decreased Unit Rindex with increased biochar application rate could be attributed to decreased capacity of unit-weight biochar to reduce GHG under high biochar availability, diminished biochar’s ability to reduce GHG with aging, and loss of biochar through runoff after heavy application as summarized by Pia et al. (2024) (Fig. 2).

Fig. 1.
Biochar effects on CH4 and N2O emission: (a) CH4 and N2O mitigation by biochar application across biochar application rates, (b) pattern of the Rindex of CH4 and N2O by biochar with increased biochar application rate, and (c) pattern of the Unit Rindex of CH4 and N2O by biochar with increased biochar application rate for data set showing decreased CH4 and N2O by biochar application.
The decreased biochar’s performance on GHG mitigation with increased biochar application should cause cost problems in biochar utilization (Campion et al., 2023). For example, the price of commercial biochar (10 kg) is 11,000 - 25,000 KRW depending on the biochar quality. Therefore, when 1 t biochar is applied to 1 ha field, it costs 1,100,000 - 2,500,000 KRW; whereas biochar C (assuming C content of biochar is 50%) buried in the soil is estimated to be 1.8 t CO2, which has a value of 18,000 KRW (assuming 10,000 KRW for 1 t CO2) in Korean Emissions Trading System (ETS), indicating that the biochar price is more than 60 times expensive than that of C credit. Although soil C sequestration by biochar application was not evaluated in the present study, this estimation suggests that if biochar does not additionally mitigate GHGs, the economic feasibility of biochar in ETS may further worsen.
Due to this reason, an annual application of biochar at a low rate is suggested to be an economical way of biochar utilization (Nan et al., 2020; Lee et al., 2023). Besides, loss of biochar and contamination of soil and food by PAHs and heavy metals contained in biochar are other concerns on heavy application of biochar (Fig. 2) (Quilliam et al., 2013; Chen et al., 2018; Bai et al., 2022). Our data analysis cautions against heavy application of biochar due to the potential risks such as soil and food contamination and ecological toxicity associated with the biochar losses from agricultural fields to water bodies. Therefore, it is necessary to find a feasible rate of biochar application to achieve GHG mitigation, food security and safety, and soil and ecological health by taking into both the agronomic performance and cost-effectiveness of biochar.

Fig. 2.
The potential benefit of optimal application of biochar and potential risk of heavy application of biochar. Annual application of biochar at optimal rates may enhance soil carbon sequestration and improve soil quality, leading to yield increases and greenhouse gas (GHG) mitigation. Heavy application of biochar may cause soil and food contamination due to polycyclic aromatic hydrocarbon (PAHs) and heavy metals contained in biochar. The benefit of biochar may diminish through the weathering of biochar, and the loss of biochar to the water system may cause ecological toxicity. These biochar weathering and loss may also increase biochar costs.
Conclusions
Biochar is a promising soil amendment for GHG mitigation and carbon sequestration for both paddy and upland fields. However, our data synthesis shows that the magnitude of GHG mitigation is not proportional to the biochar application rate due to the diminished capacity of unit-weight biochar to mitigate GHG with increased biochar application rate for both CH4 and N2O. It was further indicated that heavy application of biochar may cause cost problems as well as unintended risks such as soil and food contamination and ecological toxicity due to toxic compounds such as heavy metals and PAHs contained in the biochar. Therefore, an optimal rate of biochar application needs to be established for farmers’ use of biochar. The optimal rate should be set by considering not only GHG mitigation but also food security and safety as well as soil and ecological health.


