


Introduction
Materials and Methods
Soil samples, biochar preparation, and their analysis
Experimental design and incubation
Data calculation
Statistical analysis
Results and Discussion
Soil NH4+-N and NO3‒-N dynamics during incubation
Fixed-interval estimates of net NH4+-N disappearance and net NO3‒-N production
First-order kinetics of apparent net inorganic N accumulation under urea fertilization
Conclusions
Introduction
Biochar, a carbon-rich material produced by pyrolysis of organic biomass, has been widely used as an effective soil amendment to improve soil fertility (Dai et al., 2021; He et al., 2024), slow nutrient availability, and enhance nitrogen (N) retention (Shan and Coleman, 2020; Zhao et al., 2023). It can influence the transformation of fertilizer N in soil, including mineralization, immobilization, nitrification, and denitrification, and crop N uptake (Zhang et al., 2022). However, depending on soil type, climate, and environmental conditions, biochar’s effects on crop yields are not always consistent (Khaledi et al., 2023). Moreover, biochar effects on soil N dynamics, including N mineralization, can vary greatly depending on biochar type, pyrolysis conditions, application rate, soil type, and incubation period (Feng et al., 2024). Therefore, understanding the specific properties of biochar and optimal application rates is essential for predicting its effects on N cycling.
Among nutrients, N is one of the essential major nutrients required for plant growth, and it is widely utilized in agricultural systems due to its cost-effectiveness and critical role in supporting food production for an increasing global population (Tei et al., 2020). In Jeju Island, the average N application rate in vegetable crop production exceeds 480 kg N ha-1, and approximately 80% of applied N remains as surplus in the soil-plant system (Koh et al., 2021). After urea application to soil, it is rapidly hydrolyzed to ammonium (NH4+-N), which may be adsorbed onto soil exchange sites, immobilized by microorganisms, nitrified to nitrate (NO3‒-N), or lost because NO3‒-N is highly mobile in soil. Inefficient N management often results in low nutrient use efficiency due to nutrient losses and increased environmental risks through ammonia volatilization, NO3‒-N leaching, and gaseous emissions (Davys et al., 2023; Motasim et al., 2024; Shin et al., 2025). Therefore, one of the soil amendments, biochar, has become a key concern for improving synchronization between fertilizer N release and soil N retention because it alters nutrient dynamics in soils by affecting N cycling and offers potential options for minimizing N losses via ion exchange, absorption, and immobilization, as well as enhancing nutrient supply (Clough et al., 2013).
On the other hand, only biochar application (depending on feedstocks) did not sufficiently provide the nutrient requirements for plant growth, whereas significant yield improvements were observed when biochar was combined with inorganic chemical fertilizers (Baiga and Rajashekhar Rao, 2017; Bai et al., 2022). Moreover, some recent studies have proposed that losses of N can be reduced by adapting an alternative method of combining nitrogenous fertilizer with pyrolyzed biomass, biochar (Dey and Mavi, 2021). In particular, biochar–urea co-application may be useful because urea supplies readily available N; in contrast, biochar may help retain that N.
In addition, soil organic matter (SOM) plays a crucial role in N cycling and its availability in soils by functioning as a nutrient reservoir and enhancing microbial activity (Javeed et al., 2023). In Jeju Island, Andisols, volcanic ash soils exhibit a wide range of SOM contents depending on weathering, approximately 2% to over 17% (Park et al., 2019). Based on the above findings, understanding the specific roles of biochar properties and application rates in conjunction with urea in different soil types is critical to predicting their effects on N cycling. Moreover, the unique mineralogical properties of Andisols, including high allophane content and strong nutrient adsorption capacity, may alter the response of fertilizer N to biochar amendment.
Therefore, a laboratory incubation experiment was conducted using volcanic ash soils with low, medium, and high SOM levels to evaluate how biochar feedstock and application rate affect inorganic N availability, NH4+-N retention/disappearance, NO3‒-N production, and apparent net inorganic N accumulation under urea fertilization. The interactive effects of biochar feedstock, application rate, urea fertilization, and SOM level on inorganic N dynamics were examined throughout the incubation period. We hypothesized that inorganic N dynamics and responses to biochar would differ among the three soils varying in SOM content and associated physicochemical properties, and that biochar feedstock and application rate would influence net NH4+-N disappearance, NO3‒-N production, and apparent inorganic N accumulation under urea fertilization.
Materials and Methods
Soil samples, biochar preparation, and their analysis
Soil samples were randomly collected from the 0 - 10 cm depth of cultivated fields at three different locations on Jeju Island: Low SOM (LSOM, 12 g kg-1), Medium SOM (MSOM, 66 g kg-1), and High SOM (HSOM, 134 g kg-1) soils. Based on their andic properties and the Soil Taxonomy criterion of Alₒ + 0.5Feₒ ≥ 2%, the MSOM and HSOM soils were considered Andisols, whereas the LSOM soil was classified as a non-Andisol (Table 1). The collected soils were air-dried, crushed, and passed through a 2 mm sieve, and then stored in zip bags before analysis.
Table 1
Physicochemical properties of volcanic ash soils used in the incubation experiment.
|
Soil type1 |
pH (1:5) |
SOM2 (g kg-1) |
T-N (g kg-1) |
Available P2O5 (mg kg-1) |
Exch. cations (cmolc kg-1) |
CEC3 (cmolc kg-1) |
Ammonium Oxalate Extraction (%) |
Bulk density (Mg m-3) |
Porosity (%) |
Sand (%) |
Silt (%) |
Clay (%) | Texture | ||||
| K | Ca | Mg | Al | Fe | Si | ||||||||||||
| LSOM | 6.0 | 11.7 | 1.23 | 395 | 0.04 | 3.41 | 0.91 | 17.2 | 0.22 | 0.66 | 0.08 | 1.22 | 50.2 | 9.93 | 61.5 | 28.5 |
Silty clay loam |
| MSOM | 5.0 | 66.1 | 3.96 | 206 | 1.34 | 1.59 | 0.68 | 34.2 | 2.22 | 0.59 | 2.28 | 0.84 | 62.2 | 20.8 | 71.8 | 7.40 |
Silt loam |
| HSOM | 5.1 | 134 | 4.58 | 299 | 0.02 | 2.66 | 0.50 | 45.7 | 1.86 | 1.65 | 0.24 | 0.69 | 68.9 | 21.1 | 53.9 | 25.0 |
Silt loam |
The physicochemical properties of the soils were analyzed using the methods described in the Soil and Plant Analysis Manual (NIAST, 2000). Before the experiment, bulk density was determined by the core method using the oven-dry mass of undisturbed core samples (100 cm3). After removing organic matter, the sand, silt, and clay contents were measured by wet sieving (sand fractions) and pipette (silt and clay) methods. Soil pH and electrical conductivity (EC) were measured in a soil-water suspension (1:5, w/v) using a pH meter (Orion Star A211, Thermo Scientific, USA) and an EC meter (Orion Star A329, Thermo Scientific, USA). Total N (TN) was determined by the Kjeldahl method. SOM content was determined using the Walkley-Black method. Available phosphate (P2O5) was extracted using the Lancaster method and quantified using a UV/VIS spectrometer (Optizen POP, Klab, Korea). Exchangeable cations and cation exchange capacity (CEC) were determined using 1 M ammonium acetate (pH 7.0); exchangeable cations in the extract were quantified by ICP–OES (Agilent 5800 ICP-OES, Agilent Technologies, USA), whereas CEC was determined by Kjeldahl distillation. Oxalate-extractable Si (Siₒ), Al (Alₒ), and Fe (Feₒ) were extracted with 0.2 M ammonium oxalate (pH 3.0) for 12 h in the dark using a mechanical vacuum extractor and quantified by ICP–OES.
Biochars derived from satsuma mandarin prunings (branches and leaves; CB) and garlic stalks (GB) were produced in an electric muffle furnace (LEF-130S, Esstell, Korea) under anaerobic pyrolysis conditions at 500°C for 30 min, whereas chicken manure biochar (CMB) was obtained commercially from 4EN Inc. (Anseong-si, Korea). The elemental composition of the biochars (C, H, N, and S) was determined using a FlashSmart elemental analyzer (Thermo Fisher Scientific, Waltham, USA). Ash content was determined by dry ashing in a muffle furnace at 700°C for 2 h. Oxygen content (O) was calculated by difference [O% = 100 ‒ (C% + H% + N% + S% + ash%)]. Biochar pH and EC were also measured. Water-extractable NH4+-N and NO3‒-N in the biochars were sequentially extracted five times with deionized water at a biochar-to-water ratio of 1:10 (w/v) according to Luo et al. (2011). NH4+-N and NO3‒-N concentrations in the extracts were determined by the salicylate method at 667 nm and the vanadium method at 540 nm, respectively, using a UV/VIS spectrometer. The biochar properties are summarized in Table 2.
Table 2
Chemical properties of different biochars used in this study.
|
Biochar type1 |
pH (1:10) |
EC2 (dS m-1) | Ash | Elemental composition (%) | Water-extraction | O/C | H/C | |||||
| (%) | C | H | O | N | S |
NH4+-N (mg kg-1) |
NO3‒-N (mg kg-1) | molar ratio | molar ratio | |||
| CB | 10.8 | 1.09 | 10.4 | 69.1 | 4.01 | 14.6 | 1.33 | ND3 | 50.2 | 7.98 | 0.15 | 0.69 |
| GB | 9.76 | 4.79 | 18.2 | 56.6 | 3.31 | 20.5 | 1.34 | ND | 51.7 | ND | 0.27 | 0.70 |
| CMB | 9.27 | 7.83 | 52.9 | 38.6 | 2.10 | 2.50 | 3.91 | ND | 1219 | ND | 0.05 | 0.65 |
Experimental design and incubation
The incubation experiment was conducted using a completely randomized design within each of the three soils. Eleven treatments were established within each soil: an unamended control, urea alone, and nine biochar–urea co-application treatments consisting of three biochar types (CB, GB, and CMB) applied at three rates (0.2, 0.4, and 0.8%, w/w).
Urea was applied at 200 mg N kg-1 dry soil to all N-amended treatments. Based on the measured bulk densities and an incorporation depth of 0.1 m, this rate was equivalent to field application rates of 244, 168, and 140 kg N ha-1 for the LSOM, MSOM, and HSOM soils, respectively. Three replicate bottles per treatment were destructively sampled at each of seven sampling times (1, 3, 7, 15, 30, 60, and 90 d after urea application), resulting in a total of 693 incubation bottles (3 soils × 11 treatments × 3 replicates × 7 sampling times).
For the incubation experiment, 100 g of air-dried soil was placed in each 250 mL polypropylene bottle. Biochar was then added at 0.2, 0.4, or 0.8% (w/w), and the soil and biochar were thoroughly mixed. Soil water content was adjusted to 60% water-filled pore space (WFPS). The bottles were covered with lids fitted with paper to minimize evaporation and incubated at 25°C. A one-week pre-incubation was conducted to stabilize microbial activity following soil rewetting (Uddin et al., 2021).
After pre-incubation, urea dissolved in deionized water was applied to the respective N-amended treatments. Soil water content was then readjusted to 60% WFPS and maintained throughout the incubation period by periodic gravimetric adjustment. Bottle weights were monitored every 3 d, and evaporative water losses were compensated by adding distilled water. Soil NH4+-N, NO3‒-N, pH, EC, and moisture content were determined at each sampling time. Soil inorganic N (NH4+-N and NO3‒-N) was extracted with 2 M KCl and determined by Kjeldahl steam distillation and titration using MgO for NH4+-N and Devarda’s alloy for NO3‒-N. The inorganic N concentrations were expressed as mg N kg-1 on an oven-dry soil basis.
Data calculation
Net NH4+-N and net NO3‒-N concentrations were calculated by subtracting the corresponding unamended-control concentration from each N-amended treatment at the same sampling time. Net inorganic N was calculated as the sum of net NH4+-N and net NO3‒-N. Apparent first-order kinetic parameters were estimated by fitting temporal changes in net inorganic N to the following first-order model:
where Nacc is the apparent net inorganic N accumulation at time t (mg N kg-1 soil), N0 is the apparent net inorganic N accumulation potential (mg N kg-1 soil), k is the first-order rate constant for apparent net inorganic N accumulation (d-1), and t is incubation time (d). Because urea was applied to all N-amended treatments, N0 was interpreted as an apparent net inorganic N accumulation potential under urea fertilization rather than as the mineralization potential of native soil organic N alone.
Net NH4+-N disappearance and net NO3‒-N production rates were estimated from the linear regression slopes of the respective net concentrations over predefined fixed intervals (Lim et al., 2024). The intervals for NH4+-N were 7 - 15 d for LSOM, 15 - 30 d for MSOM, and 7 - 15 d for HSOM, whereas the interval for NO3‒-N was 3 - 30 d for all soils. NH4+-N disappearance rates were expressed as the absolute values of negative slopes, whereas NO3‒-N production rates were expressed as positive slopes.
Statistical analysis
All data were organized using Microsoft Excel 2016 and statistically analyzed using SPSS 18.0 software (SPSS Inc., Chicago, IL, USA). One-way analysis of variance (ANOVA) was used to assess differences in soil pH and EC among treatments within each soil at each incubation time. Apparent first-order kinetic parameters of net inorganic N accumulation were estimated by nonlinear regression using SigmaPlot 15.0 software (Grafiti LLC, Palo Alto, CA, USA).
Within each soil, differences in the temporal slopes of net NH4+-N and net NO3‒-N were evaluated using analysis of covariance (ANCOVA), with incubation time as a continuous covariate. The time × treatment interaction was evaluated using all N-amended treatments, whereas time × biochar type, time × biochar application rate, and time × biochar type × biochar application rate interactions were evaluated using only the biochar–urea co-application treatments. Pairwise comparisons among estimated slopes were performed with Tukey adjustment at P < 0.05. A pooled three-factor ANCOVA was additionally conducted for the biochar–urea co-application treatments, with incubation time as the continuous covariate and soil type, biochar type, and application rate as fixed factors, to evaluate soil-dependent interactions.
Results and Discussion
Soil NH4+-N and NO3‒-N dynamics during incubation
At the beginning of incubation, NH4+-N concentrations (Fig. 1a, c, and e) were higher than the NO3‒-N concentrations (Fig. 1b, d, and f) in LSOM, MSOM, and HSOM soils. In the urea-amended treatments, this early predominance of NH4+-N was consistent with rapid urea hydrolysis, while mineralization of native soil organic N may also have contributed to NH4+-N accumulation. The accumulated NH4+-N subsequently served as a substrate for nitrification, resulting in increased NO3‒-N concentrations during incubation.

Fig. 1
NH4+ -N and NO3‒ -N concentrations during incubation in LSOM (a, b), MSOM (c, d), and HSOM (e, f) soils under control, urea-only, and biochar–urea co-application treatments. CB, satsuma mandarin pruning branch biochar; GB, garlic stalk biochar; CMB, chicken manure biochar. Error bars indicate the standard deviation (SD) of three replicates.
In the unamended controls, the highest NH4+-N concentrations of dry soil were found in HSOM (56.34 mg N kg-1), followed by MSOM (48.71 mg N kg-1) and LSOM (16.99 mg N kg-1). These results are broadly consistent with the initial total N contents of the three soils (HSOM > MSOM > LSOM). The HSOM contained higher total N than other soils. Similarly, another study on Chilean volcanic soil showed peak NH4+-N concentrations of 60 mg N kg-1 in the first 7 days during incubation (Cardenas et al., 2013). Differences in SOM and associated soil properties can influence inorganic N dynamics (Clunes et al., 2025). Moreover, soil pH (Supplementary Table 1), a major factor affecting N transformations, may also influence the balance between microbial ammonium production and immobilization (Yokobe et al., 2020).
In the urea-only treatment, NH4+-N concentrations increased rapidly during the early incubation period. The highest NH4+-N concentrations were observed in LSOM (184.4 mg N kg-1) and HSOM (156.2 mg N kg-1) on day 7, whereas MSOM reached its maximum on day 15 (215.1 mg N kg-1). The subsequent decrease in NH4+-N and increase in NO3‒-N were consistent with the progressive conversion of NH4+-N to NO3‒-N through nitrification. NO3‒-N concentrations gradually increased and reached their maximum values on the final incubation day in all three soils, indicating continued nitrate accumulation under the aerobic incubation conditions. Differences in the timing of NH4+-N maxima between clay loam and silt loam soils have also been reported, suggesting that soil properties can influence the temporal dynamics of inorganic N transformation (Nagaraju et al., 2026).
In the biochar–urea co-application treatments, the magnitude and timing of the maximum NH4+-N concentrations differed among soils, biochar types, and application rates. In HSOM, the highest NH4+-N concentration was 241.1 mg N kg-1 under 0.2% CB on day 3 of incubation. In LSOM, the highest NH4+-N concentration was 198.03 mg N kg-1 under 0.2% CB, whereas in MSOM, the highest concentration was 283.4 mg N kg-1 under 0.4% CMB on day 7 of incubation. For NO3‒-N, the maximum concentration was observed under 0.2% GB, reaching 308.7 mg N kg-1 in LSOM on day 15 and 425.3 mg N kg-1 in MSOM on day 30, after which NO3‒-N concentrations decreased sharply. In HSOM, however, the highest NO3‒-N concentration (328.6 mg N kg-1) was observed under 0.4% CMB on day 90. The differences in NO3‒-N peak timing among the three soils indicate that inorganic N transformations responded differently to biochar type and application rate. These responses may reflect the combined effects of nitrification, microbial immobilization, and physicochemical retention of inorganic N rather than a single process. The distinctive physicochemical properties of soils derived from volcanic materials, including reactive mineral surfaces and differences in SOM, may influence inorganic N retention and transformation through interacting physical, chemical, and biological processes (Clunes et al., 2021). Strong inorganic N retention is characteristic of Andisols and may reduce the susceptibility of inorganic N to loss (Huygens et al., 2011). Therefore, the observed differences in inorganic N dynamics likely reflected the combined influences of soil properties, biochar type, application rate, and incubation time, consistent with previous studies showing that mineral N retention and transformation depend on both soil and amendment characteristics (Cardenas et al., 2013; Tsai and Chang, 2020). Soil EC has been associated with soil inorganic N concentrations, particularly NO3‒-N (Mirzakhaninafchi et al., 2022). Similarly, MSOM showed the highest NO3‒-N concentration and EC (Supplementary Table 2) among the three soils. A strong positive correlation between soil EC and NO3‒-N concentration (r = 0.96, P < 0.001) has also been reported (Kang et al., 2022).
In the present study, the responses of inorganic N concentrations to increasing biochar application rates differed between the plant-residue biochars and CMB. The distinct response of CMB was consistent with its much greater water-extractable inorganic N (Table 2) contribution (2.44–9.75 mg N kg-1 soil-equivalent) compared with CB and GB (0.10–0.47 mg N kg-1 soil-equivalent), which may have contributed to the early NH4+-N increases observed in CMB-amended treatments. Biochar application can influence N transformation pathways in volcanic ash soils because biochar can provide additional adsorption sites and possibly influence microbial activity, ultimately affecting the timing and availability of inorganic N. Biochar as a soil amendment caused immobilization of soil N and reduced N leaching from cropland without a negative effect on crop yield (Sun et al., 2024).
Fixed-interval estimates of net NH4+-N disappearance and net NO3‒-N production
Fixed-interval regression and within-soil ANCOVA revealed that the temporal patterns of inorganic N transformation differed among the three soils (Table 3). For net NH4+-N disappearance, significant time-related interactions involving treatment, biochar type, application rate, and biochar type × rate were observed depending on soil, whereas net NO3‒-N production showed fewer and more soil-specific responses. No significant time-related interactions were detected for net NO3‒-N production in LSOM. In contrast, the time × biochar rate interaction was significant in MSOM, whereas time × treatment, time × biochar type, and time × biochar type × rate interactions were significant in HSOM (P < 0.05). A pooled three-factor ANCOVA further indicated that the temporal responses of inorganic N transformation differed among soils and biochar treatments (Supplementary Table 3).
Table 3
Fixed-interval linear regression estimates of net NH4+-N disappearance and net NO3‒-N production in three volcanic ash soils.
| Treatments | LSOM1 | MSOM | HSOM | |||
| NH4+-N rate | NO3‒-N rate | NH4+-N rate | NO3‒-N rate | NH4+-N rate | NO3‒-N rate | |
| Urea, U | 21.49 ± 0.27 Aa | 6.55 ± 1.26 Aa | 7.86 ± 0.18 Cc | 6.95 ± 0.61 Aa | 15.35 ± 0.22 Db | 4.39 ± 0.94 Aa |
| U + CB2 (0.2%) | 18.48 ± 0.34 Ba | 7.22 ± 0.67 Aa | 5.36 ± 0.14 Fc | 6.63 ± 0.76 Aa | 11.26 ± 0.12 Eb | 7.45 ± 1.02 Aa |
| U + CB (0.4%) | 17.37 ± 0.27 Bcb | 5.99 ± 1.17 Aa | 10.29 ± 0.11 Bc | 6.35 ± 0.52 Aa | 19.15 ± 0.12 Ba | 5.16 ± 1.45 Aa |
| U + CB (0.8%) | 12.30 ± 0.13 Da | 5.69 ± 1.32 Aa | 6.00 ± 0.15 Eb | 7.36 ± 1.47 Aa | 3.57 ± 0.36 Gc | 7.25 ± 0.68 Aa |
| U + GB3 (0.2%) | 20.27 ± 0.22 Aa | 5.75 ± 1.80 Aa | 6.81 ± 0.13 Dc | 9.03 ± 0.35 Aa | 16.11 ± 0.13 Db | 6.64 ± 0.91 Aa |
| U + GB (0.4%) | 10.59 ± 0.34 EFc | 5.45 ± 1.53 Aa | 11.60 ± 0.13 Ab | 5.86 ± 0.83 Aa | 21.43 ± 0.07 Aa | 4.28 ± 0.71 Aa |
| U + GB (0.8%) | 11.57 ± 0.16 DEb | 5.32 ± 1.09 Aa | 8.02 ± 0.11 Cc | 7.48 ± 0.52 Aa | 16.06 ± 0.14 Da | 5.61 ± 1.18 Aa |
| U + CMB4 (0.2%) | 8.40 ± 0.35 Ga | 5.97 ± 0.90 Aab | 7.94 ± 0.14 Ca | 7.99 ± 0.87 Aa | 8.70 ± 0.20 Fa | 3.56 ± 0.82 Ab |
| U + CMB (0.4%) | 16.38 ± 0.32 Ca | 4.26 ± 1.73 Aa | 10.41 ± 0.05 Bb | 6.47 ± 0.46 Aa | 1.77 ± 0.33 Hc | 6.17 ± 0.48 Aa |
| U + CMB (0.8%) | 9.85 ± 0.18 FGb | 5.16 ± 1.41 Aa | 9.81 ± 0.15 Bb | 5.94 ± 0.80 Aa | 17.82 ± 0.14 Ca | 3.94 ± 0.86 Aa |
| Within-soil interaction effects on regression slopes | ||||||
| Time × treatment | *** | ns | *** | ns | *** | * |
| Time × biochar type | *** | ns | *** | ns | *** | * |
| Time × biochar rate | *** | ns | *** | * | *** | ns |
|
Time × biochar type × rate | *** | ns | *** | ns | *** | * |
All units are expressed as mg N kg-1 d-1. Values are presented as rate ± SE from fixed-interval linear regression using net values. Different uppercase letters indicate significant differences among treatments within the same soil and N form, whereas different lowercase letters indicate significant differences among soils within the same treatment and N form (Tukey’s test, P < 0.05).
4CMB, chicken manure biochar. Within-soil interaction effects were evaluated by ANCOVA using incubation time as a continuous covariate. The Time × Treatment term was evaluated using all N-amended treatments, whereas Time × Biochar type, Time × Biochar rate, and Time × Biochar type × Rate were evaluated using only the biochar–urea treatments. Significant interactions indicate differences in temporal slopes. ns, not significant;
In LSOM, the highest net NH4+-N disappearance rates were observed under urea alone and U + GB (0.2%), at 21.49 and 20.27 mg N kg-1 d-1, respectively, whereas the lowest rate was observed under U + CMB (0.2%), at 8.40 mg N kg-1 d-1. Most biochar treatments showed lower NH4+-N disappearance rates than urea alone, whereas net NO3‒-N production rates did not differ significantly among treatments. In this LSOM (non-Andisol), which had relatively low CEC and limited reactive mineral phases, the lower NH4+-N disappearance rates under most biochar treatments may reflect differences in physicochemical NH4+-N retention and/or slower conversion of NH4+-N to NO3‒-N (Clough et al., 2013; Tsai and Chang, 2020; Dey and Mavi, 2021).
In the two Andisols, biochar effects varied markedly with feedstock and application rate. Net NH4+-N disappearance ranged from 5.36 to 11.60 mg N kg-1 d-1 in MSOM and from 1.77 to 21.43 mg N kg-1 d-1 in HSOM. Although net NO3‒-N production rates did not differ significantly among individual treatments in either soil (P > 0.05), ANCOVA revealed a biochar rate-dependent temporal response in MSOM and feedstock-rate-dependent responses in HSOM. These contrasting patterns may reflect their different mineralogical properties: MSOM contained both allophane and Al–organic complexes, whereas HSOM was dominated by Al–organic complexes. Such differences in reactive mineral phases and SOM stabilization may have modified NH4+-N retention, microbial N transformation, and the subsequent availability of NH4+-N for nitrification (Shoji et al., 1993; Huygens et al., 2011; Clunes et al., 2021).
Overall, biochar effects were more pronounced for net NH4+-N disappearance than for net NO3‒-N production. The pooled analysis further showed that NH4+-N disappearance was more responsive to interactions involving soil, biochar type, and application rate, whereas NO3‒-N production was influenced primarily by differences among soils. These contrasting responses among the non-Andisol and the two Andisols suggest that inorganic N dynamics reflected the combined influences of soil physicochemical properties, including SOM and reactive mineral phases, together with biochar type and application rate.
First-order kinetics of apparent net inorganic N accumulation under urea fertilization
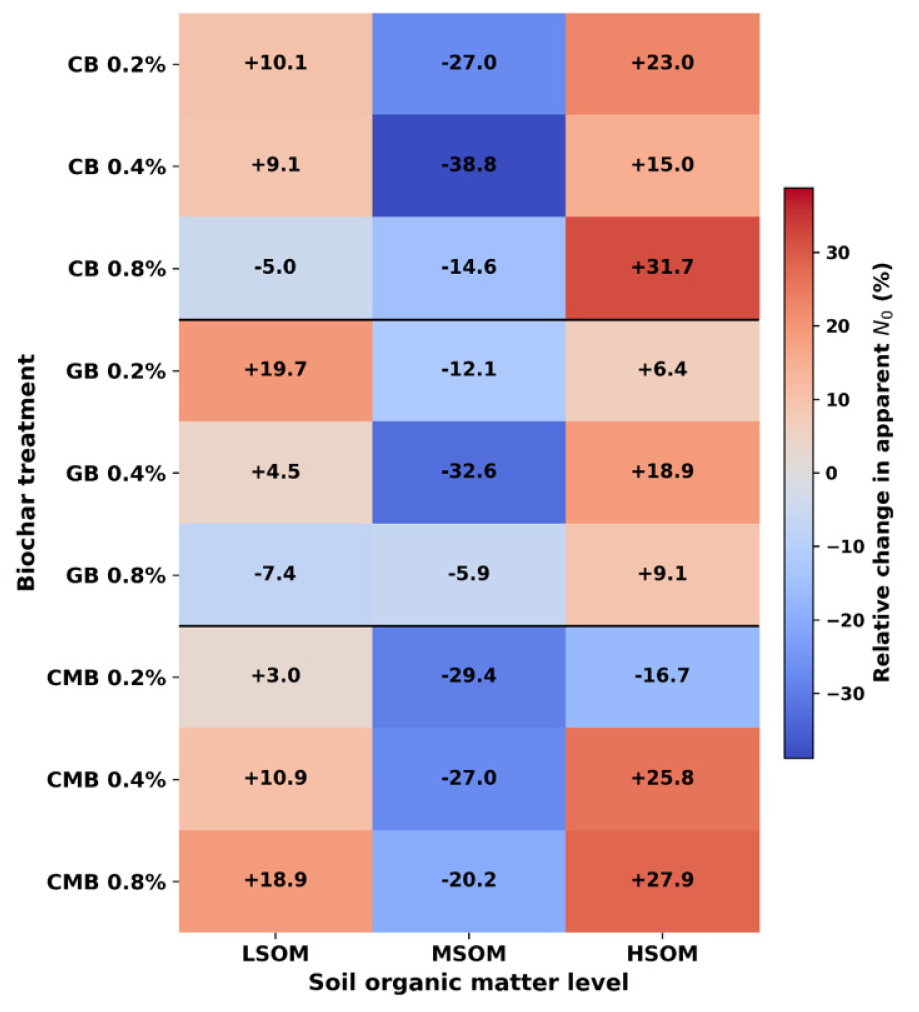
The adjusted R2 values for the first-order model fitted to apparent net inorganic N accumulation ranged from 0.742 to 0.986 during the incubation period (Table 4). In the urea-only treatment at 200 mg N kg-1, N0 values were 199.0 mg N kg-1 in LSOM, 303.4 mg N kg-1 in MSOM, and 171.5 mg N kg-1 in HSOM. Although the applied urea-N level provides a useful reference, N0 should not be interpreted as a direct recovery of fertilizer-derived N. Rather, it is a fitted apparent parameter derived from net inorganic N accumulation during incubation.
Table 4
Apparent first-order kinetic parameters and relative changes in N0 under urea-only and biochar–urea co-application treatments in three volcanic ash soils during a 90-day incubation.
| Treatments | LSOM1 | MSOM | HSOM | |||||||||
|
N0 (mg N kg-1) |
k (day-1) |
Adjusted R2 |
Relative change (%) |
N0 (mg N kg-1) |
k (day-1) | Adjusted R2 |
Relative change (%) |
N0 (mg N kg-1) |
k (day-1) |
Adjusted R2 |
Relative change (%) | |
| Urea, U | 199.0 | 0.417 | 0.914 | - | 303.4 | 0.325 | 0.833 | - | 171.5 | 0.320 | 0.827 | - |
| U + CB2 (0.2%) | 219.0 | 0.337 | 0.894 | 10.1 | 221.5 | 0.442 | 0.956 | -27.0 | 210.9 | 0.686 | 0.895 | 23.0 |
| U + CB (0.4%) | 217.2 | 0.384 | 0.853 | 9.1 | 185.7 | 0.329 | 0.927 | -38.8 | 197.2 | 1.183 | 0.934 | 15.0 |
| U + CB (0.8%) | 189.1 | 0.448 | 0.916 | -5.0 | 259.2 | 0.244 | 0.927 | -14.6 | 225.8 | 0.636 | 0.965 | 31.7 |
| U + GB3 (0.2%) | 238.2 | 0.405 | 0.871 | 19.7 | 266.7 | 0.489 | 0.742 | -12.1 | 182.4 | 1.198 | 0.941 | 6.4 |
| U + GB (0.4%) | 207.9 | 0.414 | 0.948 | 4.5 | 204.4 | 0.406 | 0.829 | -32.6 | 203.9 | 1.208 | 0.749 | 18.9 |
| U + GB (0.8%) | 184.3 | 0.470 | 0.869 | -7.4 | 285.6 | 0.424 | 0.750 | -5.9 | 187.1 | 1.092 | 0.943 | 9.1 |
| U + CMB4 (0.2%) | 204.9 | 0.365 | 0.986 | 3.0 | 214.2 | 0.365 | 0.812 | -29.4 | 142.8 | 1.490 | 0.918 | -16.7 |
| U + CMB (0.4%) | 220.6 | 0.494 | 0.777 | 10.9 | 221.4 | 0.480 | 0.831 | -27.0 | 215.8 | 0.585 | 0.829 | 25.8 |
| U + CMB (0.8%) | 236.7 | 0.523 | 0.938 | 18.9 | 242.0 | 0.427 | 0.928 | -20.2 | 219.4 | 1.201 | 0.888 | 27.9 |
Therefore, when compared with the soil-equivalent urea-N input, N0 values in LSOM were close to the applied urea-N level, suggesting that the magnitude of apparent net inorganic N accumulation was comparable to the fertilizer N input. In MSOM, N0 exceeded the applied urea-N level, which may indicate additional contributions from native soil N turnover or treatment-induced stimulation of inorganic N accumulation. Conversely, the lower N0 value in HSOM suggests that part of the applied or released N did not remain in the extractable inorganic N pool. This may reflect microbial immobilization, physicochemical N retention by soil mineral and organic surfaces, or other N transformation processes. The contrasting N0 values among soils may partly reflect differences in their nutrient-retention characteristics. Andisols formed from volcanic materials commonly contain short-range-order minerals such as allophane and imogolite, together with substantial amounts of soil organic matter (Shoji et al., 1993). These properties contribute to high nutrient-retention capacity and may influence organic matter decomposition and N turnover. Yokobe et al. (2020) reported that volcanic ash soils have slower soil N turnover rates compared with non-volcanic soils such as Cambisols and Regosols.
When biochar–urea co-application treatments were compared with the corresponding urea-only treatment, relative changes in N0 revealed distinct response patterns among the three soils. Most biochar treatments increased N0 in LSOM and HSOM, whereas all biochar treatments reduced N0 in MSOM, indicating a soil-dependent response to biochar application. In LSOM, the highest application rates of the plant-residue biochars decreased N0, with 0.8% CB and 0.8% GB showing lower values than the urea-only treatment. However, lower rates of CB and GB, as well as all CMB treatments, resulted in similar or higher N0 values than urea-only treatment. These results indicate that, the N0 response to biochar in LSOM varied with both feedstock type and application rate. In MSOM, all biochar–urea co-application treatments reduced N0 compared with the urea-only treatment. Unlike LSOM and HSOM, where responses varied with biochar feedstock and application rate, this consistent reduction indicates a distinct soil-specific response to biochar application in MSOM. In HSOM, the lowest N0 was observed under 0.2% CMB, whereas most CB, GB, and higher-rate CMB treatments showed higher N0 values than the urea-only treatment, indicating that biochar addition did not uniformly reduce apparent net inorganic N accumulation in HSOM. Overall, these contrasting patterns indicate that biochar did not exert a uniform effect on apparent net inorganic N accumulation across the three soils. Rather, the N0 responses likely reflected the combined influences of biochar feedstock, application rate, and soil properties, including SOM and reactive mineral phases.
The contrasting response of CMB may be partly related to the substantially higher water-extractable inorganic N content (Table 2), which was likely associated with its manure-derived feedstock and relatively high total N content (3.91%). However, the water-extractable inorganic N supplied by CMB was relatively small compared with the total urea-N input. Therefore, the observed changes in N0 cannot be explained by biochar-derived inorganic N alone. Rather, they may reflect the combined effects of biochar-derived nutrients, sorption capacity, microbial N transformation, and native soil N turnover.
Under urea-only application, k values were 0.417 day-1 in LSOM, 0.325 day-1 in MSOM, and 0.320 day-1 in HSOM, indicating that apparent net inorganic N accumulation approached N0 more rapidly in LSOM than in MSOM and HSOM. In HSOM, k values were higher under all biochar–urea co-application treatments than under urea-only application, indicating a more rapid approach toward their respective fitted N0 values. Similar patterns were also observed in MSOM, except for 0.8% CB. In LSOM, biochar co-application either increased or decreased k depending on feedstock and application rate, indicating that the temporal approach toward N0 varied with both amendment characteristics and soil properties. Because N0 differed among treatments, a higher k value should not be interpreted as a greater amount of inorganic N accumulation (Baiga and Rajashekhar Rao, 2017).
Overall, these apparent kinetic parameters indicate that the effects of biochar on apparent net inorganic N accumulation varied among the three soils. Biochar may modify the timing and persistence of extractable inorganic N through physicochemical retention, microbial immobilization, and changes in N transformation processes. Such responses may have implications for improving N management and reducing potential N losses. Combined applications of organic amendments or biochar with chemical fertilizer have also been shown to modify soil N dynamics and the balance between N retention and nutrient supply (Uddin et al., 2021; Dey and Mavi, 2021).
Conclusions
Overall, under urea fertilization, inorganic N dynamics and responses to biochar differed markedly among the three soils, which varied in SOM content and associated physicochemical properties. Urea application caused rapid NH4+-N accumulation during the early incubation period, followed by progressive NO3‒-N accumulation, consistent with active nitrification under aerobic conditions. Biochar–urea co-application modified the temporal patterns of NH4+-N disappearance, NO3‒-N production, and apparent net inorganic N accumulation, with responses varying among soils, biochar feedstocks, and application rates. The fitted kinetic parameters further demonstrated soil-dependent responses to biochar application. In LSOM, 0.8% CB and 0.8% GB produced the greatest reductions in N0 relative to the urea-only treatment, whereas in HSOM, the lowest N0 was observed under 0.2% CMB. In contrast, all biochar treatments reduced N0 in MSOM. These contrasting responses indicate that biochar did not exert a uniform effect on inorganic N dynamics across the three soils and that both biochar properties and soil physicochemical characteristics influenced the magnitude and temporal patterns of inorganic N accumulation. Therefore, the selection of biochar feedstock and application rate for N management in volcanic ash-derived soils should consider soil physicochemical properties, including SOM and reactive mineral phases, rather than SOM content alone. Future studies should link incubation-derived apparent kinetic parameters with field-scale crop N uptake, nitrate leaching, and gaseous N losses to evaluate their relevance under crop-growing conditions.