

Introduction
Nitrogen is not only the nutrient added as fertilizer most extensively and in the greatest amount but also the representative non-point source of surface water eutrophication and NO3- groundwater pollution (Singer and Munns, 2002; Ma et al., 2016). High mobility of N in the environment, through chemical and biological processes such as ammonia volatilization and denitrification and physical processes such as leaching and runoff, imposes high complexity and variability to N dynamics in soils (Fenn and Hossner, 1985; Pierzynski et al., 1994; Martens, 2001). Like nitrogen, the fertilizer component of environmental importance is phosphorus. Much lower solubility and hence lower bioavailability of P relative to N in most natural systems (terrestrial and aquatic) explains why eutrophication of fresh waters is normally limited by P (Addiscott and Thomas, 2000).
Our ability to predict movement of non-point source (NPS) in soils is hampered by cultivation practices as well as spatial and temporal variations in soil. In upland cultivation, ridge and vinyl mulching have often been used in order to facilitate the growth of crops such as red pepper and sesame and maintain more favorable moisture and temperature condition in root zone (Kim et al., 1988; Li et al., 1999; Hwang and Tae, 2001). Microtopography derived from ridge and furrow and physical protection of water penetration by vinyl mulching could considerably alter runoff loss of nonpoint source (Smolikowski et al., 2001; Romic et al., 2002). Runoff loss is the combined results of rainfall amount, rainfall intensity, and soil erodibility, vegetable cover, and topographic characteristics (Li et al., 2006). The contour line row cropping with ridge and mulching could suppress the runoff loss as ridge can play a role of barrier against runoff (Liu et al., 2000). But the ridge and vinyl mulching can alter fertilization practices, because broadcasting additional fertilizer application could be limited by microto-pography and vinyl mulching (RDA, 2013).
The one of important crops to which mulching technique was applied is red pepper. Red pepper used for seasoning is a profitable crop which grows from May to October with considerable inputs of fertilizer and pesticide during the growing season. The cultivated area is largely distributed over hill slope upland where a high potential risk of runoff loss exists during heavy rain (Sohn et al., 1999; Zhang et al., 2016).
A field study, therefore, was conducted to determine the fate of N and P and their runoff and vertical transport out of root zone in plot-scale fields, having three different plots black polyethylene vinyl mulching (mulching plot), ridge without mulching (ridge plot), and flat without ridge and mulching (flat plot).
Materials and Methods
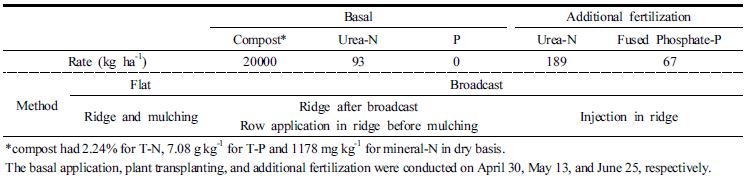
Site characteristics Field plots (width×length, 2×5 m 9EA) with 10% slope were located at N 39.2784°and E 126.9833° in Suwon, Korea. The field plots for soil erosion research were constructed in 1960s with different slopes and lengths and had been cultivated until 2014 for at least 50 years under upland crops such as soybeans, corns, potatoes, and sesame. The physico-chemical properties of the soil were described in Table 1 . Samgag soil series (the coarse loamy, mesic family of Typic Dystruepts) was described as follows. A horizon: 0~12 cm. Very pale brown (10YR 7/3) when dry, light yellowish brown (10YR6/4) when moist, sandy loam; moderate, very fine granular structure; friable, non sticky and non plastic; common fine yellowish mica; pH 4.5. BA horizon: 12~23 cm. Strong brown (7.5YR 5/6) coarse loam; weak, coarse and medium subangular blocky structure; slightly sticky and non plastic; few very fine and fine discontinuous random imped simple tubular pores; mica as above. Bw horizon: 23~32 cm. Reddish yellow (7.5YR 6/6) fine gravelly coarse sandy loam; weak, coarse and medium subangular blocky structure breaking readily to moderate, granular; friable, non-sticky and non-plastic; pores as above. C1 horizon: 32~65 cm Reddish yellow (7.5YR 6/8) fine gravelly loamy sand; structureless (massive) breaking in hand to moderate, granular; firm, non sticky and non plastic; pores as above; mica as above; extremely weathered granitic saprolite. C2 horizon: 65~120 cm. Pale brown (10YR 6/3) as above with common fine and medium faint and distinct reddish yellow strong mottles.
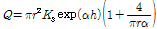
Cultivated practices Flat plot without ridge and mulching was set up as control. Ridge and mulching plots had three plots consisting of 2×5 m plot, respectively. Ridge plot had 15~20 cm ridge without mulching, and mulching plot had 15~20 cm ridge with black vinyl mulching. Table 2 showed the fertilizer application rate and methods. The basal application, plant transplanting, and additional fertilization were conducted on April 30, May 13, and June 25, respectively. On April 30, the ridge formation with contour line and mulching were also accomplished. Composted manure and urea as a basal application were applied at the rate of 20 MT ha-1 and 93 kg N ha-1, respectively. The application method of composted manure was broadcast application in all plots, but the urea had different application methods, broadcast application in flat and ridge plot and with row application before mulching in mulching plot. Urea as a basal application was incorporated with top 5 cm of soil at the rate of 93 kg N ha-1. After then ridge was formed and mulched with black polyethylene vinyl. On May 13, transplanting of red pepper seedling (Capsicum annuum L.) was conducted with planting spaces of 75 cm by 45 cm. Urea at 189 kg N ha-1 and fused phosphate at 67 kg P ha-1 were additionally applied by broadcast application for flat plot and by injection in ridge and mulching plots at June 25. The cultivated practices were referred from RDA (2013).
In-situ infiltration measurement Field saturated hydraulic conductivity were in-situ measured with Disc tension infilt-rometer (Model 2826D20, Soil moisture corp., CA, USA) at soil surface. The limited infiltration rate under soil saturation condition (Ks) was induced by following equation after infiltration measurements with several tension steps with triplicate. It was measured at surface of flat plot.
 (Eq.1)
where Q is the volume of water entering the soil per unit time (cm3 hr-1), r is radius of disc (cm), h is water tension (cm), Ks (cm hr-1) is limited infiltration rate, and a is the parameter of Gardner (1958) equation.
Sampling and analyses The tank for receiving runoff and soil was installed at the lower end of each field plot. At every rainfall event, the each amount of runoff water and eroded soil was measured and sampled. Plant was sampled every month, and their biomass, N, and P content were analyzed. After plant sampling, soil near root zone was sampled at depths of 0~5, 5~20, and 20~40 cm from soil surface for flat, and 0~10cm from ridge surface for ridge & mulching plots. Nitrate-N, and phosphate-P in the runoff water were determined. 40 g (dry basis) were extracted with 200 ml of 2 M KCl solution for determination of mineral-N (NH4+-N, NO3--N) content and 0.01M CaCl2 solution for determination of labile P content (Keeney and Nelson, 1982; Kuo, 1996). Mineral N and P concentrations of the extracts or runoff water were measured by colorimetry (Page, 1982; Kuo, 1996), respectively. Meteorological station where precipitation and air temperature were measured was located in the immediate vicinity of the experimental field. Duncan’s Multiple Range test (DMR at p<0.05) was applied using the Statistical Analysis System (SAS; SAS Institute, US).
Results and Discussion
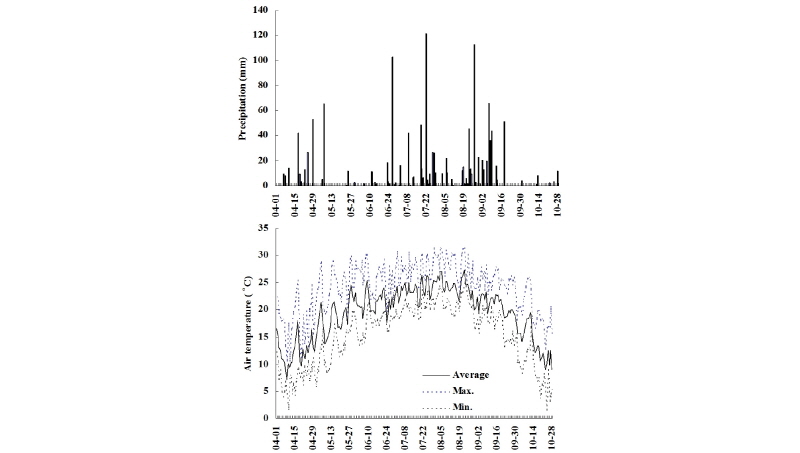
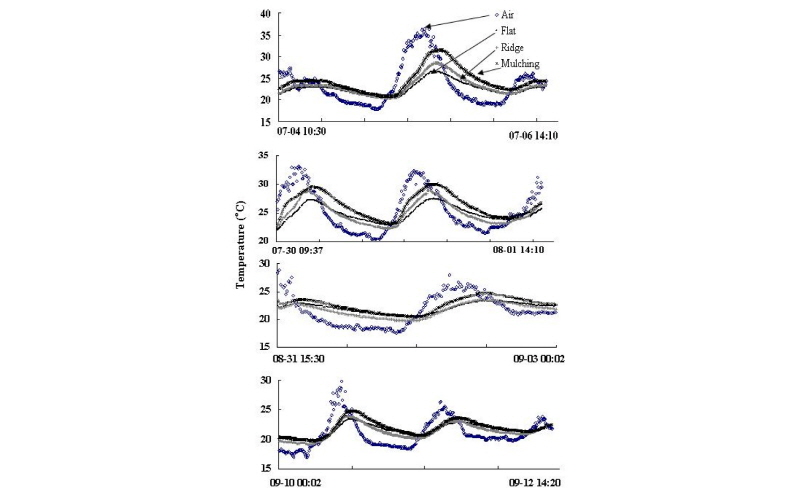
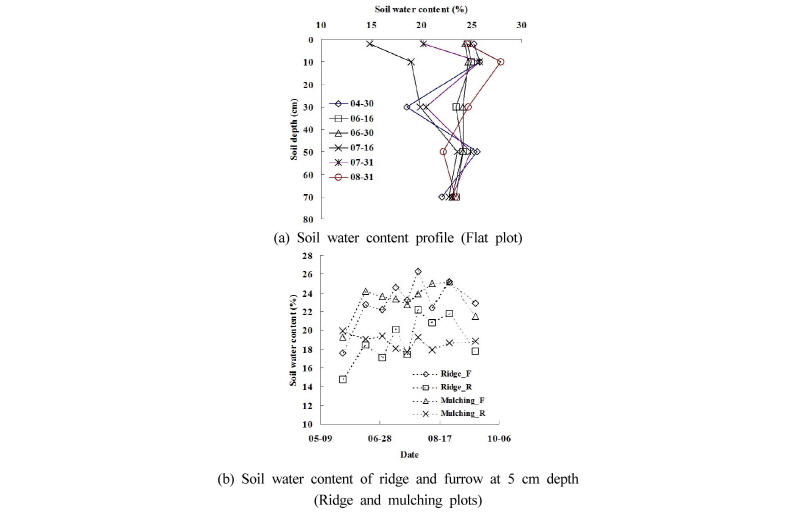
Soil temperature and water content change Total preci-pitation during growth of red pepper (May-13~ September- 30) was 1081 mm and maximum rainfall intensity was 121.5 mm on July-22 (Fig. 1 ). Monthly precipitation in summer season was highest in July (341.9 mm) and decreased in the order of August (293.7 mm), and June (159 mm), but each month had one rainfall event with high intensity more than 100 mm per day. The maximum air temperature was 31.3°C and mean air temperature distributed from 16.1 to 27.1°C. During growth period in 2003, the air temperature was slightly lower than that in normal year, showing many rainy days. Mulching plot generally had highest soil temperature (Fig. 2). It decreased in order of ridge and flat plot. Maximum 2.3°C and 5.4°C increased by formation of ridge and mulching, respectively. The difference of soil temperature between plots was correlated with air temperature and daily temperature fluctuation. Soil water contents were in the range of 15~25% at soil surface and 18~27% at 10 cm depth (Fig. 3(a)). The soil water content of furrow for ridge and mulching plots was generally higher than that of ridge (Fig. 3(b)), and the difference was 1.5~5.8% and 2.7~7.1% for ridge and mulching plot, respectively.
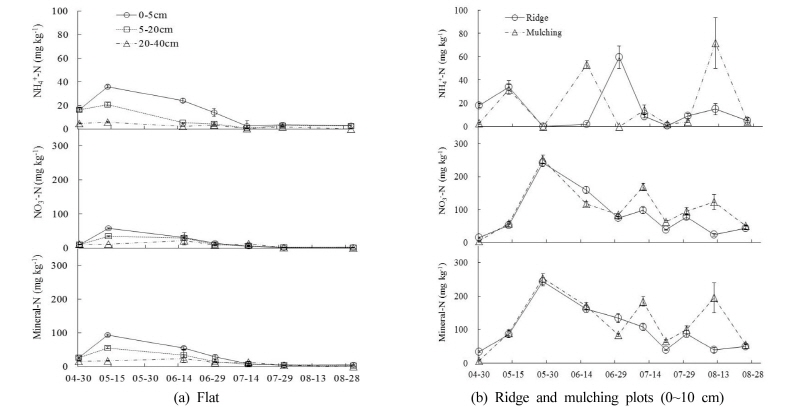
Changes in mineral-N and labile P content in top soil Mineral-N content in flat plots had maximum value at trans-planting day, on May 13, and after that time decreased. Shallower depth had higher mineral-N content. The respective maximum value of NH4+-N and NO3--N was 35.9 and 57.3 mg kg-1 at 0~5 cm, 21.0 and 34 mg kg-1 at 5~20 cm, and 19.9 and 11.4 mg kg-1 at 20~40 cm. Mineral-N content in July was low less than 12 mg kg-1, due to heavy rain and active growth. Ridge and mulching plot at surface soil had much higher than flat plot with relatively high fluctuation (Fig. 4). Contrasting to flat plot, mineral-N contents of surface soils for ridge and mulching plot were more than 100 mg kg-1 in July and more than 30 mg kg-1 in August, showing higher values than flat plot. Labile P contents in ridge and mulching plots were also higher than flat plot, showing in the range of 2 to 16 mg kg-1 with high fluctuation (Fig. 5). The high nutrient concentration in surface soil of ridge and mulching plots could result from fertilizer application method as well as ridge and mulching practices. Broadcast fertilizer application, performed in flat plot, was spatially homogeneous compared to row application and injection in ridge. The ridge in ridge and mulching plots had more nutrient than furrow. In other words, incoming water often bypasses the ridge enriched with nutrient due to micro- topography and vinyl mulching, and thereby mulching decrease vertical nutrient transport (Romic et al., 2002). Less accessibility of water to enrichment zone results in less mobility of solute in the zone (Sparks, 1989). In comparison with water content between ridge and furrow, the water content of ridge generally was lower than that of furrow in the rainy season. This could explain the large accumulation of N and P in surface soil of ridge and mulching plots, compared to flat plot.

Growth and N & P uptake of plant Red pepper growth was the highest in mulching plot and decreased in the order of ridge and flat plot (Fig. 6), showing positively correlated with mineral-N content in surface soil. Especially, the difference of biomass between plots was significant on July 30. N content of plant in flat plot decreased over time, from 4.40% to 2.26% in fruit, from 1.88% to 0.98% in stem, and from 5.77% to 3.65% in leaf. Fruit and stem in ridge plot also showed lower value over time but leaf did not. In mulching plot, N contents of stem and leaf were very high, with about two times in leaf and stem compared to each value of other plots. P content of the plant showed different trends with sampling times and treatments from N content of the plant. P content of the plant generally decreased over time regardless of plots, from 6.41 g kg-1 to 2.01 g kg-1 in fruit, from 2.54 g kg-1 to 0.80 g kg-1 in stem, and from 5.30 g kg-1 to 2.29 g kg-1. Contrasting to N content of the plant, flat plot was higher P content than in other plots except stem P content on June 16. N uptake by plant checked, in June, July, and August, was the highest in mulching plot and decreased in the order of ridge and flat plot, increasing over time in all plots. From June 16 to July 30, which is vegetative growth stage, the amount of N depletion by plant increased about 10 times, while the increase slowed down from July-30 to August-31 except mulching plot (Table 3). Similarly, the amount of P uptake by plant was in the order of mulching plot > ridge plot > flat plot (Table 4) but not significant different between surface management practices except initial stage of plant growth, June 16.

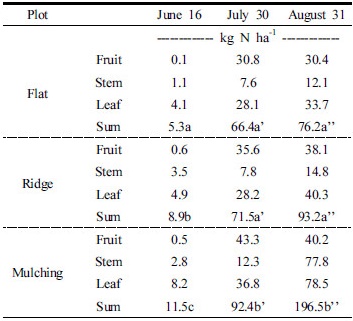
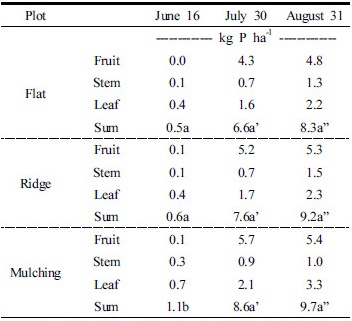
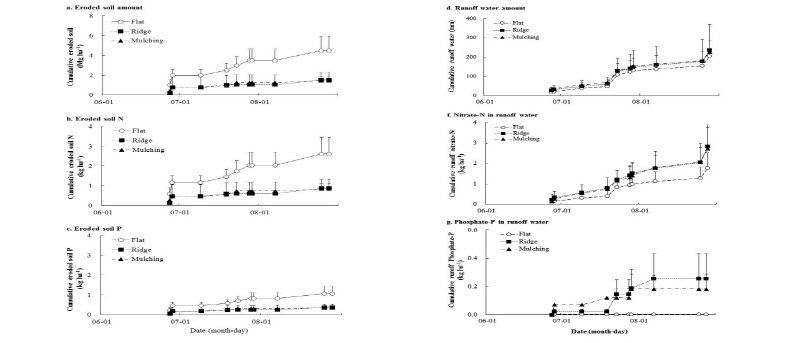
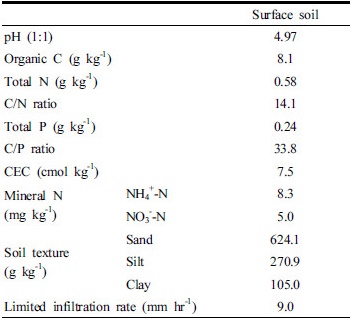
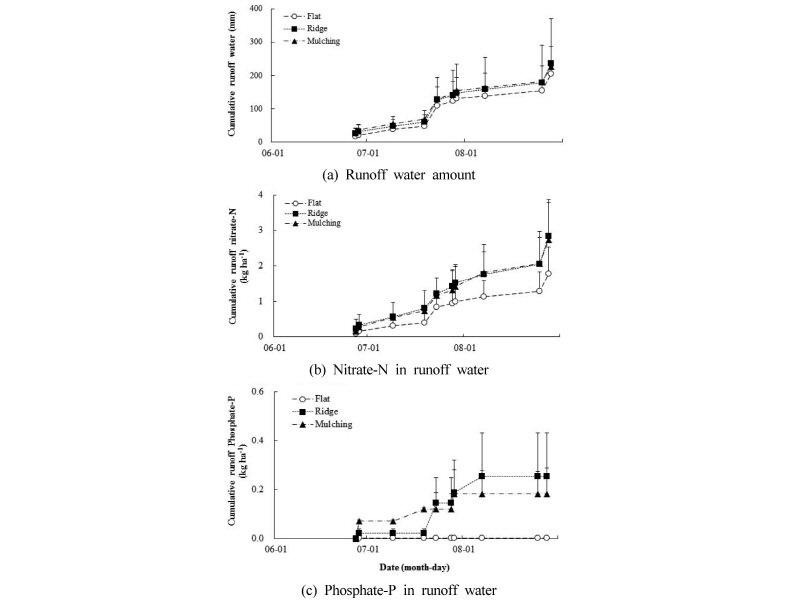
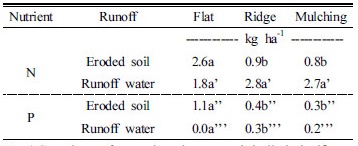
Runoff loss Eroded soil amount by running water on soil surface was highest in flat plot, and showed similar values in ridge and flat plots (Fig. 7). Total nitrogen and phosphorus loss with eroded soil averagely had in the order of flat (2.6 kg ha-1 for T-N, 1.1 kg ha-1 for T-P) > ridge (0.9 kg ha-1 for T-N, 0.4 kg ha-1 for T-P) ~ mulching (0.8 kg ha-1 for T-N, 0.3 kg ha-1 for T-P). Fig. 8 showed runoff and runoff loss of NO3--N and phosphate-P. The amount of runoff was highest in ridge plot. Nitrate loss was positively correlated with the amount of runoff water. Unlike nitrate, phosphate-P loss was not correlated with the amount of runoff water. Phosphate-P runoff loss significantly occurred in August. Table 5 showed the cumulative runoff loss of N and P on August 31, about the end of the vegetative growth stage. Nitrate and phosphate in runoff water had the highest value in ridge plot (2.8 kg ha-1 for nitrate-N, 0.3 kg ha-1 for phosphate-P) and decreased in the order of mulching (2.7 kg ha-1 for nitrate-N, 0.2 kg ha-1 for phosphate-P) and flat (1.8 kg ha-1 for nitrate-N, 0.0 kg ha-1 for phosphate-P). Especially, the flat plot had no phosphate loss during summer season. This is probably due to low labile P content in surface soil of flat plot. The summation of eroded and runoff amount for N and P was highest in flat plot (4.3 kg ha-1 for N, 1.1 kg ha-1 for P) and decreased in the order of ridge (3.7 kg ha-1 for N, 0.7 kg ha-1 for P) and mulching (3.5 kg ha-1 for N, 0.5 kg ha-1 for P).
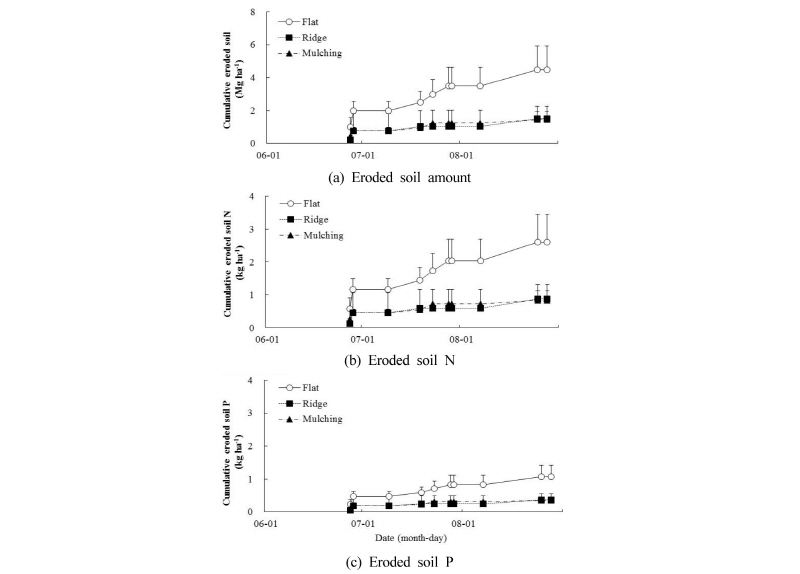
Ridge formation generally results in micro-topography such as furrow and ridge and row paralleled with contour line could suppress the acceleration of runoff water velocity as ridge can play a role of barrier against runoff (Liu et al., 2000). In this study, rainfall event more than 100 mm daily precipitations occurred 3 times, once in June, July, and August, causing considerable soil erosion. Eroded soil amount in flat plot had similar value, about 2 Mg ha-1, between the rainfall events. Ridge and mulching plots had 0.5 Mg ha-1 of eroded soil amount in the June event and decreased rapidly after that. In other words, the soil erosion of ridge and mulching plots in July and August was small, compared to June event. This is probably due to change in soil erodibility by consecutive rainfall. Zhang et al. (2016) showed that the first rainfall event with high intensity after tillage and dry season could cause considerable soil erosion because of loose soil structure and high water dispersivity of dry soil, compared to compacted soil by consecutive rainfall. The water compaction in furrow surface soil in row cultivation like ridge and mulching plots could be larger than in flat plot because of more water concentration in furrow between rows due to micro-topography. Contrasting to ridge and mulching plots, the flowing water with high intensity in flat plot without ridge with contour line caused considerable soil erosion in July and August. In consequence, N and P loss by runoff soil erosion was 3 times higher in flat plot than in ridge and mulching plots with contour lines, showing the physical suppression of the contour line ridge on soil erosion.
Contrasting to the soil erosion, the runoff water amount had no significant differences among three surface management practices including flat, ridge, and mulching, but the higher average value in ridge and mulching plots than flat plot. Nitrate runoff loss was proportional to the amount of runoff, while phosphate loss was not. After July 22, having highest rainfall intensity, phosphate loss in ridge and mulching plots occurred but in the flat plot with lowest labile P content was not detected. This suggested that phosphate loss could be initiated by rainfall event having high intensity in soils with relatively high labile P content.
Conclusions
Different surface management practices (flat, ridge, mulching) in red pepper field caused different runoff loss of N and P. The different surface management practices accompanied the different fertilizer application methods, broadcast application in flat plot and hole injection in ridge and mulching plots. This study showed that the ridge and mulching could reduce soil erosion but that enhance soluble P concentration in runoff water by high nutrient accumulation of surface soils in the ridge and mulching plots. Besides, the highly remained N, and P in surface soil of ridge and mulching plots would have a possibility of runoff or leaching loss. In the future, behaviors of agricultural nonpoint sources by surface management practices need to be continuously investigated after crop harvesting.
