

Introduction
Plants require mineral nutrients, such as inorganic-nitrogen (N) from germination to harvest. During the growing stages, relatively large amount of nitrogen (N), phosphorus (P) and potassium (K) are present in plant tissues and they play a vital role for many metabolisms. For example, Nitrogen (N) is a main component of amino acids and nucleotides, and essential in the synthesis of many non-protein compounds, photosynthetic pigments, secondary metabolites and polyamines (Scheible et al., 2004). Phosphorus (P) is a component of many cellular molecules, plays essential roles in structural maintenance, and also has roles in primary and secondary metabolism in plants (Plaxton, 2004). Despite being not assimilated into organic compounds, K in metabolism is playing important roles such as direct enzyme activation, long distance transport of solutes and osmotic regulation, and the translation for ribosomal function (Amtmann et al., 2008). Therefore, deficiency of these nutrients not only influencegrowth and yield of crops, nutritional quality, taste, processing and storage, but also strongly affects the type and amount of metabolites produced in individual cell and whole plant level (Amtmann and Armengaud, 2009).
Metabolomics, which is comprehensively profiling and interpreting metabolites, is now well-established scientific field and provides a much broader view of systematic adjustment in metabolic processes compared to the conventional biochemical approaches, and also gives abundant opportunities to reveal new insights on metabolism. Plant metabolites are the intermediate or ultimate products of complex networks of biochemical pathways involved in plant metabolism (Bundy et al., 2009; Kusano et al., 2011). Because of their various roles in plant growth and function, in addition to biochemical roles, mineral deficiencies can indirectly or directly affect plant metabolic pathways and thus affect the quantities of metabolites.
Substantial information on plant metabolic changes in a variety of mineral stress has been provided with various plant species such as Arabidopsis (Hirai et al., 2004; Armengaud et al., 2009; Tschoep et al., 2009), Barlely (Huang et al., 2008), Bean (Hernandez et al., 2007), Gentiana (Takahashi et al., 2012), Spinach (Okazaki et al., 2008), and Tomato (Urbanczyk- Wochniak and Fernie, 2005; Sung et al., 2015). Such efforts enable us to understand how inorganic nutrients are absorbed better and allocated by plants and, finally, metabolized with organic compounds. However, as a result of being focused on C/N metabolism (glycolysis and TCA cycle), it is necessary to elucidate how metabolites such as nucleotides, peptides, lipids, phenylpropanoids-derivates are regulated by severely low mineral conditions. In the previous study (Sung et al., 2015), we obtained several new findings on C/N (glycolysis and TCA cycle) metabolism in leaf and root of tomato plants grown under NPK-starved conditions. Our hypothesis is that the mineral starvation contributes differently to the metabolic responses with the type of mineral and tissue. To achieve this goal, commercial tomato seedlings were grown hydroponically under N, P or K-starved condition, and the levels of a wide range of metabolites were analyzed from leaf and root materials using LC/MS and GC/MS. The results here will be mainly discussed with primary (nucleotides, peptides, lipids) and secondary (phenylpropanoids, flavonoids) metabolic changes, and provide new information on mineral- and tissue-dependent metabolic changes in this species.
Materials and Methods
Plant Materials and Growth Conditions Tomato seeds (Solamum lycopersicum cv. Seonmyoung) were germinated on perlite supplied with deionized water for 2 weeks. Twelve uniformly sized seedlings were transplanted into holes in lids of aerated 20 L hydroponic containers containing 1/3 strength Hoagland solution, and grown for another 2 weeks prior to initiation of treatments. The composition of mineral solution (NPK sufficient) was: 5 mM Ca(NO3)2․4H2O, 5 mM KNO3, 2 mM MgSO4․7H2O, 0.5 mM KH2PO4, 1.5 mM Fe-EDTA, 1 mM NH4NO3, and 1 mL micronutrients mixture (H3BO3, 2.86 g L-1; MnCl2․4H2O, 1.81 g L-1; ZnSO4․7H2O, 0.22g L-1; CuSO4․5H2O, 0.051 g L-1; H2MoO․ 4H2O, 0.09 g L-1). In order to induce mineral deficiency of tomato plants, each N, P or K-deficient medium was adjusted to 1/10 strength of mineral sufficient medium as follows; 0.5 mM Ca(NO3)2․4H2O and 0.5 mM KNO3 for N deficiency, 0.05 mM KH2PO4 for P deficiency, and 0.5 mM KNO3 for K deficiency, respectively. The shortage of Ca, K and NO3 resulted from N, P or K deficiency was equivalently compensated with CaCl2, KCl and NH4NO3, respectively. Plants were grown at 30 ± 3°C during the day and at 20 ± 3°C during the night. Mid-day photosynthetic photon flux density was 800-1,200 μmol m-2 s-1. The nutrient solution was replaced every 3 days. Three plants having a similar growth from each treatment were harvested between 10:00 am and 12:00 am to minimize diurnal effects on metabolite levels at 5 and 15 days from four mineral conditions (NPK sufficiency and N, P or K deficiency). Upper fully-expanded leaves and whole roots were rinsed briefly with deionized water and immediately frozen in liquid nitrogen, and stored at -80°C until biochemical analysis.
Metabolomic Profiling The GC-MS method for the analysis of leaf metabolites was previously developed (Nikiforova et al., 2004). The automated MicroLab STAR® system were used for sample preparation (Hamilton Company). For quality controls, recovery standards were added prior to the first step of the extraction process. A proprietary series of organic and aqueous extractions removed the protein fraction while allowing maximum recovery of small molecules. The resulting extract was divided into two fractions; one for LC analysis and the other for GC analysis. The organic solvent was removed using a TurboVap® (Zymark). Each sample was then frozen and dried under vacuum. Samples were then prepared for both LC/MS and GC/MS anlaysis. The LC/MS was based on a Waters ACQUITY UPLC (Waters Corporation) and a LTQ mass spectrometer (Thermo Fisher Scientific Inc.), which consisted of an electro spray ionization (ESI) source and linear ion-trap (LIT) mass analyzer. The sample extract was split into two aliquots, dried, then reconstituted in acidic or basic LC- compatible solvents, both of which contained 11 or more injection standards at known concentrations. One aliquot was analyzed using acidic positive ion optimized conditions and a second aliquot using basic negative ion optimized conditions in two independent injections into separate dedicated columns. Extracts reconstituted in acidic conditions were gradient eluted using water and methanol, both containing 0.1% formic acid. The basic extracts also used water and methanol, both containing 6.5 mM ammonium bicarbonate. The MS analysis alternated between MS and data-dependent MS2 scans using dynamic exclusion. The samples destined for GC/MS analysis were re-dried under vacuum desiccation for at least 24 hours, then they were derivatized under dried nitrogen using bistrimethyl- silyl-triflouroacetamide (BSTFA). The GC column was 5% phenyl and the temperature was ramped from 40° to 300°C over a 16 minute period. Samples were analyzed on a Thermo- Finnigan Trace DSQ fast-scanning single-quadrupole MS using electron impact ionization. The instrument was tuned and calibrated daily for mass resolution and mass accuracy. The output from the raw data files was automatically extracted as discussed below. The LC/MS portion of the platform was based on a Waters ACQUITY UPLC and a Thermo-Finnigan LTQ-FT mass spectrometer, which had a linear ion-trap (LIT) front end and a Fourier transform ion cyclotron resonance (FT-ICR) MS backend. An accurate mass measurement was performed for ions with counts greater than 2 million. The typical mass error was less than 5 ppm.
Compound identification and normalization Compounds were identified by comparison to purified standards or recurrent unknown entities. Identification of known chemical entities was based on comparison to metabolomic library entries of purified standards. More than 1,000 commercially available purified standard compounds were in the Laboratory Information Management System (LIMS) for distribution to both the LC and GC platforms for determination of their analytical charac-teristics. The combination of chromatographic properties and mass spectra indicated a match to a specific compound or an isobaric entity. Additional entities were identified by recurrence (both chromatographic and mass spectral). A data normalization step was performed to correct variation from instrument inter-day tuning differences (Evans et al., 2009). Essentially, each compound was corrected in run-day blocks by registering the medians to equal one (1.00) and normalizing each data point proportionately.
Statistical analysis To visualize the entire data set, we generated heat maps to show fold change for each compound identified by GC-MS and LC-MS analyses of the tissue samples. Fold change for each metabolite was calculated as the mean relative quantity of that compound in each treatment divided by the quantity in the control treatment (NPK optimal). Statistical analysis of the data was performed using the program R (http://cran.r- project.org). A p-value was obtained by Welch’s t test, and if p ≤ 0.05, the metabolite was considered significantly increased or decreased in abundance. We used the FDR (false discovery rate), which is one of statistical methods to estimate that the proportion of false discoveries for the list of compounds whose p-value is below the cot off for significance, to correct for Welch’s two sample t test comparisons for the hundreds of compounds detected. The FDR for a given set of metabolites was estimated by the q value (Storey and Tibshirani, 2003). Box plots were generated for compounds with a significant increase or decrease using both t test and FDR, with p < 0.05 and q < 0.10 as significance values.
Results
The results of heat maps of untargeted compounds obtained from 171 in leaf and 227 in root and PCA (principal component analysis) was described in the previous study in detail (Sung et al., 2015), and we here concentrate on explaining and interpreting the results of lipids, nucleotides, peptides and secondary metabolites.
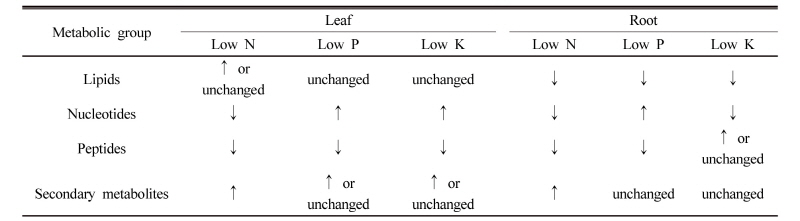
Lipids metabolism in responsive to N, P or K-starvation Although the levels of lipids highly differed from minerals and tissues, in tomato plants growing under mineral starvation the majority of the lipids identified from leaf (22) and root (45) under N, P or K-starvation were observed to mostly decrease (Fig. 1 ). Phospholipids, glycerol 3-phosphate (G3P) and glycerolphosphorylcholine (GPC), and choline phosphate markedly increased in N-starved leaf and K-starved leaf and root, however showed significant decrease under P starvation. Besides, the relative levels of free fatty acids-pools were markedly low in N-starved leaf and root, whilst several phospholipids components were significantly increased in leaf and the up- and down-changes of them were observed in root. The levels of lipids under P starvation also revealed an overall decreasing trend in both tissues except for several metabolites such as free fatty acids and sterols. By contrast, free fatty acids in K-starved leaf remained constantly or reduced slightly, while phospholipids and other lipid-derivatives showed the trend of an increase or consistency. In K-starved root free fatty acids overall markedly reduced whereas phospholipids and other lipid-derivatives did not show the similar responsive pattern.
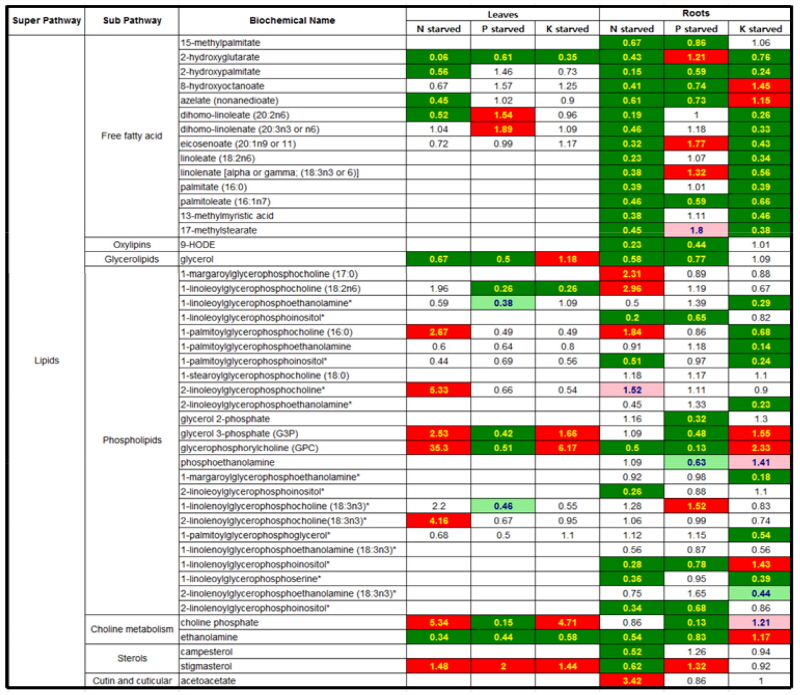
Fig. 1
Heat map showing the ratio of the metabolite (lipids) levels in N, P or K-starvation to NPK sufficiency. Cells shaded with green indicate significant difference (p ≤ 0.05) between the groups shown, metabolite ratio of < 1.00. Cells shaded with indicate narrowly missed statistical cutoff for significance 0.05 < p < 0.10, metabolite ratio of < 1.00. Cells shaded with red indicate significant difference (p ≤ 0.05) between the groups shown, metabolite ratio of ≥ 1.00. Cells shaded with light red indicate narrowly missed statistical cutoff for significance 0.05 < p < 0.10, metabolite ratio of ≥ 1.00. Cells shaded with non-colored text and cell mean values are not significantly different for that comparison. The score in each cell indicates the fold changes between N deficiency and NPK sufficiency. Tomato plants were grown in a Hoagland nutrient solution with 5 mM KNO3 (optimal K) or 0.5 mM KNO3 (low K), harvested at day 5 and 15 after the treatment, and separated into leaves and roots.
Nucleotides metabolism in responsive to N, P or K-starvation The nucleotides of 20 and 22 were identified in leaf and root of N, P or K-starved tomato plants, respectively, and a tendency of metabolic changes revealed highly mineral- dependent response (Fig. 2). The pattern of change in the purine and pyrimidine pools under N starvation was somewhat different with tissues which indicated an increase or decrease in leaf and a consistency or decrease in root. N1-methyladenosice and isoguanine in N-starved leaf were the most prominently increased nucleotides whilst adenine and guanosine showed the relatively higher decline. By contrast, almost 70% of nucleotides measured from N-starved root were observed in a dramatic decrease, and the rest remained constantly. Allantoin, guanine and cytosine-2`,3`-cyclic monophosphate were remarkably high nucleotides, which indicated more than 4 times increase, throughout this time-course. The K starvation-induced nucleotide profiles were differed between leaf and root. The leaf profile was marked by an increase in the levels of purines (adenine, adenosine, allantoin, guanine, guanosine-2`,3`-cyclic monophosphate, N1-methyladenosine, N2,N2-dimethylguanosine) and a decrease in the levels of purines (2`-deoxyadenosine, guanosine) and pyrimidine (β-alanine). By contrast, most of nucleotides in root were significantly reduced by K starvation, and adenine and allantoin were only increased.
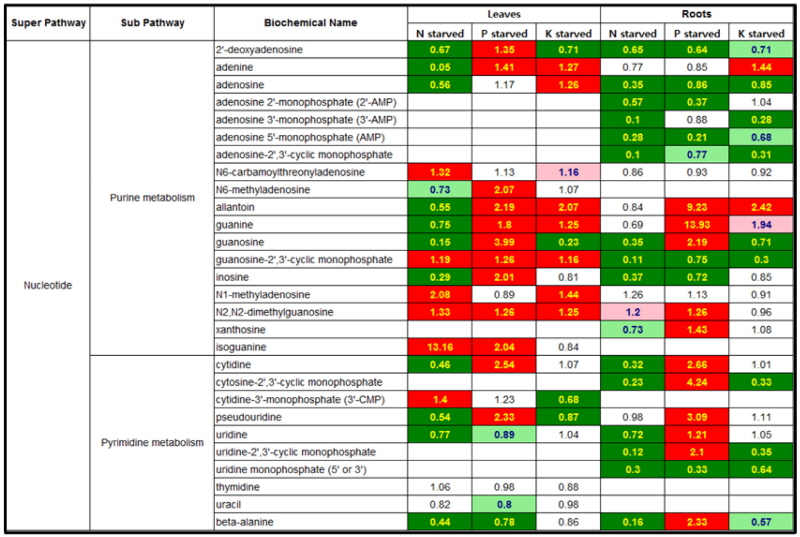
Fig. 2
Heat map showing the ratio of the metabolite (nucleotides) levels in N, P or K-starvation to NPK sufficiency. Cells shaded with green indicate significant difference (p ≤0.05) between the groups shown, metabolite ratio of < 1.00. Cells shaded with indicate narrowly missed statistical cutoff for significance 0.05 < p < 0.10, metabolite ratio of < 1.00. Cells shaded with red indicate significant difference (p ≤ 0.05) between the groups shown, metabolite ratio of ≥ 1.00. Cells shaded with light red indicate narrowly missed statistical cutoff for significance 0.05 < p < 0.10, metabolite ratio of ≥ 1.00. Cells shaded with non-colored text and cell mean values are not significantly different for that comparison. The score in each cell indicates the fold changes between N deficiency and NPK sufficiency. Tomato plants were grown in a Hoagland nutrient solution with 5 mM KNO3 (optimal K) or 0.5 mM KNO3 (low K), harvested at day 5 and 15 after the treatment, and separated into leaves and roots.
Peptides metabolism in responsive to N, P or K- starvation The 12 peptides were detected in tomato leaf grown under N, P or K starvation whilst 49 in root (Fig. 3). N or P starvation induced a dramatic decrease in most peptides in both tissues. Only two peptides, γ-glutamylglutamate and isoleucylserine for N-starved root, and γ-glutamylglutamate and γ-glutamylglutamine for P-starved root, were markedly accumulated. However, K starvation differently influenced the concentration in both tissues suggesting that the peptides in leaf mostly declined whereas those in root remained unchanged or increased significantly. A γ-glutamylglutamine was found in a markedly accumulated peptide in K-starved root. The γ- glutamy groups and ananylleucine, analylvaline, valylme-thionine, valylvaline, phenylalanylleucine, isoleucylserine, lysilleucine, serylleucine, threonylleucine and valylisoleucine showed significant increase in the range from 1.25 to 1.73 fold change.
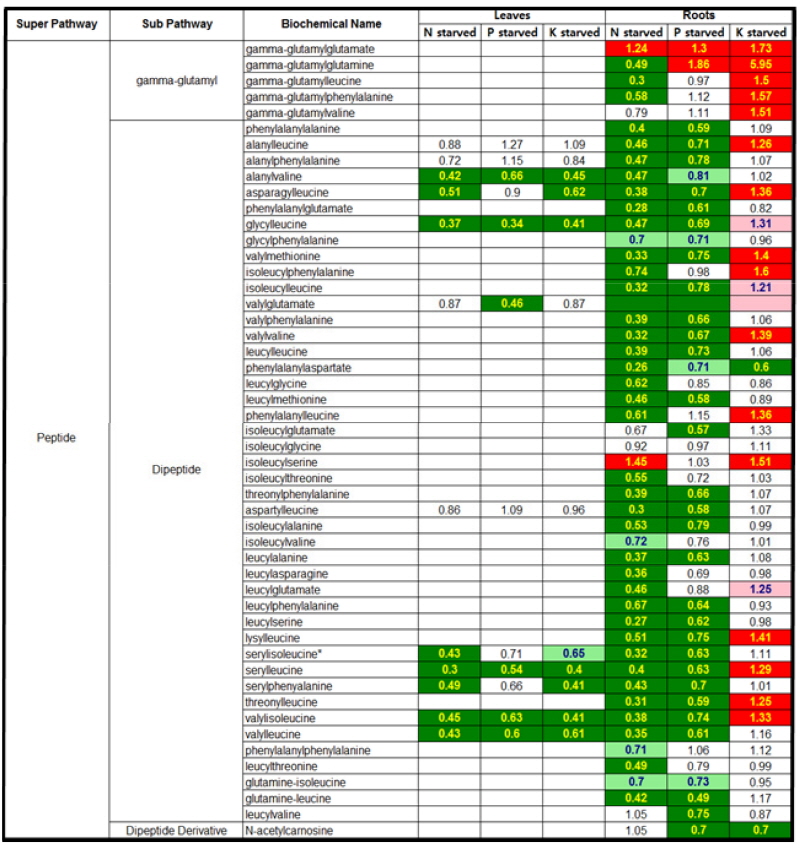
Fig. 3
Heat map showing the ratio of the metabolite (peptides) levels in N, P or K-starvation to NPK sufficiency. Cells shaded with green indicate significant difference (p ≤ 0.05) between the groups shown, metabolite ratio of < 1.00. Cells shaded with indicate narrowly missed statistical cutoff for significance 0.05 < p < 0.10, metabolite ratio of < 1.00. Cells shaded with red indicate significant difference (p ≤ 0.05) between the groups shown, metabolite ratio of ≥ 1.00. Cells shaded with light red indicate narrowly missed statistical cutoff for significance 0.05 < p < 0.10, metabolite ratio of ≥ 1.00. Cells shaded with non-colored text and cell mean values are not significantly different for that comparison. The score in each cell indicates the fold changes between N deficiency and NPK sufficiency. Tomato plants were grown in a Hoagland nutrient solution with 5 mM KNO3 (optimal K) or 0.5 mM KNO3 (low K), harvested at day 5 and 15 after the treatment, and separated into leaves and roots.
Secondary metabolism in responsive to N, P or K- starvation The leaf and root of tomato grown in N, P or K-starved condition generally caused a dramatic increase in the levels of secondary metabolites, benzenoids, flavonoids and phenylpropanoids (Fig. 4). The levels of vanillate, rutin, chlorogenate, coniferyl aldehyde, salicylate, vanillin and pinoresinol showed a significant increase in both tissues during N starvation whereas ferulate was reduced in root. In contrast, only a few metabolites were significantly changed in the leaf and root of P or K-starved condition. The significant increases in vanillate, ferulate and vanillin were observed in the leaf during P starvation whilst the levels of most secondary metabolites in the root remained constant except for a great reduction in coumaroylquinate. The metabolic changes observed in K starvation were a similar tendency with those in P starvation. The levels of vanillate, ferulate and salicylate showed a large increase in the leaf whilst a rutin was sharply decreased. Most of metabolites in K-starved root were observed at the constant levels during the experiment except for a marked reduction in coumaroylquinate.
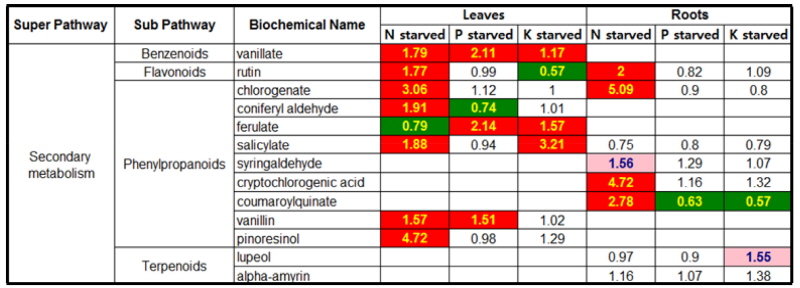
Fig. 4
Heat map showing the ratio of the metabolite (secondary) levels in N, P or K-starvation to NPK sufficiency. Cells shaded with green indicate significant difference (p ≤ 0.05) between the groups shown, metabolite ratio of < 1.00. Cells shaded with indicate narrowly missed statistical cutoff for significance 0.05 < p < 0.10, metabolite ratio of < 1.00. Cells shaded with red indicate significant difference (p ≤ 0.05) between the groups shown, metabolite ratio of ≥ 1.00. Cells shaded with light red indicate narrowly missed statistical cutoff for significance 0.05 < p < 0.10, metabolite ratio of ≥ 1.00. Cells shaded with non-colored text and cell mean values are not significantly different for that comparison. The score in each cell indicates the fold changes between N deficiency and NPK sufficiency. Tomato plants were grown in a Hoagland nutrient solution with 5 mM KNO3 (optimal K) or 0.5 mM KNO3 (low K), harvested at day 5 and 15 after the treatment, and separated into leaves and roots.
Discussion
The limitation of N, P or K supply has previously been demonstrated to lead to large fluctuations of primary metabolites such as amino acids, glycolysis and carbohydrate, and TCA cycle intermediates, metabolic changes, however, were strongly differed from the stressed period, the type of mineral, and the organs and species of plants (Rufty et al., 1988; Chu et al., 1992; Scheible et al., 1997, Urbanczyk-Wochniak and Fernie, 2005; Sung et al., 2015). For the purpose of the current study a LC- and GC-MS-based metabolic profiling approach was used to study a global metabolic response to mineral (N, P, K) starvation. This method provides a large amount of data concerning mineral-dependent changing metabolite patterns, and the interpretation of miscellaneous metabolites such as lipids, nucleotides, peptides and secondary metabolites is more difficult than primary metabolites, e.g. C/N metabolism, and, evenly, the information was unclear or very little known about miscellaneous metabolic changes. Therefore, the data here allow a comprehensive description of metabolic events following mineral stresses and highlight areas of interest for future study.
Lipids metabolism revealed a strong dependence with a type of mineral which indicating that the majority of lipids was strongly decreased. Several reports demonstrated the relation between the status of minerals and lipid metabolism. For example, nitrogen starvation did not affect the levels of fatty acids (Urbanczyk-Wochniak and Fernie, 2005; Gaude et al., 2007), and phosphate starvation induced the biosynthesis of sulfolipids and galactolipids (Essigmann et al., 1988; Härtel et al., 2000; Awai et al., 2001; Kelly and Dörmann, 2002; Kelly et al., 2003) and the replacement of phospholipids to digalactosyldiacylglycerol (DGDG). However, these studies are not enough to support and interpret the reason that the majority of lipids decreased. Thus, on the basis of our previous study (Sung et al., 2015), we suggest one possibility that the accumulation of carbohydrates and glycolysis-intermediates under mineral starvation strongly restricts lipid biosynthesis. Although most lipids were strongly decreased, interestingly, glycerophosphodiesters, mainly glycerophosphocholines (GroPCho), were markedly accumulated under N starvation. In plants glycerophosphodiester accumulation was observed in physio-logical situations involving membrane turnover or degradation (van der Rest et al., 2002), seed germination (Menegus and Fronza, 1985; Roscher et al., 1998), sucrose starvation (Journet et al., 1986; Aubert et al., 1996). Therefore, more detail further study is required to verify N-dependent glycerophosphodiester metabolism. It was complicated and difficult to interpret nucleotide metabolism presented here (Fig. 2). The change in nucleotides showed a tendency of metabolites-, minerals- and tissues-specific pattern. Overall, nucleotide pools were decreased by N or K starvation whilst increased by P starvation. The substantial changes in nucleotide metabolism have been observed as a result of being affected by various environmental factors and investigated by comparative studies on the fate of nucleotides via de novo, salvage and degradation pathways. These include N-dependent nucleotide metabolism (Scheible et al., 2004), the reduction in ATP and UTP (salvage pathway) under P starvation (Ashihara and Ukaji, 1986; Dancer et al., 1990), a decrease in nucleotide pool by salt stress (Peterson et al., 1987, 1988; Nieman et al., 1988; Akatsu et al., 1996), and an induction of adenine phosphori-bosyltransferase (APRT) for the synthesis of ATP in Fe- deficient condition (Itai et al., 2000). In the present study, P starvation-induced increase in nucleic acids such as adenine, guanine and cytidine seems to be a result which indicating a physiological importance of P on nucleotide metabolism, and, moreover, an accumulation of inosine and allantoin shows an increased activation of degradation pathway, as reported by Stasolla et al. (2006). Although an alteration of regulation of purine and pyrimidine metabolisms was observed in N, P or K-starved condition, it is still infancy to understand and elucidate the physiological meaning of this change. Mineral (N, P, K) starvation led to major changes in peptide metabolism in the leaf and root of tomato plants (Fig. 3). There is a large decrease in almost all peptides by N- or P-starvation whilst a marked increase in several peptides by K starvation. We provide new information about that the starvation of N and P causes a limited synthesis or great degradation of peptides and K starvation an accumulation of peptides by lower protein activity. However, it is unclear how these changes in peptides are associated with a type and status of minerals, and further study needs know the interaction between peptides and minerals. Fig. 4 summarizes the impact of mineral starvation on secondary metabolism. Compared to mineral sufficiency, N, P or K-starved leaf contained high levels of several products, including benzenoids, flavonoids and phenylpropanoids whilst metabolites in the root were strongly induced by N starvation. A marked decrease of the levels of phenylpropanoid precursor-aromatic amino acids such as phenylalanine and tyrosine was observed for N- or K-starved plants (Fritz et al., 2006; Sung et al., 2015), and the significant accumulation of secondary metabolites such as phenylpropanoids and flavonoids under nutrient stress were reported (Chishaki and Horiguchi, 1997; Scheible et al., 2004). Particularly surprising in the result presented here is the large accumulation of carbon-rich metabolites (chlorogenate, rutin), and N-starved plants showed the most sensitive response. These data are largely consistent with previous studies (Matt et al., 2002; Urbanczyk-Wochniak and Fernie, 2005), and, nevertheless, it is clear that further study is required to clarify the interaction between primary and secondary metabolism under a variety of mineral stresses.
Conclusions
In a previous paper (Sung et al., 2015), we described that there are large changes in the levels of primary metabolites when mineral (N, P, K) deficiency is subjected to tomato plants. The results presented in this paper provide mineral- and tissue-specific alterations of lipids, nucleotides, peptides and secondary metabolites in tomato plants. Mineral starvation led to a major change in the levels of G3P, GPC and choline phosphate. Overall, nucleotides responded toward decreased levels in N or K starvation and increased levels in P starvation. Almost all peptides were negatively influenced by N or P starvation whilst K starvation (especially root) led to an accumulation of higher levels of peptides. Mineral starvation generally caused a dramatic increase in the levels of secondary metabolites, in particular, rutin and chlorogenate in both tomato tissues during N starvation were most obvious. Therefore, we suggest that the complex regulation involved in the metabolic networks are largely affected by a type of minerals, and detailed studies are required to elucidate an interaction between each mineral and metabolic pathway with an assistance of genomic- and proteomic-approach.
