

Introduction
Materials and Methods
Soil preparation
EC1:5 measurements with different shaking time
ECe measurements with different standing time
Statistical analysis
Results and Discussion
Conclusions
Introduction
Electrical conductivity (EC) is a measure of soil salinity, and EC are measured in either soil-water extracts at a varying rate from 1:1 to 1:5 (Sonmez et al., 2008) or in soil saturated paste extracts (USDA, 1954). Measuring EC of soil extracts (ECsw) at varying soil-water ratio is easy, but field application of ECsw is limited as it does not reflect soil solution EC (Sonmez et al., 2008; Chi and Wang, 2010; Khorsandi and Yazdi, 2011; Aboukila and Abdelaty, 2017; Aboukila and Norton, 2017). The EC of saturated paste (ECe), which is the standard method, represents soil salinity which are experienced by plant roots. However, saturated paste extraction is criticized for being labor intensive and time-consuming, and for difficulty in determining the correct saturation point (Al-Busaidi et al., 2006). In addition, measurement of ECe is costly when the number of samples is high or frequent monitoring is required (Aboukila and Norton, 2017).
Though ECsw and ECe are widely used for soil salinity assessment, the details of the methods differ with countries. For example, shaking time for obtaining ECsw is 0.5 hr for South Korea (RDA, 2001) and 1 hr for USA (USDA, 1954). The standing time for ECe is 16 hrs for South Korea (RDA, 2001) and 24 hrs for USA (USDA, 1954). Therefore, it is necessary to investigate the effects of shaking and standing times on EC measurement to make sure that the current method (i.e., shaking and standing times) is appropriate across soil types and salinity levels. As clays have stronger affinity to cations than sands and dissolution of salts from highly saline soils may take a longer time, it was hypothesized that longer shaking and standing times may be required to dissolve salts from soil particles for fine-textured and highly saline soils compared to coarser-textured and less saline soils. To test the hypotheses, in this study, changes in EC with shaking time (for ECsw) and standing time (for ECe) were investigated using two soils (silt loam and sandy loam) with seven levels of EC.
Materials and Methods
Soil preparation
Approximately 100 kg of soils samples were collected from surface (0 - 20 cm) of the experiment farm (126°53′52″E, 35°10′24″N) of Chonnam National University, Gwangju, Korea. According to the USDA Soil Taxonomy, the soil was classified as Fluvaquetic Endoaquepts (RDA, 2001). The soils were air-dried and passed through a 4-mm sieve, and used for the experiments. Soil texture determined using the pipette method (Gee and Bauder, 1986) was silt loam (sand 43.0%, silt 56.5%, and clay 0.5%). Sandy loam soils (sand 75.0%, silt 18.0%, and clay 7.0%) were prepared by mixing silicate sand with silt loam soils at 1:1 w/w ratio. The sand was pre-washed with tap water to remove any salts and used after oven-drying at 105°C. Each 5 kg of the soil was placed in a plastic container (29 × 20 × 18 cm3). A total of 14 soil containers was prepared for two soil texture groups and seven salinity gradients in triplicates.
Seven levels (1, 2, 4, 8, 12, 16, and 24 dS m-1) of salt solution were prepared by dissolving chemical grade (Junsei, Japan) salts (NaCl, NaNO3, CaSO4 ‧ 2H2O, KNO3, and MgCl2) in deionized water. At first, 24 dS m-1 solution was prepared by dissolving NaCl (5.1 g L-1), NaNO3 (5.1 g L-1), CaSO4 ‧ 2H2O (1.7 g L-1), KNO3 (1.7 g L-1), and MgCl2 (3.4 g L-1), and the lower saline solution was prepared by diluting the solution progressively with deionized water. The ionic compositions used in the present study were determined by considering the reported cations concentration for RTLs in South Korea (Lim et al., 2020). The soil and soil-sand mixtures were treated with 1,000 mL of the target salt solutions to super-saturate the mixture. The containers were placed in a room for 1 month to ensure homogenous distribution of dissolved salts in the soils. After 2-month aging, the containers were evaporated in drying ovens at 40°C to dryness for 7 - 10 days. The dried soils were passed through a 2-mm sieve.
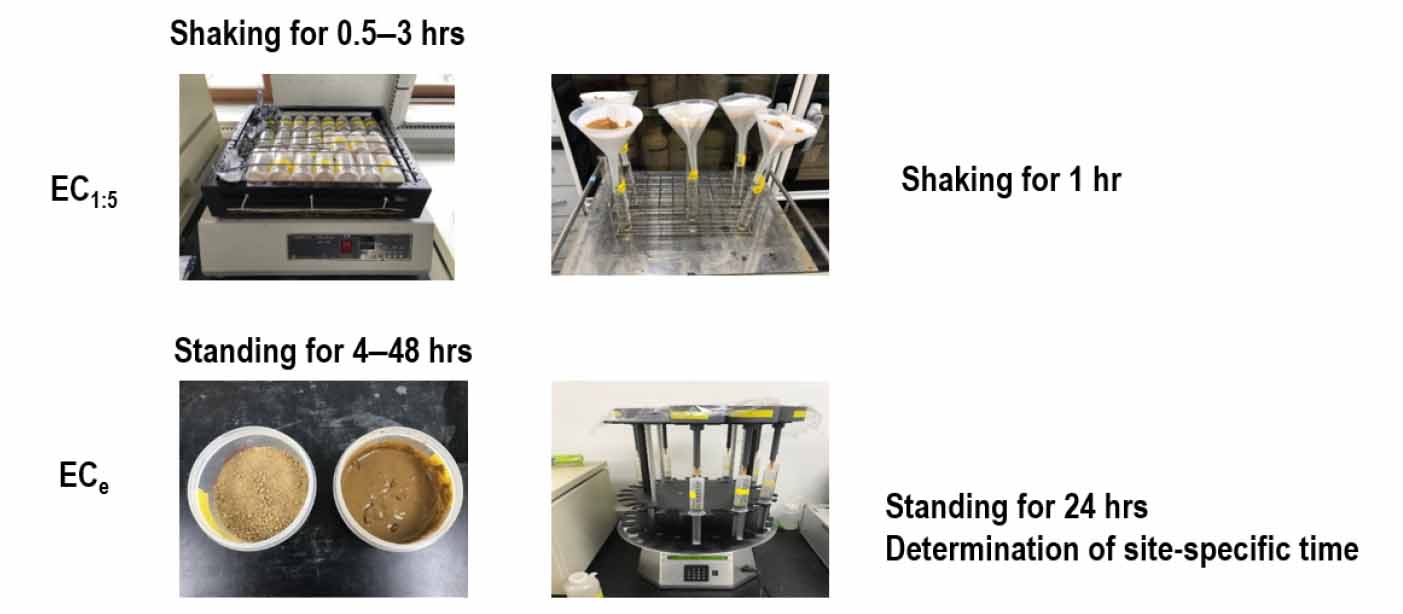
EC1:5 measurements with different shaking time
Soil samples (10 g) in triplicates were placed into 100 mL plastic bottles and 50 mL of distilled water was added. The bottles were shaken at 150 rpm for different times (0.5, 1, 2, and 3 hrs). The soil mixtures were filtered through a filter paper (Whatman #42) to obtain soil extracts, and EC was measured with a conductivity meter (Orion 3 STAR, Thermo Fisher Scientific Korea, Seoul, Korea) (Rhoades, 1996).
ECe measurements with different standing time
Determination of the correct water saturation point for soils is labor intensive and time-consuming, and thus experimental errors of ECe measurement are often caused by addition of different amount of water from the saturation point (Al-Busaidi et al., 2006). Therefore, to minimize experimental errors among replicates, a saturation point was pre-determined for the soils using extra soil samples. The water saturation percentage of the soils (300 g) were 119.4 mL for silt loam and 81.6 mL for sandy loam.
Soil sample (300 g) was placed into a wide-mouth plastic container (470 mL) in triplicates. The pre-determined volume of the deionized water was added to saturate the soils, and mixed thoroughly with a spatula to make saturated pastes. After 4, 8, 16, 24, and 48 hrs of standing time, the pastes were extracted using a vacuum extractor (SampleTek 24VE. MAVCO INDUSTREIS, Inc. Kentucky, USA) to obtain extracts. The extracts were measured for EC using the conductivity meter.
Statistical analysis
For statistical analyses, data were tested for homogeneity of variance and normality of distribution with Levene’s test and Kolmogorov-Smirnov test, respectively. All data were found to be normally distributed with homogenous variances. The effects of equilibrium time on EC was assessed by analysis of variance (ANOVA). The effects of soil texture on EC were also explored using ANOVA, and the mean difference in EC between silt loam and sandy loam was estimated with a regression analysis of EC of silt loam and sandy loam. All statistical analyses were performed with the IBM SPSS Statistics 23 (IBM Corp., Armonk, New York, USA). Statistical significance was set at α = 0.05.
Results and Discussion
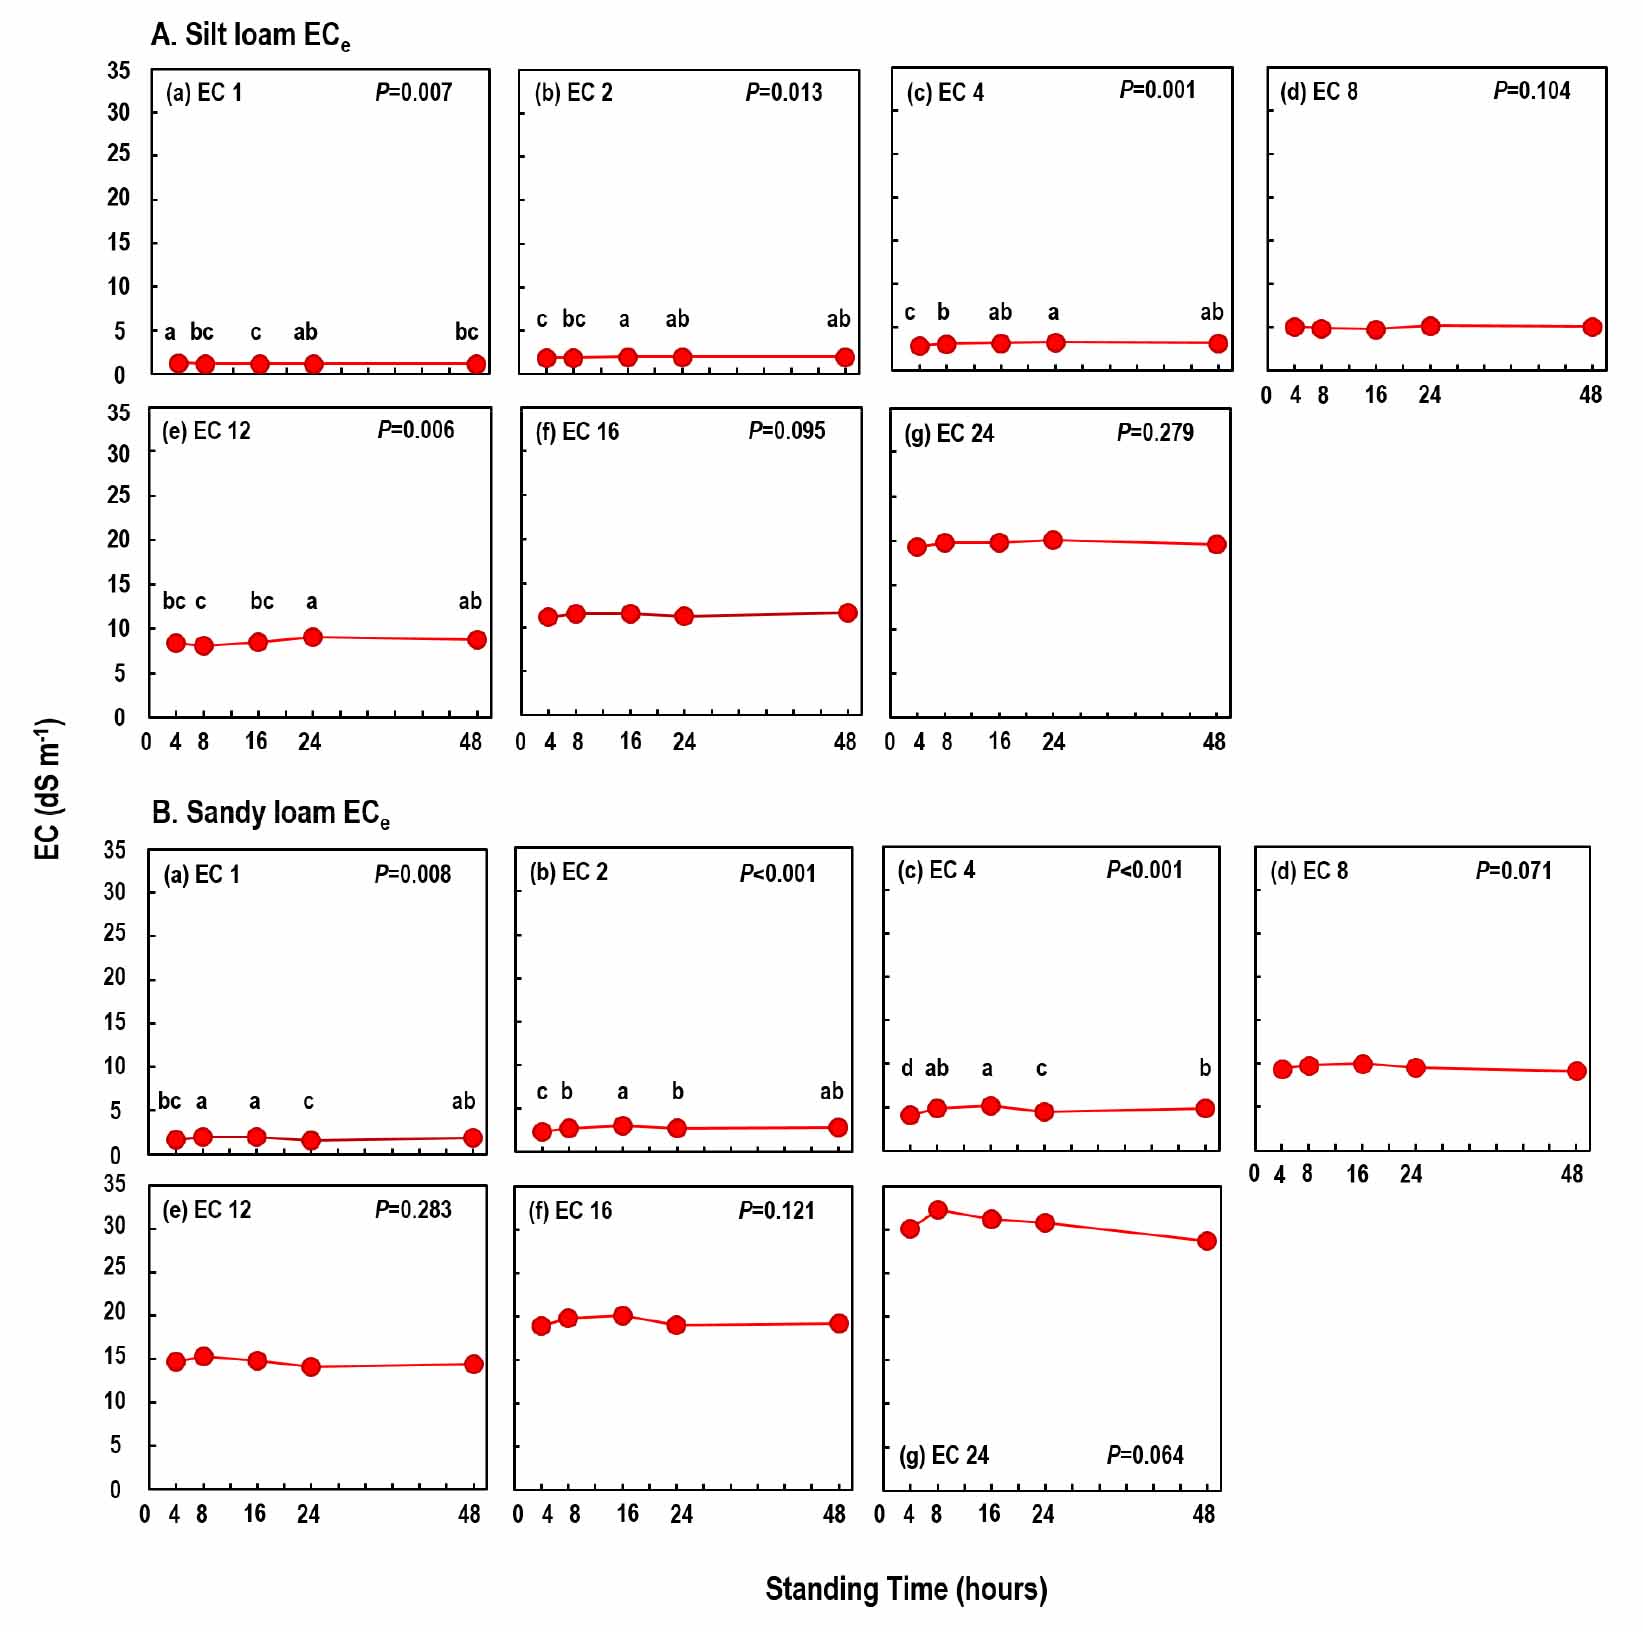
For both silt loam and sandy loam soils, there was no considerable variations in soil ECe with standing time (Fig. 1). There were some indications of changes in ECe with time for soils treated with solutions of EC 1, 2, 4, and 12 dS m-1 for silt loam soils and with solutions of EC 1, 2, and 4 dS m-1 for sandy loam soils. Though overall changes in ECe relative to 4-hr standing time were less than 5%, for both silt loam (Fig. 1-A(c)) and sandy loam (Fig. 1-B(c)) soils treated with solution of 4 dS m-1, ECe increased by 10 - 14% and by 8 - 25% with increasing standing time from 4 to 48 hrs. Therefore, our results indicate that 4 hrs of standing time are sufficient for measurement of ECe for most saline soils regardless of soil texture. As there was no consistency in the changes in ECe with standing time across the texture and EC levels, it was not possible to explain such a large variation for soils treated with EC 4 dS m-1 solution. However, the great variations in ECe up to 25% suggest that though the standard standing time is suggested to be 16 hrs for South Korea (RDA, 2001) and 24 hrs for USA (USDA, 1954), it is necessary to determine site-specific standing time for ECe needs for long-term monitoring of ECe. It has been suggested that standing time for ECe is affected by some soil properties such as type of salt present (Richard and Gouny, 1965) and gypsum content (Khorsandi and Yazdi, 2011).
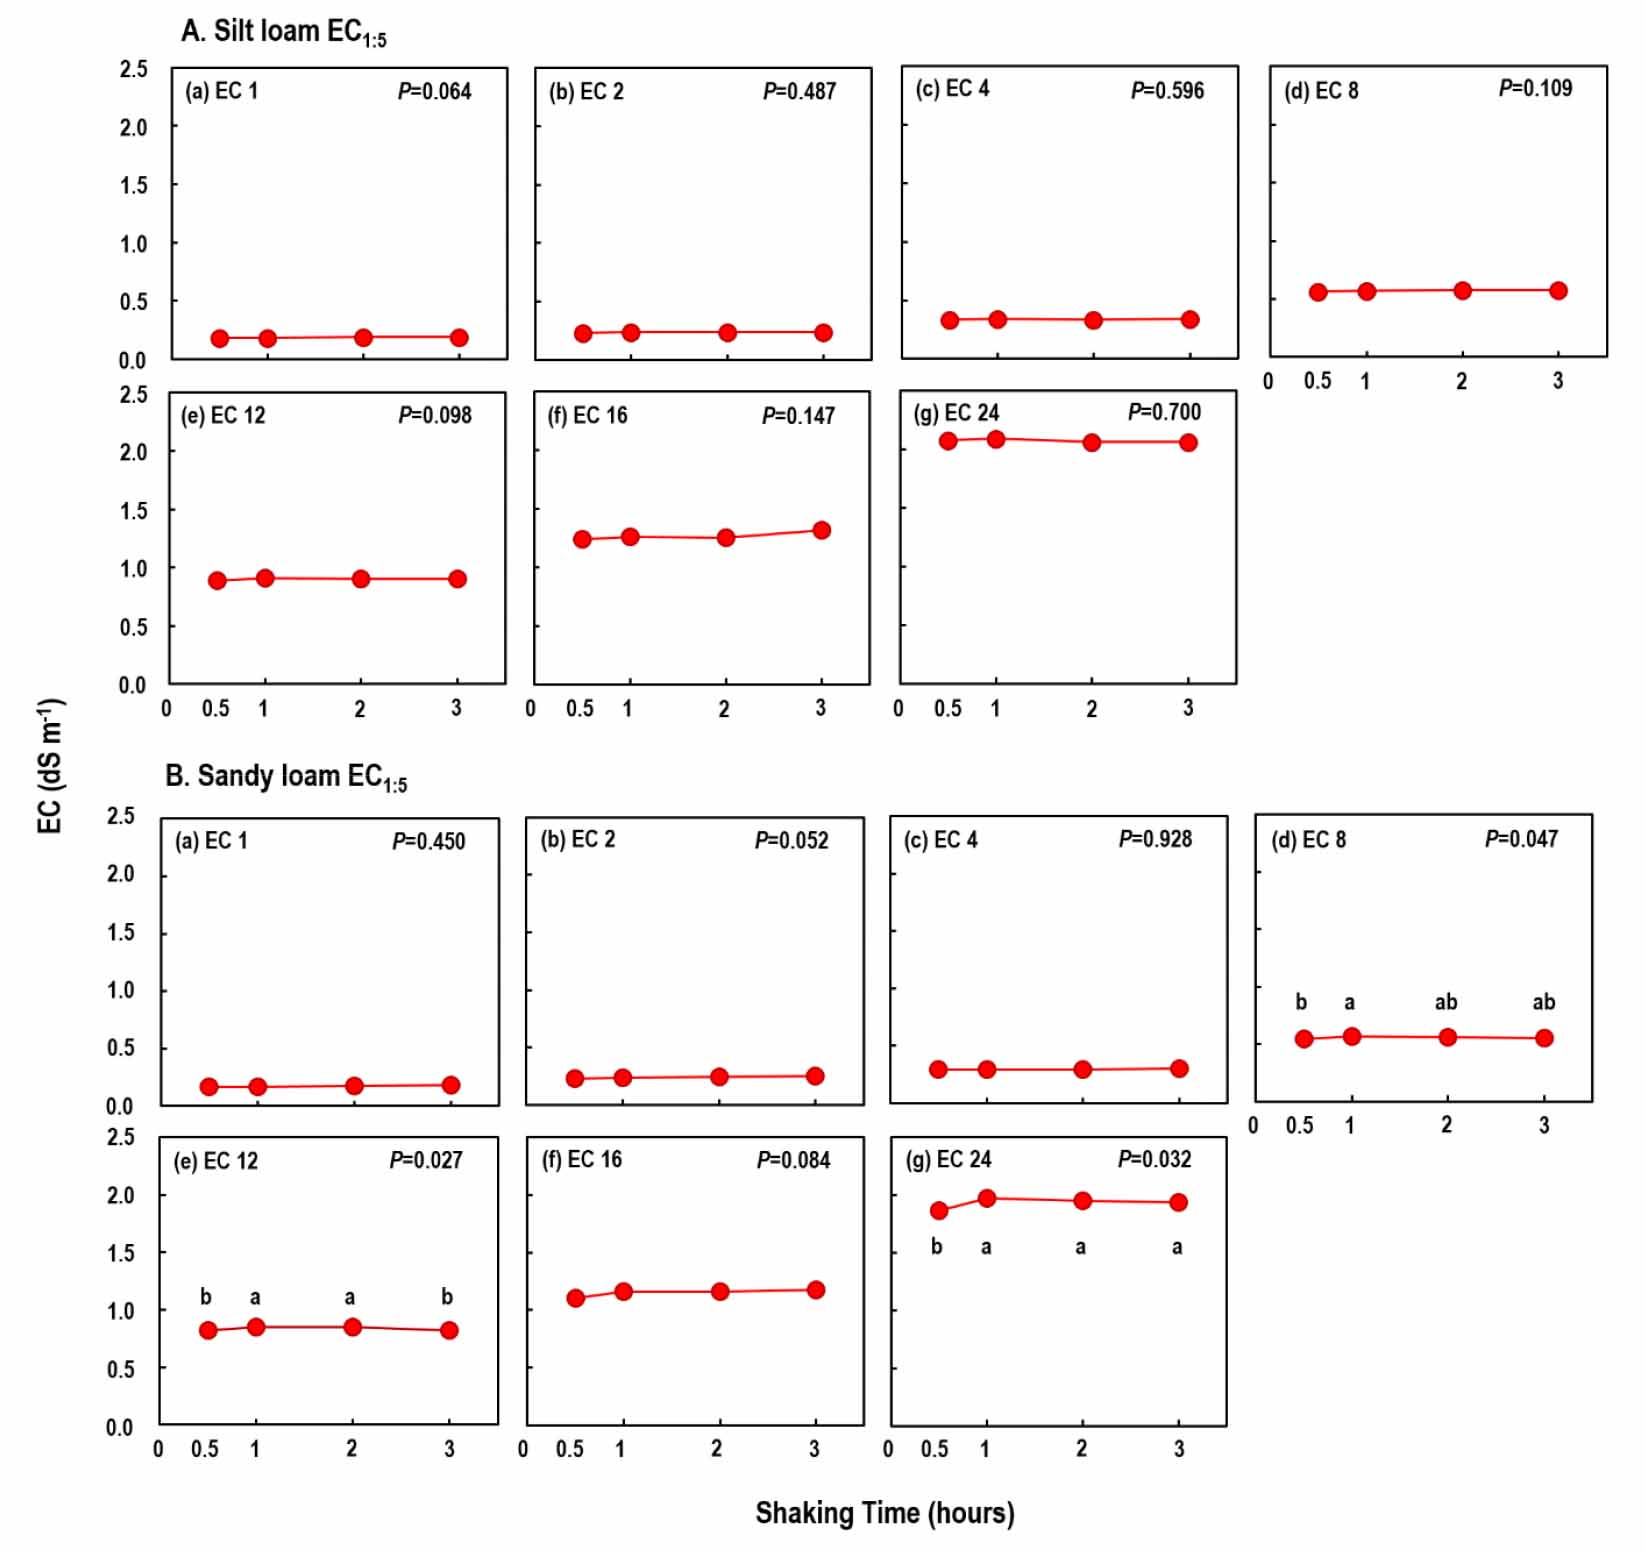
Unlike ECe, changes in EC1:5 with shaking time (0.5 - 3 hrs) was found for only sandy loam soils with less than 6% variations (Fig. 2). Such negligible variation suggests that the Korean standard method (0.5 hr) (RDA, 2001) is reasonable. However, for sandy loam soils treated with solution of 24 dS m-1, 1 hr shaking increased EC1:5 by 5.7% compared to 0.5 hr shaking, indicating that shaking for 1 hr may be necessary for highly saline soils as recommended by USDA (1954). However, it is also cautioned that increasing shaking time may lead to overestimation of EC due to dissolution of salts from soil minerals. For example, calcium and sulfate ions may unnecessarily increase EC in soils containing gypsum and calcite (Hogg and Henry, 1984; Al-Mustafa and Al-Omran, 1990).
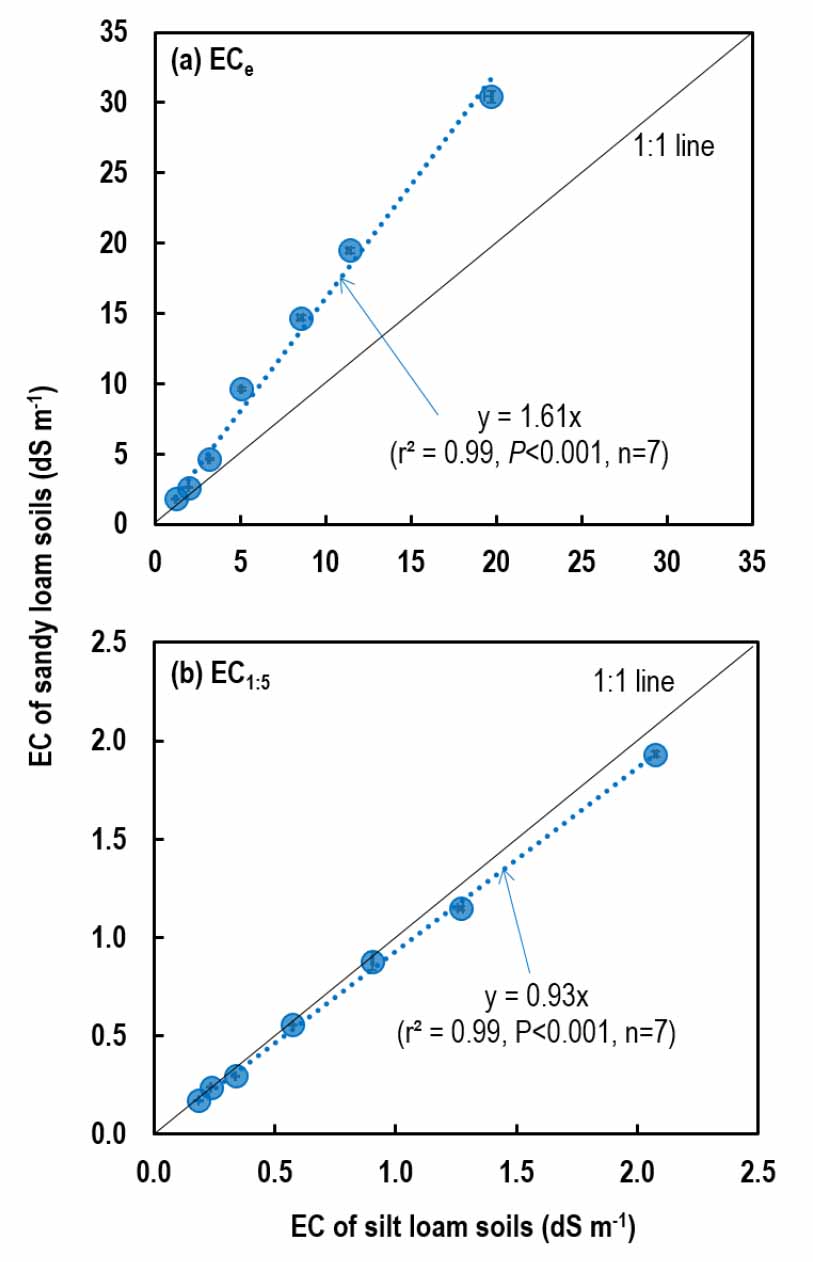
It is interesting to observe ECe of sandy loam soils were 61% (estimated from the slope of Fig. 3a) greater compared to that of silt loam soils despite that both soils received the same quantity of salts at the given EC levels. The difference in EC1:5 between soil textures was only 7% (Fig. 3b). Such a great difference in ECe should be attributed to difference in distilled water added to soils to saturate the soils; 119.4 mL for silt loam and 81.6 mL for sandy loam soils. This is because saturation percentage of coarser soils is lower than that of finer soils, resulting in ion concentrating effects (Kargas et al., 2018; Gharaibeh et al., 2021).
Conclusions
Our study shows that 4 hrs of standing time for ECe are sufficient for most saline soils regardless of soil texture. However, occasional occurrence of large variations in ECe with standing time suggests that the necessity of determination of site-specific standing time for ECe needs to ensure sufficient time for ions equilibrium for precise measurement of ECe. For EC1:5 measurements, it was suggested that shaking for 1 hr is necessary for highly saline soils.
