

Introduction
Crop yield and grain quality is sensitive to drought stress that is the most severe abiotic stress to crop. In South Korea, it is reported that the possibility of crop yield fluctuation by drought stress increase because the drought severity will increase in the near future due to climate change and the overall influence of drought will grow (Kwak et al., 2016). Irrigation during periods of low or no rainfall can significantly increase crop yield. Subsurface drip irrigation (SDI) is the irrigation method to crops through buried lines containing embedded emitters with certain spacing. The SDI systems are usually installed below tillage depth, which can be intended for multiple-year use. In recent years the interest in SDI to vegetables, fruit and field crops has increased around the world in various climate zones since the conservation of water resource and its convenience for farmers. It has been well documented that SDI has many practical advantages such as crop yield improvement (Hunt et al., 2011; Park et al., 2012; Gao et al., 2014), higher water and nutrient use efficiency (Grabow et al., 2006; Gao et al., 2014) and less weed germination and growth (Grattan et al., 1990). For example, Camp (1998) reported significant increase in water use efficiency with SDI in comparison to other irrigation methods. Hunt et al. (2011) also found that SDI improved soybean yield by 28% compared to non-irrigated control plot in the United States.
Although SDI is considered to be a very efficient irrigation system, it has had relatively limited expansion due to several disadvantages such as high initial cost, the clogging of emitters and the difficulty of detecting leakages and repairing them. The cost of SDI system depends strongly on the design and the cost can be reduced by wider lateral spacing of driplines. However, wider spacing can result in lower grain yield and water use efficiency because the vertical water movement is common in coarse textured soil. The results of Enciso et al. (2005) have shown that cotton yield, seed mass and net returns were significantly greater in narrow dripline spacing (beneath every planted bed, 1 m) compared to alternate furrows (2 m) in the first two years of a three-year study. However, the study in South Carolina conducted by Camp et al. (1997) showed that no difference was found in crop yield between 1 m and 2 m dripline spacing. These conflicting results suggest that more conclusive research on the dripline placement for the SDI system is necessary to allow farmers to make an installation decision for SDI systems. Furthermore, little or no literature exists that directly discuss as related to the interaction of dripline displacement spacing and position of SDI system for field crops in Korea. Therefore, the objectives of the present study were to (1) investigate the effect of SDI system on soybean growth and grain yield; and (2) compare dripline placement of lateral spacing and position for soybean growth and water use efficiency on a sandy-loam soil.
Materials and Methods
Site Description
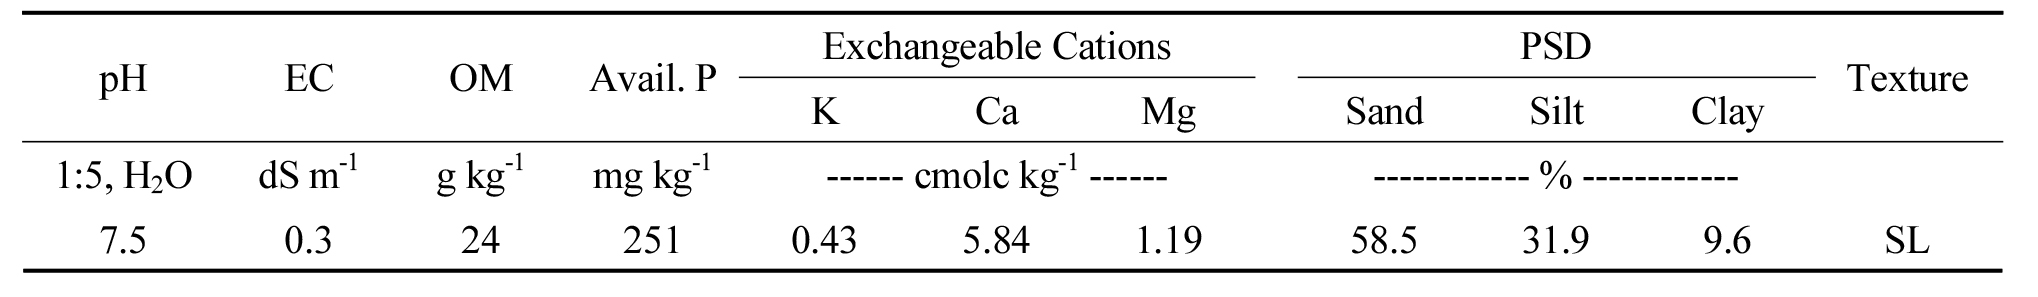
Field experiments were conducted at the experimental station of National Institute of Crop Science (35°29´N, 128°44´E) during two soybean growing seasons between 2016 and 2017. The experimental station is located in Miryang, Republic of Korea in a temperate climate zone. The annual mean temperature is 13.3oC, mean annual precipitation 1,229 mm. The soil is sandy loam with organic matter content of 24.0 g kg-1 and pH of 7.5. The physico-chemical properties of experimental soil at pre-experimental stage were shown in Table 1.
Irrigation Water Management
The field experiment consists of SDI systems with different dripline placement. Five treatments used in this study include the combination of two placement positions (under ridge or furrow) and two lateral spacing (0.7 m or 1.4 m) of dripline; 0.7 m dripline spacing installed under ridge (referred to as SDI-1), 0.7 m dripline spacing installed under furrow (SDI-2), 1.4 m dripline spacing installed under ridge (SDI-3), 1.4 m dripline spacing installed under furrow (SDI-4) and rainfed irrigated plot was used as a control (Fig. 1). Driplines (14.2 mm inside diameter) were installed at a depth of 0.3 m below ground, using an install device pulled by a tractor. The pressure compensating emitters were spacing 0.2 m apart and had a flow rate of 2.3 L h-1. Water was filtered using a disc filter with a 120-mesh screen. The applied water per plot was automatically measured using a digital flow meter. Irrigation water was supplied from a 20,000 L polyethylene tank that was automatically replenished by an irrigation pond. Irrigation water use efficiency (IWUE) was calculated from soybean grain yield and applied irrigation amounts as in Eq. 1.
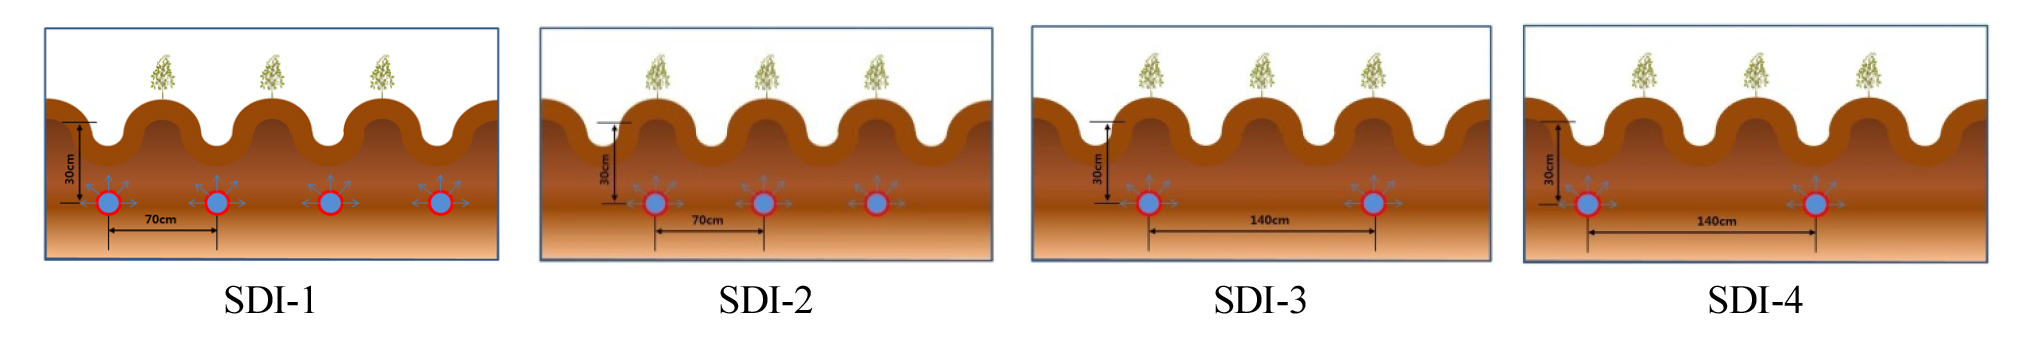
Fig. 1.
Treatments with the combination of lateral spacing (0.7 m or 1.4 m) and placement position (under ridge or furrow) of dripline for subsurface drip irrigation (SDI) system used in this study. SDI-1, 0.7 m dripline spacing installed under ridge; SDI-2, 0.7 m dripline spacing installed under furrow, SDI-3, 1.4 m dripline spacing installed under ridge; SDI-4, 1.4 m dripline spacing installed under furrow; Control, rainfed irrigated plot.
 (Eq. 1)
Where, IWUE is irrigation water use efficiency (kg m-3), YIRR and YRI are soybean yield irrigated by SDI system and rainfed, respectively (Mg ha-1), and QIRR is applied irrigation amounts (mm) as described by Bos (1980).
Crop Cultivation
Area of each plot was 323 m2 (8.5 m × 38 m) and SDI system was installed prior to sowing in 2016. Soybean variety ‘Daewon’, a good adoptability and productivity, was planted with 50 kg ha-1 seeding rate in a single row, with 0.7 m row spacing and 0.2 m interval between plants within each row. A basal 30 kg N ha-1 as urea, P at 30 kg ha-1 as calcium superphosphate, and K at 34 kg ha-1 as potassium chloride were applied for all plots. Weed control was achieved using herbicides based on the recommended practices. The field was monitored for insects and diseases and pesticides were applied to maximize the crop yield during the growing seasons as needed. Soybean have sown on June 16, 2016 and June 5, 2017 and harvested on November 4 in 2016 and October 23 in 2017, which growing days are 142 and 141, respectively.
Analysis of Soil and Plant
Volumetric soil water contents and water potentials were automatically monitored using frequency domain device (Decagon, EC-5, USA) and dielectric water potential sensor (Decagon, MPS-6, USA), respectively. Soil samples collected by a spiral auger were air-dried at room temperature for physical and chemical analysis. Soil pH and EC were determined from the 1:5 of soil/water suspension using a pH/conductivity meter (Horiba, F-54). Available phosphorus was analyzed by Lancaster method using continuous flow spectrometer (Bran+Luebbe Analytics, AutoAnalyzer 3). Exchangeable cations (K, Ca, and Mg) were extracted by 1N-NH4OAc (adjusted pH 7.0) and quantified by inductively coupled plasma spectroscopy (PerkinElmer, Optima 3300DV). In this study soil physical and chemical analysis were conducted based on the standard methods by RDA (2000).
The SPAD value, stomatal conductance and normalized difference vegetation index (NDVI) was measured using by chlorophyll meter (Konica-Minolta, SPAD-502Plus, Japan), leaf porometer (Decagon Devices Inc., SC-1, USA) and hand-held NDVI sensor (NTech Industries Inc., Greenseeker, USA), respectively, with 30 replications from each plot. Plant height, stem length and stem thickness were recorded at flowering (R1) and full seed stage (R5). At maturity, the plants from sub-plot (2.8 m2) with three replications were sampled to determine the soybean yield and yield components (i.e., the number of pods and the 100-seed weight etc.), which were oven-dried at 70oC for 72 hour and then they were ground to pass through a 0.5 mm sieve for quantitative analysis. After wet digestion with H2O2- H2SO4, filtrate solution was quantified for N, P, K, Ca and Mg. Crop evapotranspiration (ETC) was calculated by multiplying the crop coefficient (KC) by reference evapotranspiration (ETO) that was calculated from the weather information for the period of soybean development (Allen et al., 1998).
Statistical Analysis
Experimental data were statistically analyzed using analysis of variance (ANOVA) with the JMP program (SAS institute ver. 5.0, USA). Least significant difference was used to compare treatment means when the F-test was statistically significant at 95% level.
Results and Discussion
Soybean grain yield and development
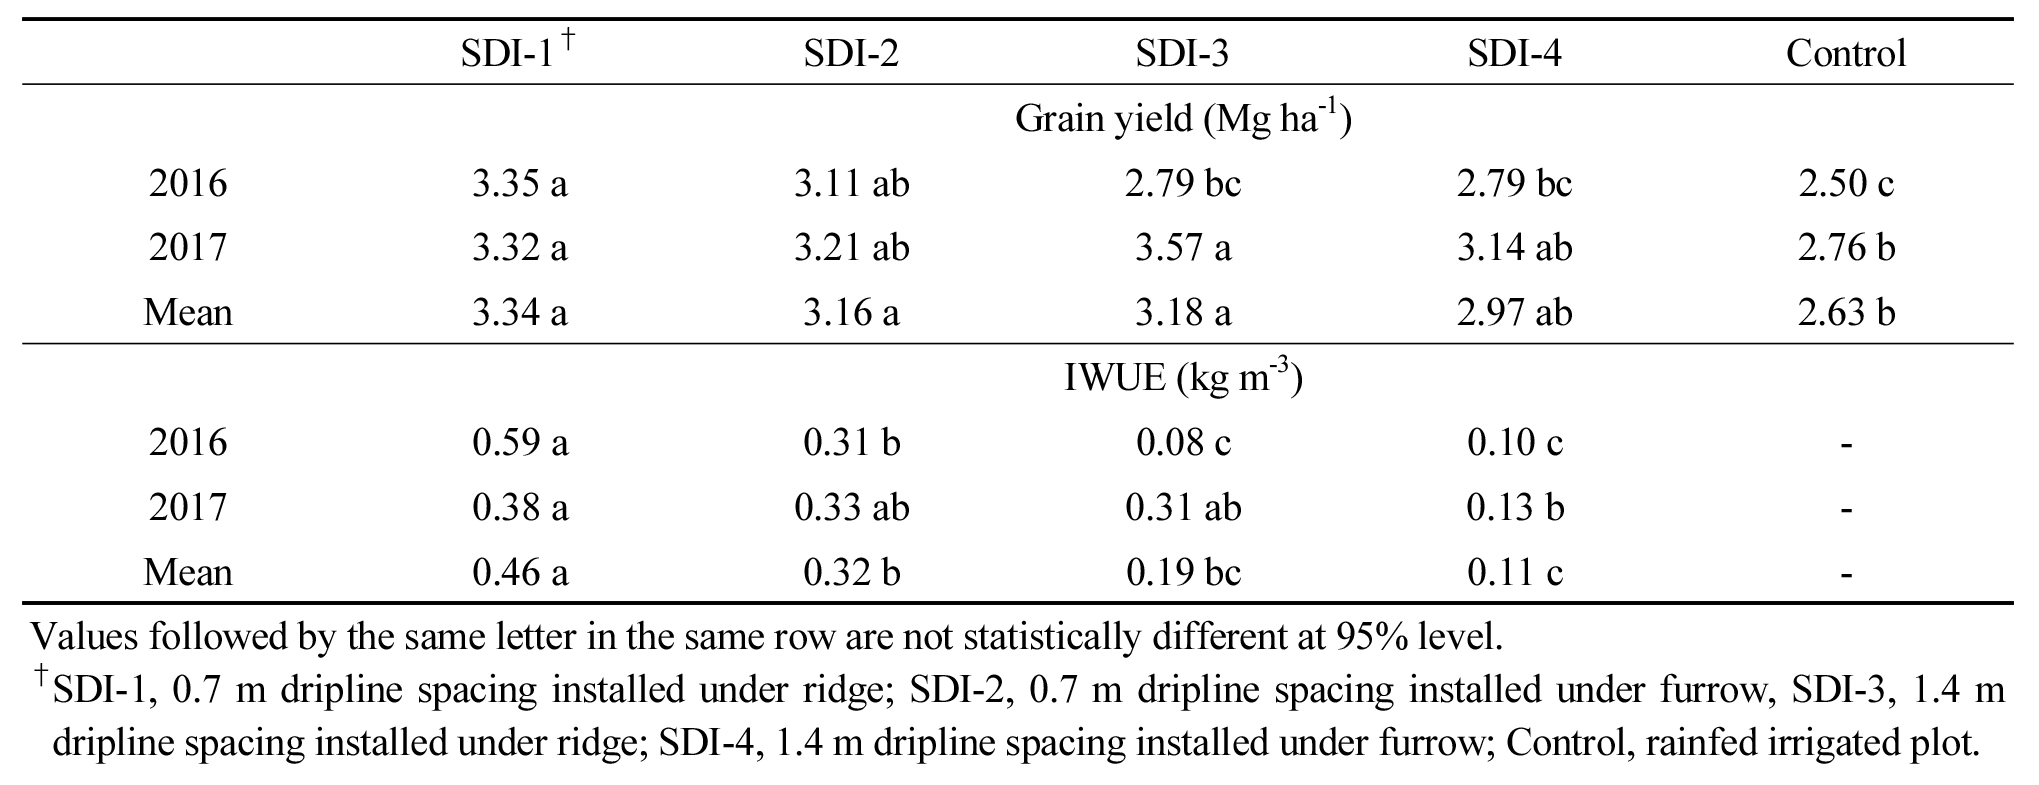
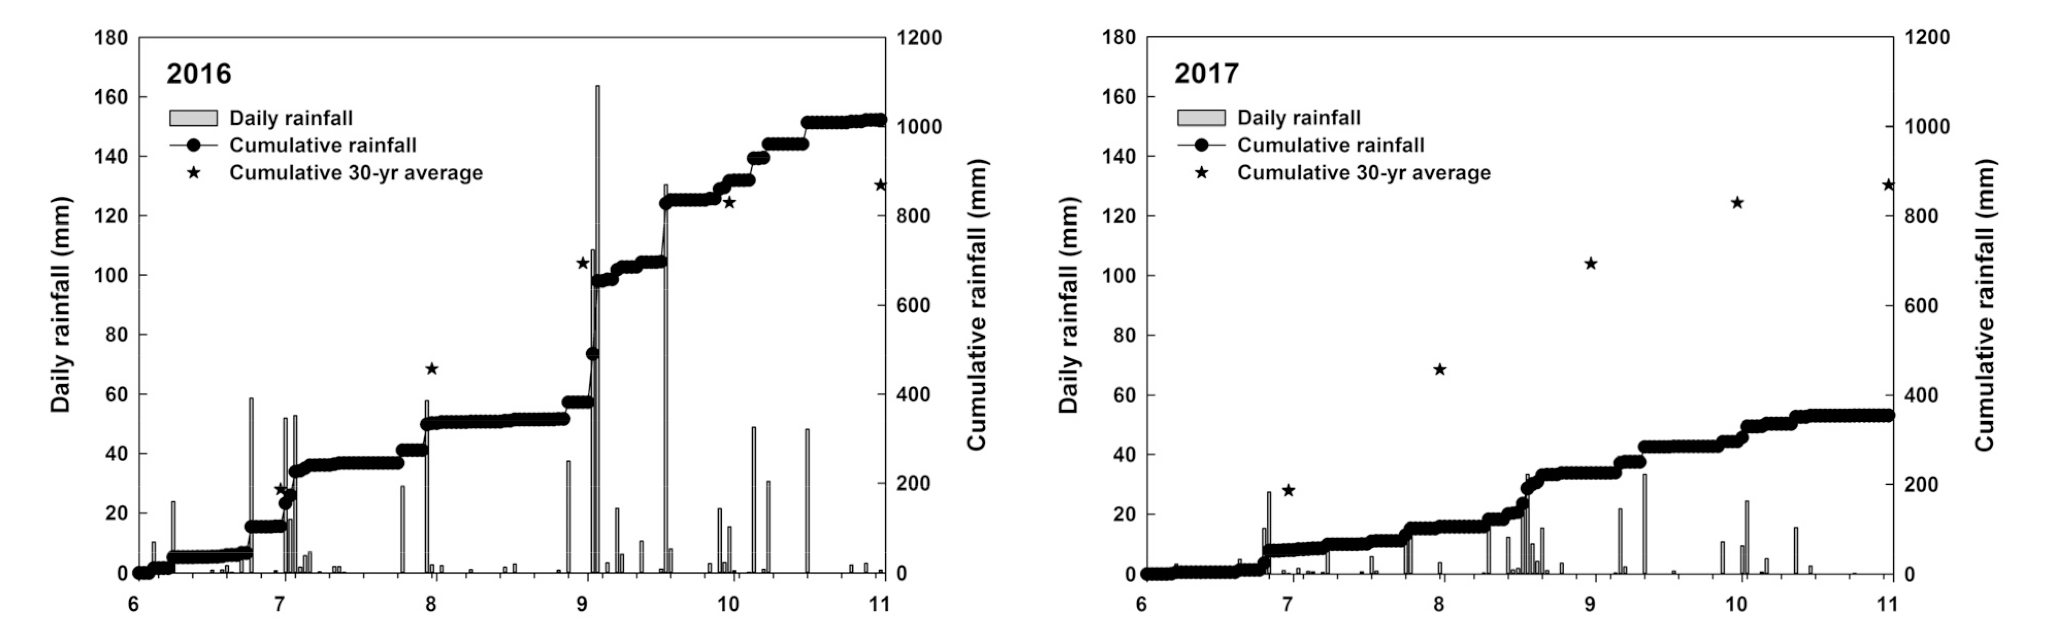
Soybean grain yield increased with subsurface drip irrigation (SDI) and varied from 2.50 Mg ha-1 for the rainfed plot to 3.35 Mg ha-1 for SDI-1 irrigated plot in 2016, and from 2.76 Mg ha-1 for the rainfed plot to 3.57 for SDI-3 irrigated treatment in 2017 (Table 2). Across growing season grain yield in SDI irrigated plots was statistically greater compared to rainfed plot. For two growing seasons, grain yield in SDI-1 plot averaged 3.34 Mg ha-1, which was 27% greater yield increase compared to the rainfed control plot (2.63 Mg ha-1). However, statistical significant (p < 0.05) yield differences were not observed among SDI treatments across growing seasons. When the SDI dripline spacing and position were compared, grain yield was greatest for 0.7 m lateral spacing installation under ridge position. However, grain yield with different dripline positions was not significant in any growing season. The only statistical difference in grain yield between the two dripline spacing was in 2016, when the grain yield in SDI plot with 0.7 m dripline spacing was 3.21 Mg ha-1 and 1.4 m dripline spacing was 2.79 Mg ha-1. Grain yield for 2017 was significantly greater than 2016. The yield increase in 2017 may be attributed to substantial well-timed rainfall events during the growing season. High rainfall generally moderates soybean yield response to irrigation. For example, Scott et al. (1987) observed irrigated yield was 1.4 Mg ha-1 greater than rainfed yield in a year receiving about 300 mm rainfall, but not in a year that received 570 mm of rainfall. In this study, more rainfall was observed in 2016 than 2017 (Fig. 2). The average yield of 3.01 Mg ha-1 for SDI irrigated plot had 20% irrigated yield benefit than rainfed plot in 2016. The same rate of yield increase was observed in 2017, even though the total rainfall amount was far less than 2016. This result indicates that soybean yield increase in response to SDI system depends not only on the total rainfall amount in growing season but also on the water balance in root zone caused by rainfall patterns.
Table 2. Grain yield and irrigation water use efficiency (IWUE) for soybean during the 2016 and 2017 growing seasons.
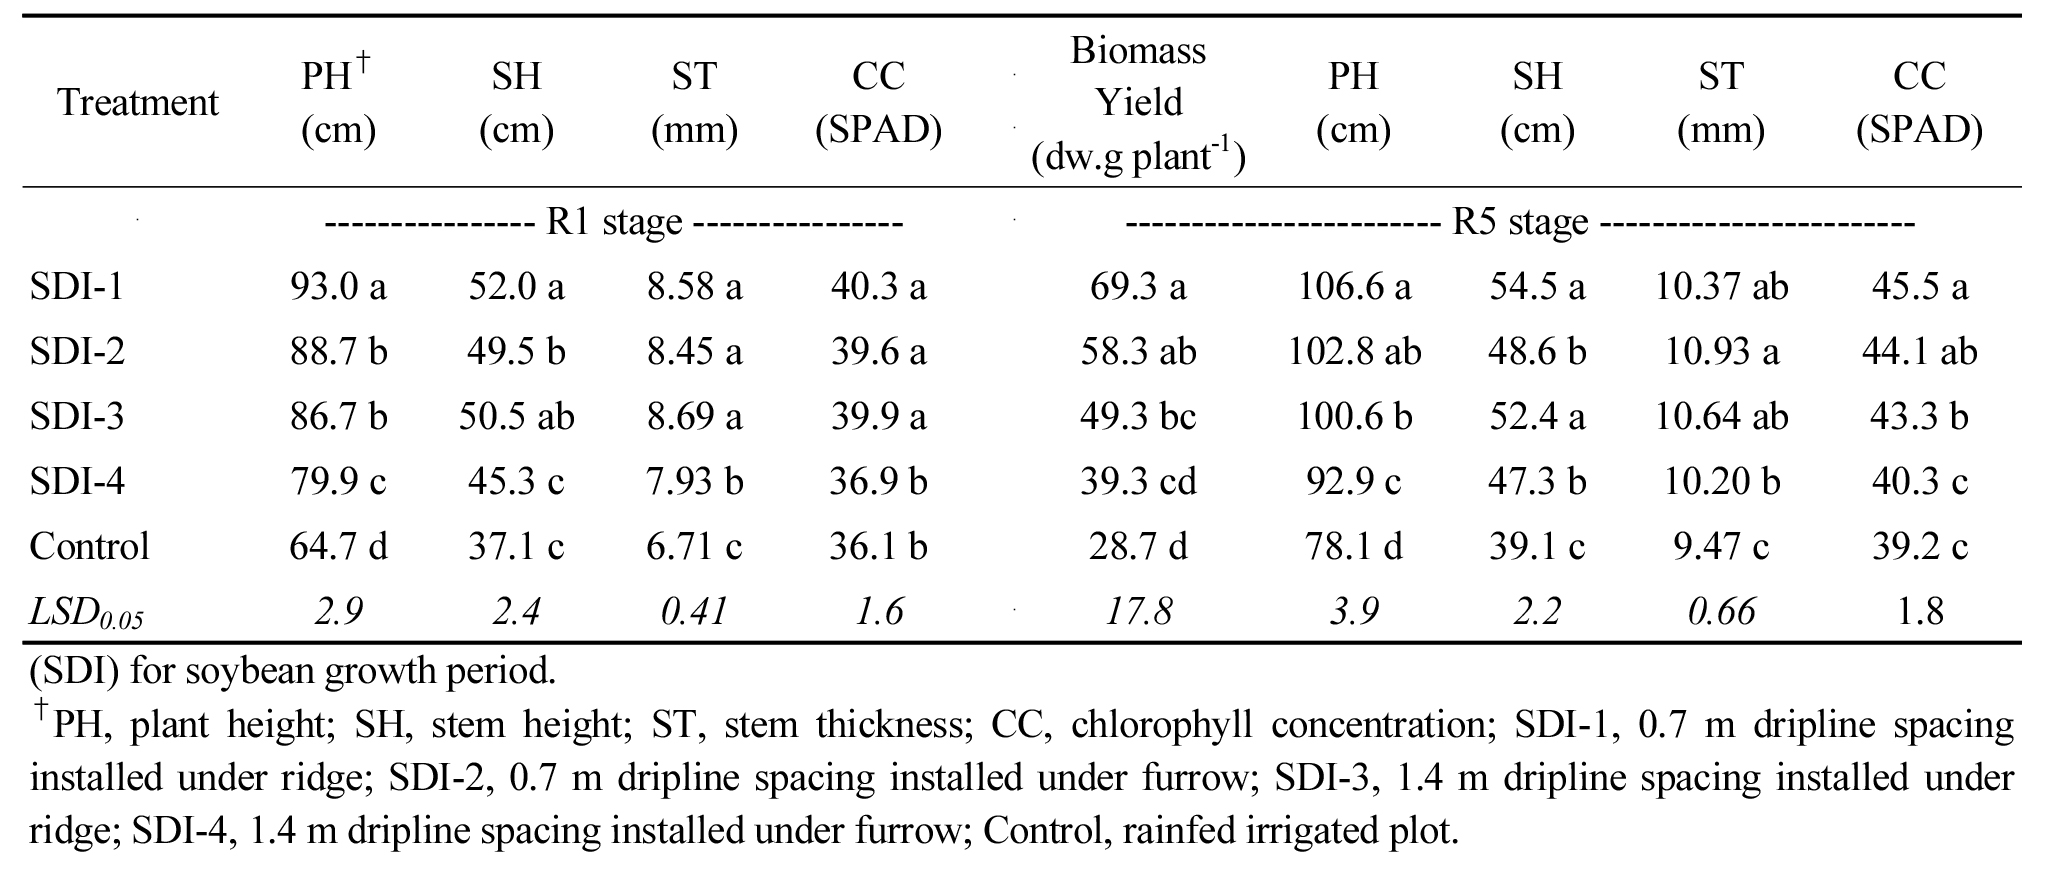
SDI system resulted in an increase in plant height, stem height, stem thickness and chlorophyll concentration in soybean leaves compared with the rainfed irrigated plot in both R1 and R5 stages (Table 3). It was probably that the higher soil moisture content by SDI system led to the better growth of soybean plants. Above-ground biomass yield with SDI irrigated plots averaged 54.1 g plant-1 at R5 stage, which was 88% greater biomass yield compared to rainfed irrigated plot. Even though soybean grain yield was not significant among SDI treatments, the soybean growth were statistically variable. This result indicates that the effect of SDI on soybean biomass growth and grain yield is different. It is well documented that limited irrigation practices has the advantage of lower above-ground biomass before flowering, greater net photosynthesis rates during grain filling, and larger grain yield. This result corroborates other findings (Irmak et al., 2014) that full season irrigation scheduling produced more vegetative soybean dry matter, but less seed grain yield was observed due to the less aeration in the crop root zone. In this study, full season irrigation was applied and further study should consider irrigation scheduling to reduce the grain yield reduction.
Normalized difference vegetation index (NDVI) value in soybean plants at R1 growth stage was significantly greater in SDI irrigated plots compared to the rainfed irrigated plot, although there was no statistical difference among SDI treatment plots (Fig. 3). This result is agreement with other researches showing a significant correlation between grain yield and NDVI since the NDVI is closely related to the photosynthetic capacity and energy absorption of plant canopies (Zhitao et al., 2014). Stomatal conductance is a measure of the degree of stomatal opening and can be used as an indicator of plant water status. In this study, stomatal conductance values in SDI irrigated plot were statistically higher than rainfed control plot, except for SDI-4 irrigated plot, indicating that soybean plants had some stomatal closure due to the lower soil water availability in these plots.
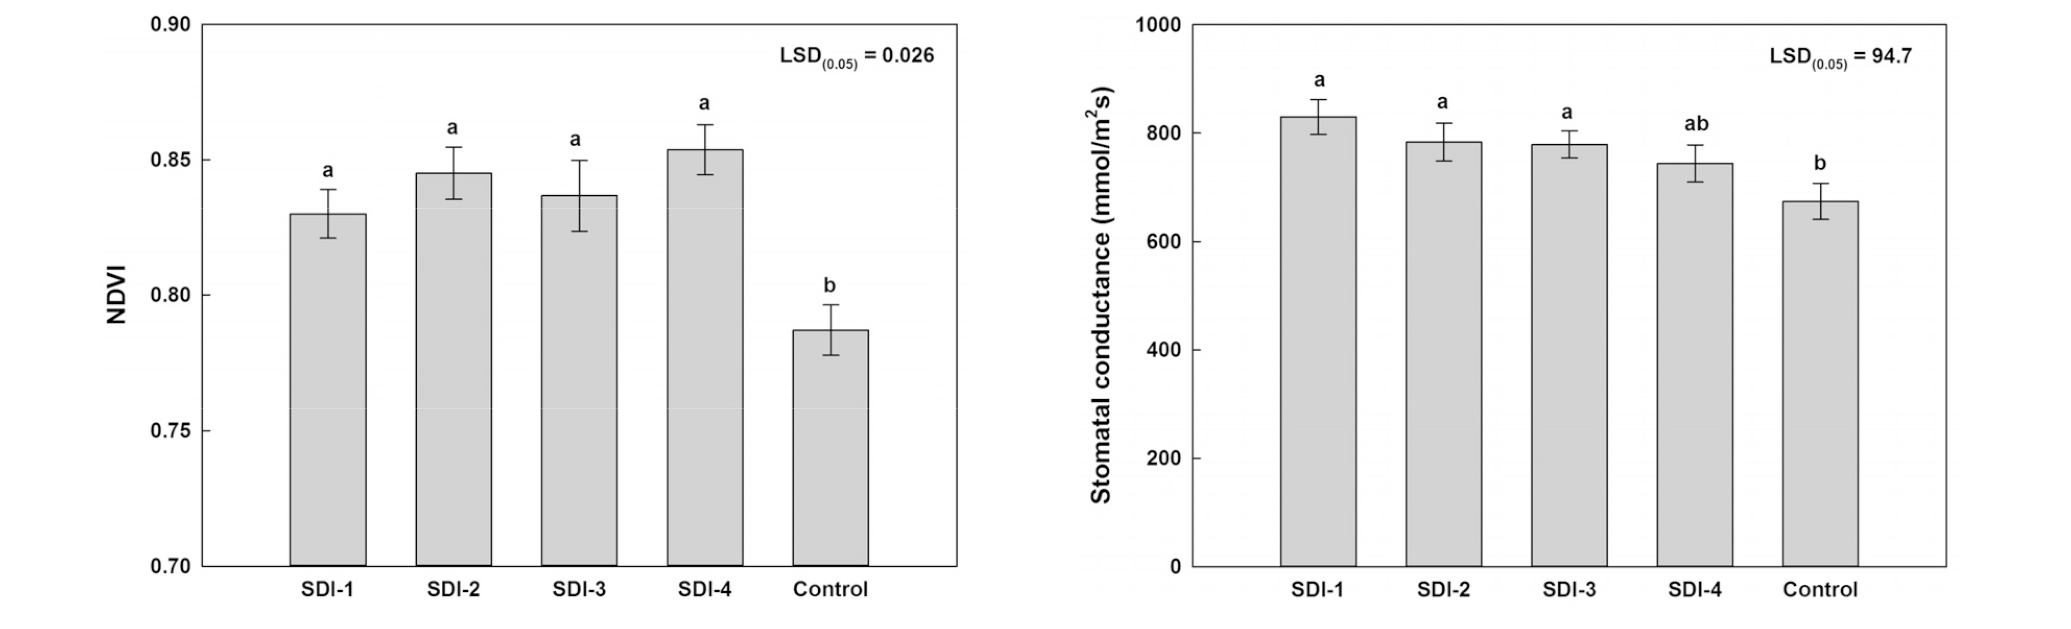
Fig. 3.
Normalized difference vegetation index (NDVI) and stomatal conductance values in response to subsurface drip irrigation (SDI) at R1 stage in 2016. SDI-1, 0.7 m dripline spacing installed under ridge; SDI-2, 0.7 m dripline spacing installed under furrow, SDI-3, 1.4 m dripline spacing installed under ridge; SDI-4, 1.4 m dripline spacing installed under furrow; Control, rainfed irrigated plot.
Irrigation water use efficiency
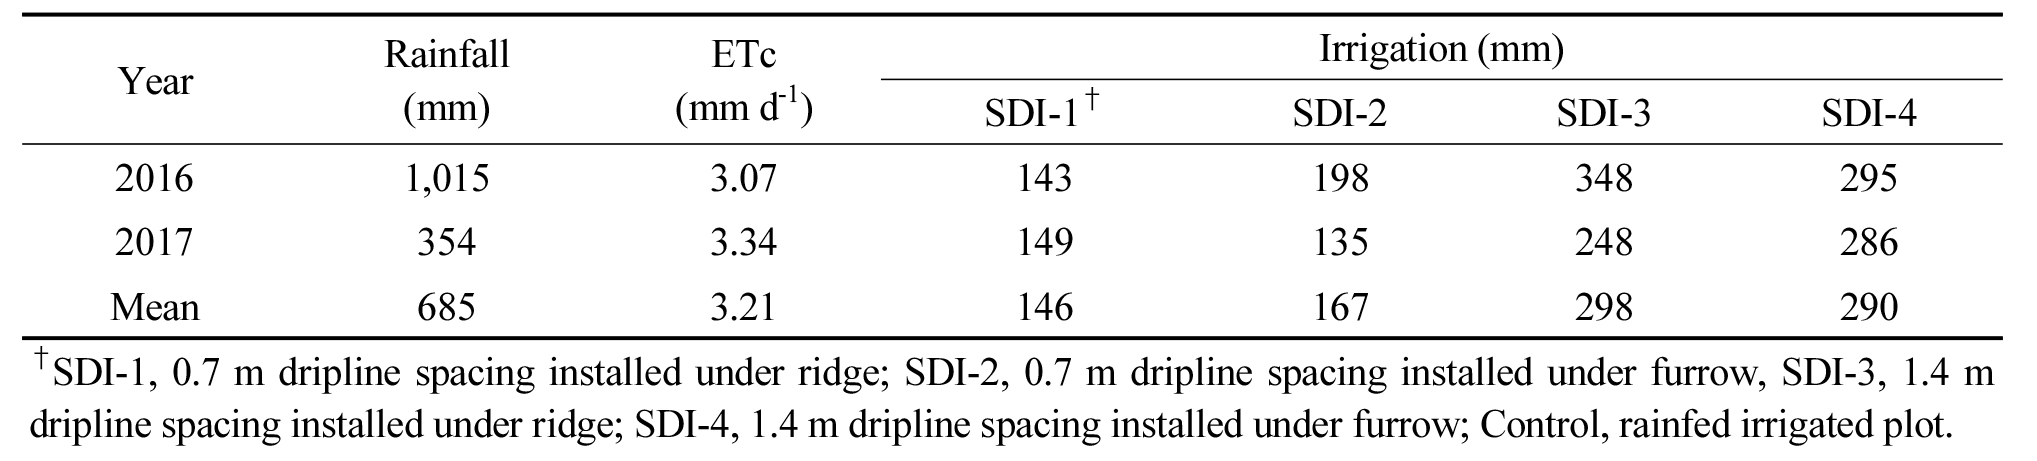
The amount of irrigation water applied may be directly influenced on irrigation water use efficiency (IWUE). Especially the use of SDI system on coarse textured soils that plant water supply strongly depends on capillary rise which may be limited on these soils. The IWUE was the greatest for SDI-1 irrigated plot than other irrigated plots in both growing seasons, although as with grain yield there was no statistical difference among irrigated plots over all years (Table 2). An interaction effect of IWUE existed between growing season and dripline installation. When comparing the dripline position, IWUE in plots installed under ridge was 0.33 kg m-3, and the plots installed under furrow had a lower IWUE value (0.22 kg m-3) due to the high irrigation rates applied, and also due to the lower grain yield. The IWUE was linearly increased (R2 = 0.5142) with increasing soybean grain yield across all growing seasons. In regards to dripline spacing, IWUE for 0.7 m dripline spacing plots averaged 0.39 kg m-3, which is 1.6-times greater than for 1.4 m spacing plots. IWUE for 1.4 m dripline spacing plot was relatively low due to inefficient use of the stored soil water. IWUE in 2017 averaged 0.29 kg m-3, which is 7.8% greater than 2016. This result is directly related to the irrigation amounts, as 2016 was received more water (246 mm) than for 2017 (205 mm) (Table 4). Seasonal and annual precipitation at the research site was substantively variable in both magnitude and timing (Fig. 2). Total seasonal rainfall during the soybean growth period was 1,015 mm in 2016 that is close to the 30-year precipitation pattern, but 354 mm precipitation in 2017 was much smaller than 30-year average. Even though the total rainfall amount was greater in 2016, rainfall event were evenly distributed in 2017, resulting in a higher IWUE in 2017. Results of this study suggest that wide spacing (1.4 m) of dripline is probably the more economical installation design for SDI system in this study soil compared to 0.7 m spacing because the initial cost for dripline may be reduced with wide spacing design, even though the IWUE is greater with 0.7 m spacing design.
Table 4. Rainfall, Evapotranspiration (ETc), and gross irrigation amounts in response to subsurface drip irrigation (SDI) for soybean growth period.
Soil water content and water potential
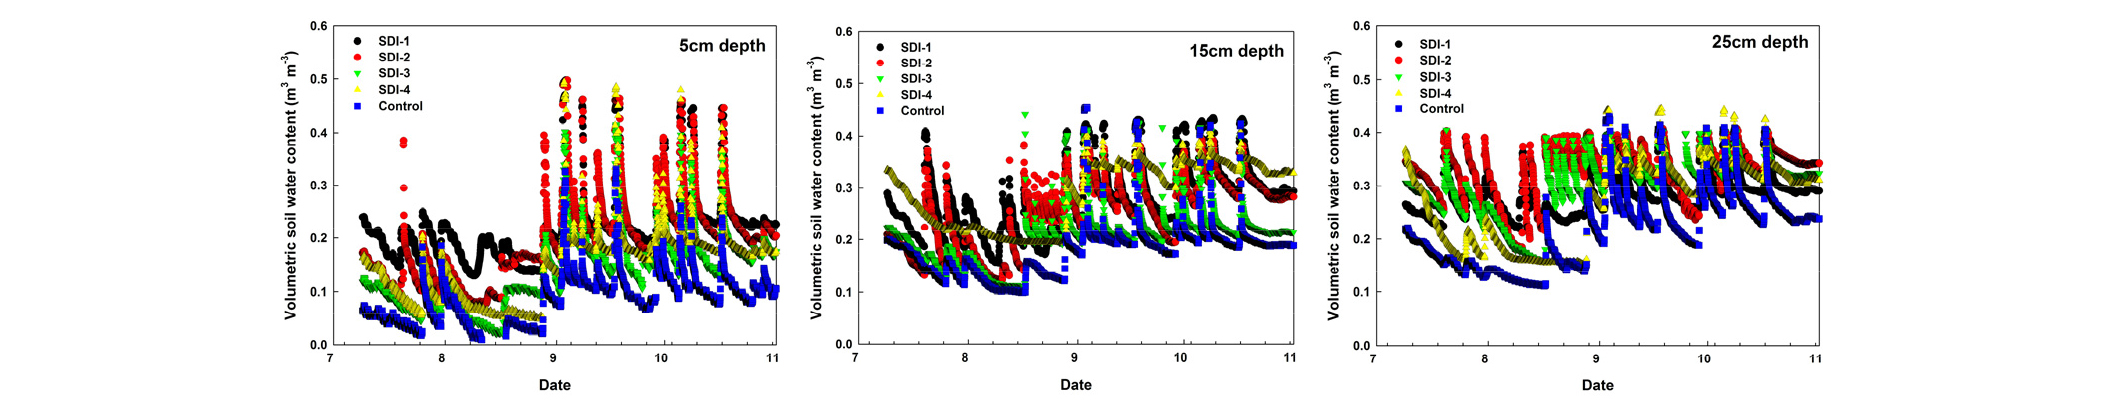
Temporal changes in volumetric soil water content at top 5, 15, and 25 cm layers in response to each of the SDI treatments were shown in Fig. 4. As expected, soil water contents were influenced by irrigation and rainfall events and the fluctuation was greatest in 5 cm depth layer. Soil water content in SDI irrigated plots averaged 0.17 m3 m-3 at 5 cm layer over the course of investigation period. However, soil water content in rainfed irrigated plot showed a lower value of 0.09 m3 m-3 for the same period. The water content gap between SDI and rainfed irrigated plot was greatest in 5 cm layer, which was decreased with increasing soil depths. The greatest soil water depletion occurred in the 5 cm depth layer, indicating that active root water uptake and soil surface evaporation was greatest in surface layer. Soil water content in rainfed irrigated plot recorded only 40% smaller at 25 cm depth layer. Soil water depletion at 25 cm depth layer did not seem to be much affected by rainfall events. When comparing dripline spacing, average soil water content in plots with 0.7 m spacing was 0.21 m3 m-3, which was 45% greater compared to the plots with 1.4 m spacing, even though the gross irrigation amounts were greater in 1.4 m spacing plots (Table 4).
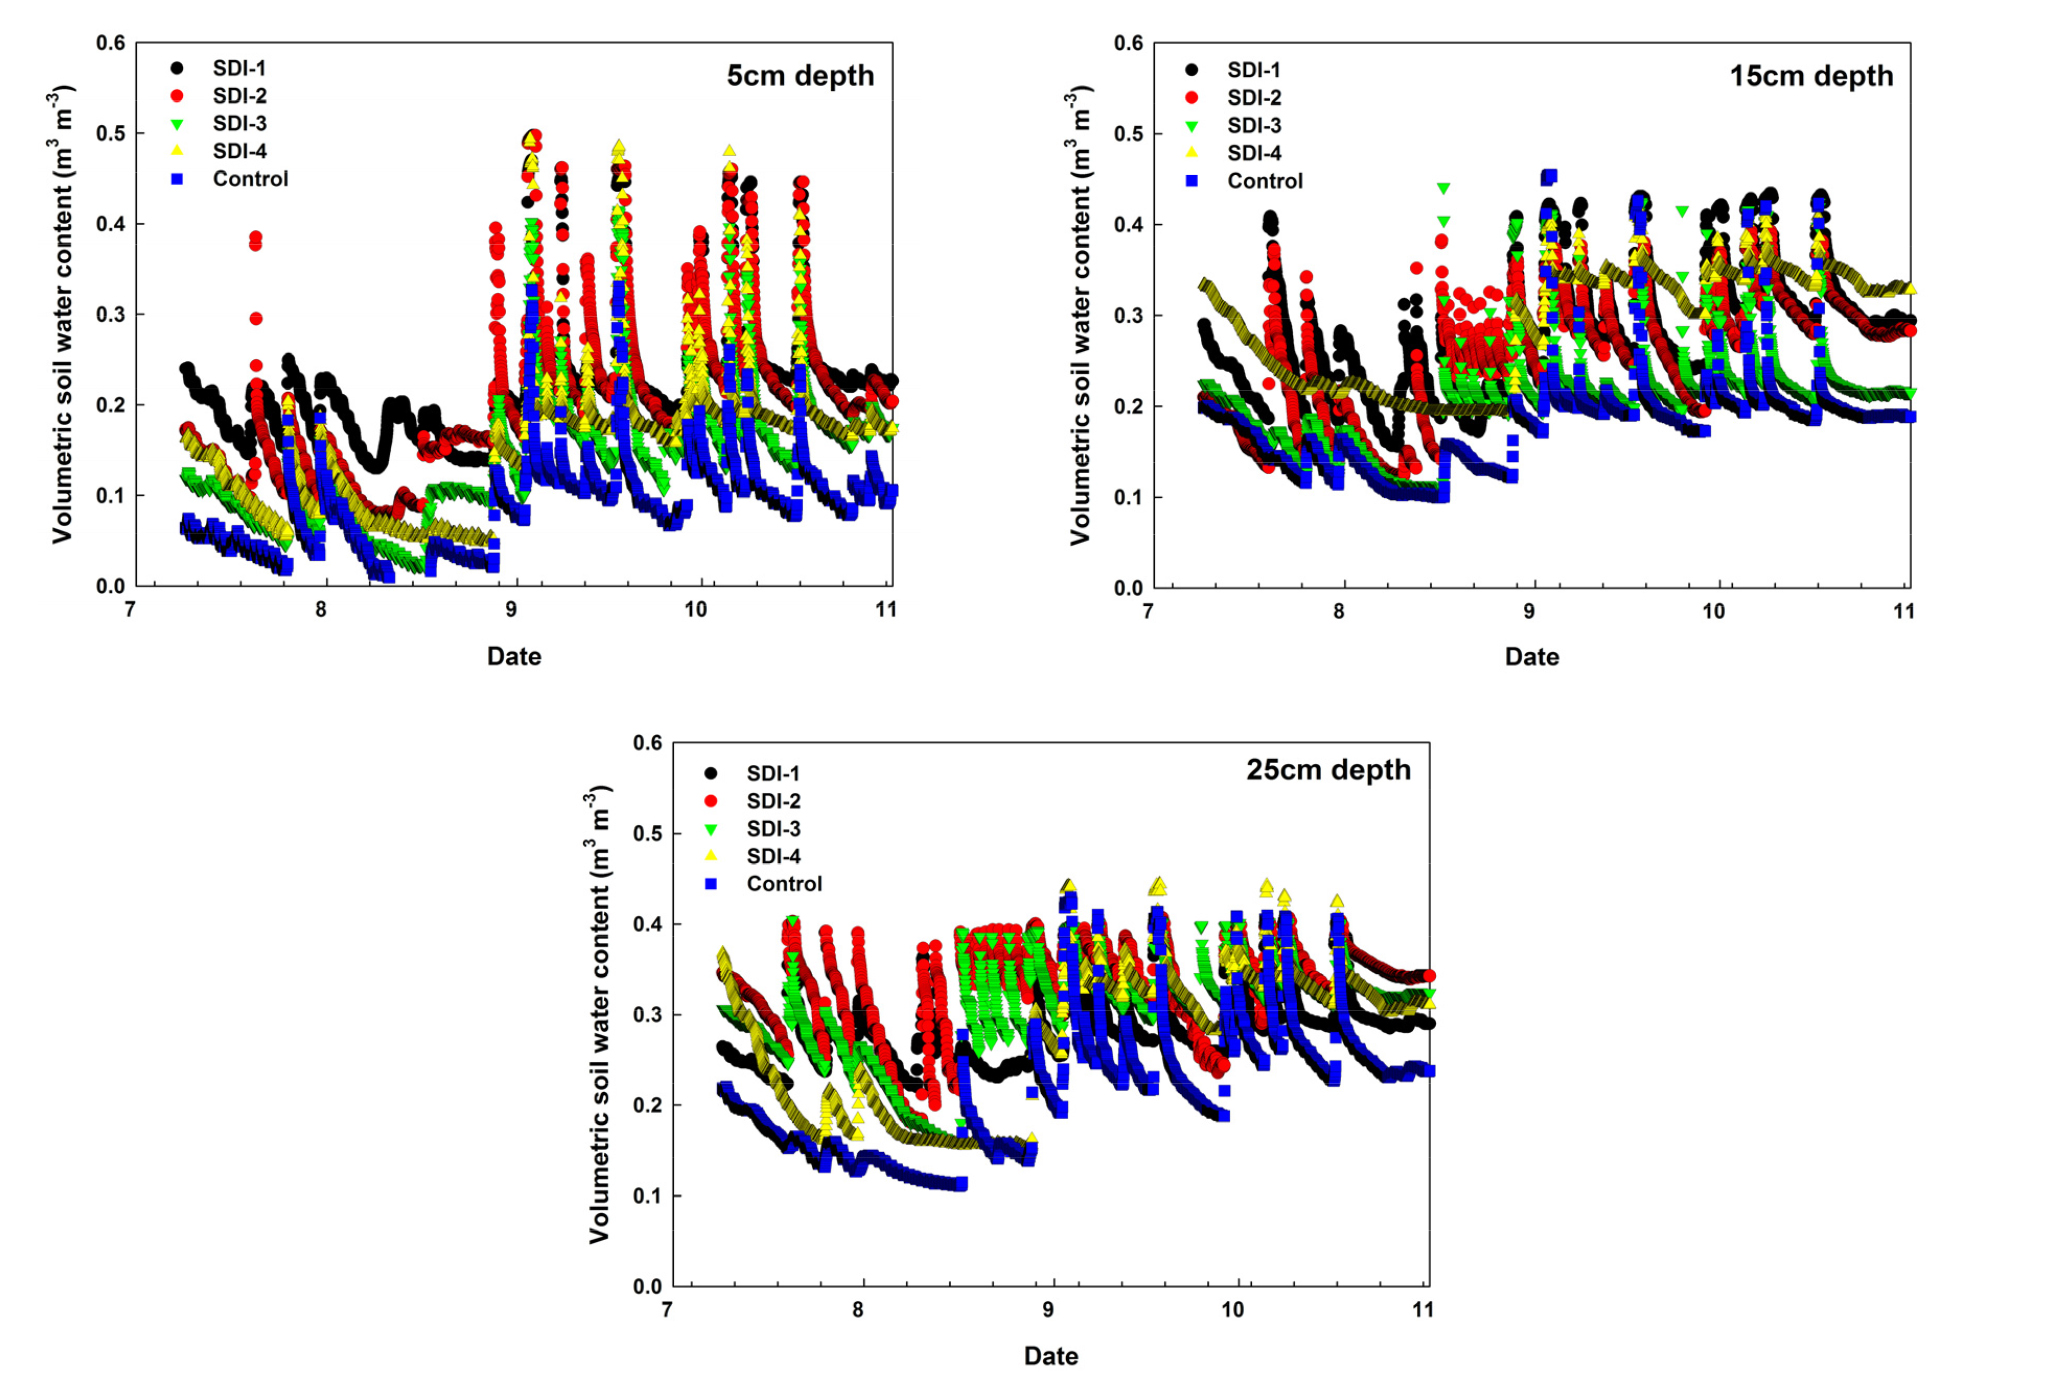
Fig. 4.
Volumetric soil water content at 5, 15, 25 cm depths in response to subsurface drip irrigation (SDI) for 2016 soybean growth period. SDI-1, 0.7 m dripline spacing installed under ridge; SDI-2, 0.7 m dripline spacing installed under furrow, SDI-3, 1.4 m dripline spacing installed under ridge; SDI-4, 1.4 m dripline spacing installed under furrow; Control, rainfed irrigated plot.
As mentioned earlier, the gross rainfall amount was far greater in 2016 than 2017, but it was recorded long time drought period (118 mm for 55 days between July 3 and August 27) in 2016. During this period, soil water contents in the 5 cm depth layer reached a low of the detection limit for rainfed irrigated plot, but SDI irrigated plot showed relatively higher soil water content (Fig. 4). Soil water contents were increased in all treatments after a heavy (108 mm) rainfall event that occurred on September 2, 2016. Soil water potential is closely related with plant water uptake and crop water stress (Bianchi et al., 2017) and seasonal changes in soil water potential at top soil layer showed in Fig. 5. In this study, soil water potential fluctuated according to soil water contents by irrigation and rainfall events in both years. The SDI plots averaged -410 kPa of soil water potential in 2016, but the value was decreased to -907 kPa in rainfed irrigated plot, indicating that the plants had more water stress. When comparing between growing season 2016 and 2017, soil water potential in 2016 had the smaller value (more negative) than 2017. Water stress reduced the soil water potential at both vegetative and anthesis stages. However, the magnitude and period in lower soil water potential was much greater in 2016 because the magnitude of water stress is much higher at anthesis than at vegetative stage, showing that crop stress is much greater in 2016 compared to 2017.
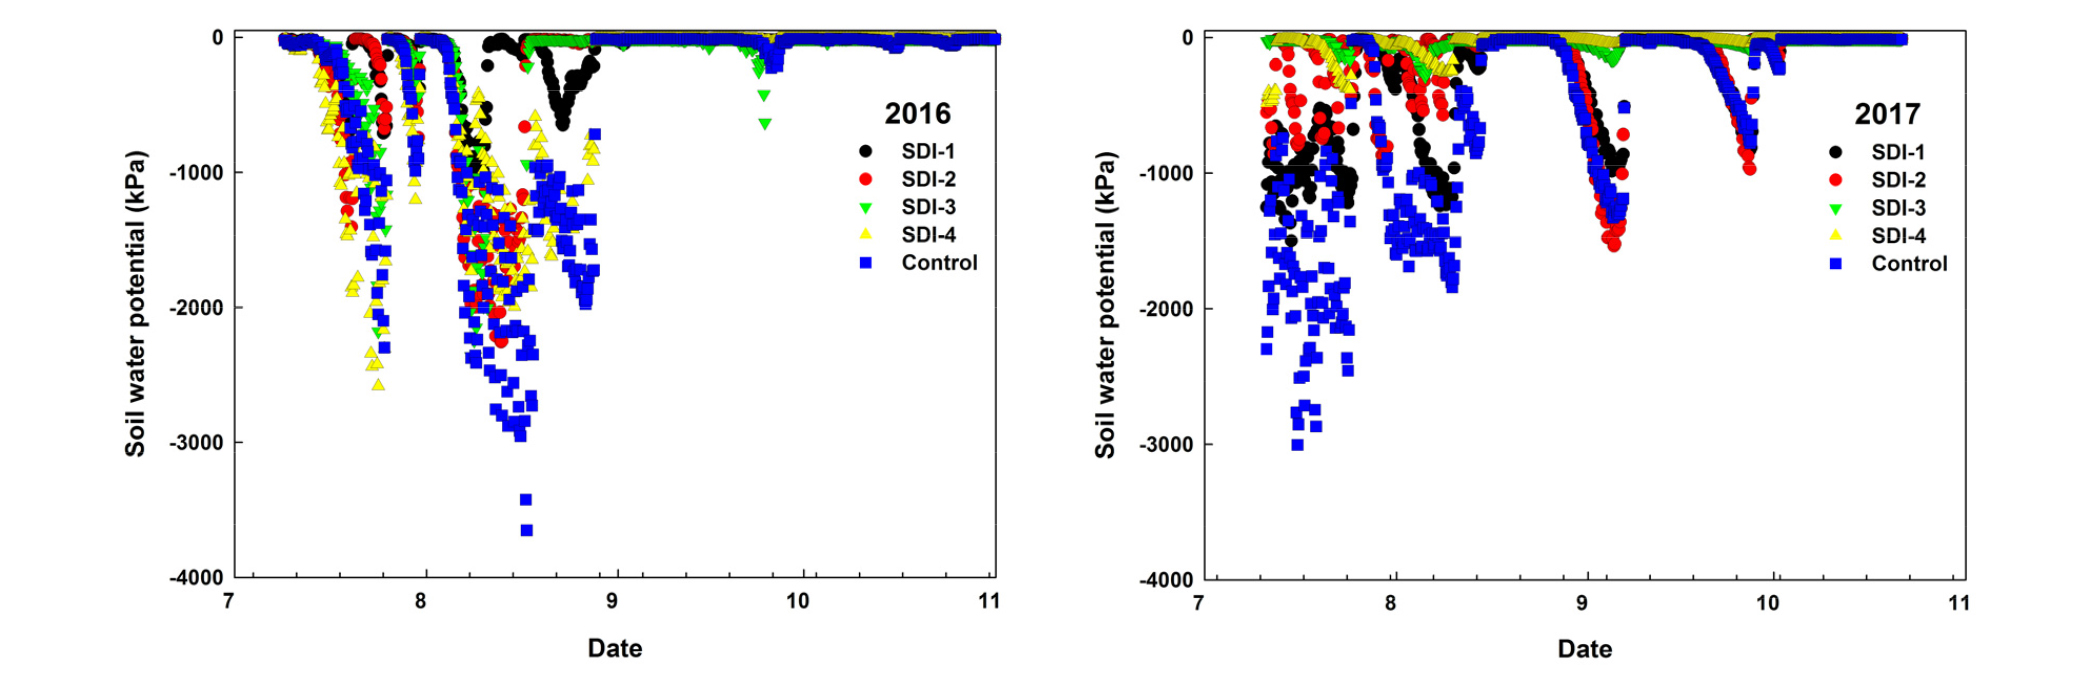
Fig. 5.
Seasonal changes of soil water potential in top soil (0-10 cm depth) during the 2016 and 2017 growing seasons. SDI-1, 0.7 m dripline spacing installed under ridge; SDI-2, 0.7 m dripline spacing installed under furrow, SDI-3, 1.4 m dripline spacing installed under ridge; SDI-4, 1.4 m dripline spacing installed under furrow; Control, rainfed irrigated plot.
Conclusion
In a sandy-loam soil, soil water contents and water potentials were influenced by the dripline placements of subsurface drip irrigation (SDI) system, but the effect of dripline spacing is more distinct than the dripline position. Soybean grain yield was not significant by the dripline placement, but the irrigation water use efficiency was greater with 0.7 m dripline spacing than 1.4 m spacing. As the results of this study, it is concluded that wide dripline spacing (1.4 m) is probably the more economical installation design for SDI system compared to 0.7 m spacing due to the reduction of initial installation cost with wide spacing design.
