

Introduction
Materials and Methods
Soil and plant samples
Anion concentrations and EC
Statistical analysis
Results and Discussion
Distribution characteristic of anions in soil and plant extracts
Correlations between anions in soil and plant extracts
Characterization of anion compositions in soil and plant extracts
Conclusions
Introduction
In croplands, plants must be supplied with dozens of mineral nutrients from the soil in addition to C, H, and O, which can be mostly provided from air and water. Among the known 17 essential elements, N, S, P, K, Ca, and Mg are required in relatively large amounts compared with other nutrients (Havlin et al., 2005). While those macronutrients can be taken up by plants either as cationic or anionic forms (Brady and Weil, 2010), all the nonmetal elements (N, S, and P) are absorbed as anions (NO3-, SO42-, and H1,2PO42-,1-, respectively). Although NH4+ and amino acids can also be taken up by plants as the major N forms (e.g., in rice paddies), plant preference for N forms is known to depend largely on the concentrations of N species in the soil solution (Warren, 2009). In aerobic soils, the content of NO3- is generally higher than that of NH4+ due to nitrification. In addition, Cl, which is the only nonmental element among the micronutrients and taken up as its anionic form, generally shows higher plant contents than other micronutrients (Havlin et al., 2005). Therefore, characterization of anionic composition of the soil solution can provide a useful tool to manage soil fertility and to assess soil quality. However, in comparison with the cationic macronutrients (K+, Ca2+, and Mg2+), the anionic species have been less studied. The major metal ions can be commonly measured simultaneously by ICP-OES (including Na+). For determination of anionic species, easiness of analysis, speed, and high-throughput implementation appear to be the major barrier to extensive investigation of anionic compositions of soil solutions or extracts.
Plant analysis of key elements is also important to quantify the amounts of nutrients incorporated eventually into plant compartments regardless of the soil’s capacity to supply nutrients. Both in-season and post-season sampling and analysis can be conducted for determination of N, P, S, and the macro metallic elements in the whole plant body or specific compartments. This total analysis has been the most frequently used method to evaluate nutrient use efficiency and to detect any nutritional deficiency or excess (e.g., Cho et al., 2021). However, it requires a long time and laborious efforts for drying, homogenizing, and digesting the samples chemically. Especially, prior to instrumental analyses, diverse chemical oxidation procedures are often required specifically for N, P, S, and metal ions (NIAST, 2000). On the other hand, fresh tissue tests or cell sap tests offer a rapid and convenient assessment of the nutritional status of the plant (Davis, 1995). In those methods, fresh tissue samples (mostly the leaf or petiole parts) are chopped, crushed or homogenized, and extracted with water or reagents specific for each nutrient (Westcott et al., 1993; He et al., 1998). Compared with the total analysis method, which accounts mainly for a long-term integrated accumulation of nutrients, the fresh tissue or cell tests can have advantages of reflecting relatively recent or readily available nutrient contents in the plant compartment. In addition, when commercial plant tissue test kits (strips or ion-selective electrodes) are used, semiquantitative assessment of nutrient status can be done easily on the site (Taber and Lawson, 2007; Kim et al., 2018).
Anions are subjected to much weaker ion exchange equilibria between the soil matrix and solution phases than cations, since most of the surfaces of the soil minerals and organic matter are negatively charged. Likewise, anions in plant tissue can be readily extracted with water. Therefore, the water-extracted anion concentrations can be useful proxies for their total or available contents in both soils and plants (Westcott et al., 1993; Lim et al., 2001). The objectives of the study were, (1) to investigate compositions of major inorganic anions (NO3-, H1,2PO42-,1-, Cl-, and SO42-) in water extracts of both soils and plants obtained from various farmlands (19 different crops; 5 monocots, 4 tree dicots, and 10 non-tree dicots), (2) to examine correlations among anionic species and between soil and plant concentration, (3) and to identify compositional characteristics of anions in soil and plant extracts using a multivariate factor analysis method.
Materials and Methods
Soil and plant samples
To cover a wide range of soils and plant species, the soil and plant samples were collected from 19 farmlands (5 monocots, 4 tree dicots, and 10 non-tree dicots) across Chungcheong and Gyeonggi provinces, South Korea in 2020. The monocot crops were corn (Zea mays), chives (Allium schoenoprasum), rice (Oriza sativa), sudangrass (Sorghum bicolor L.), and bracken (Pteridium aquilinum L.). The tree dicot species were apple (Malus pumila MiLL), grape (Vitis labruscana L.), peach (Prunus persica L.), and pear (Pyrus pyrifolia N.). And, the non-tree dicot crops were lettuce (Brassica oleracea L.), pepper (Capsicumannum L.), balloon flower (Platycodon grandiflorum A.), bean (Phaseolus vulgaris L.), cabbage (Brassica campestris L.), pumpkin (C. moschata Duch), sunflower (Helianthus annuus L.), sweet potato (Iponoea batatas L.), tobacco (Nicotiana tabacum L.), and tomato (Lycopersicon esculentum).
In the field, the top 0 - 20 cm soils were collected at three different locations and combined into a composite sample. The soils were air dried, sieved to pass a 2-mm screen, and then extracted with deionized water (1:5, w:v) by shaking at 180 rpm for 1 hr. The clear supernatants obtained through centrifugation (8,000 g, 10 min) were analyzed for their anionic compositions and electrical conductivities (EC). For plant samples, multiple (3 to 10) leaves were taken from at least seven individual plants or (hills) to represent the plant species. Those leaf samples were immediately returned to laboratory, washed with tap water first and then with deionized water, and wiped out to remove remaining water with Airpocket wipers (laboratory cellulose towel, Kimberly). Then, the leaves were briefly chopped and mixed together. Next, approximately 1 g of the fresh leaves were thoroughly homogenized with a spinning tissue homogenizer (HG-15A, Daihan, Korea) after adding deionized water at a ratio of 1:20. Next, the supernatants obtained by centrifugation (15,000 g, 10 min) were further filtrated through a 0.45-mm nylon membrane filter. The obtained clear solutions were analyzed for their anionic compositions and EC.
Anion concentrations and EC
The nitrate concentrations in soil and plant extracts were determined by the salicylic acid nitration method (Cataldo et al., 1975). The ascorbic acid molybdate colorimetry (Kuo, 1996) was used to measure the concentrations of orthophosphates. To determine the concentrations of chloride and sulfate, we followed the EC difference method of Lee et al. (2017) that utilizes the quantitative relationships between chloride (or sulfate) concentrations and EC reductions upon AgCl (or BaSO4) precipitation. The nitrite concentrations were also measured by the Griess-Ilosvay method (Mulvaney, 1996). However, since their concentrations were quite low in both soil and plant extracts, they were not used in this study. The EC of the extract was determined with a 4-pole EC meter (Orion 4 star, Thermo Co, USA) at a reference temperature of 25°C (Rhoades, 1996).
Statistical analysis
The Pearson correlation coefficients were evaluated to find apparent direct associations between the major ionogenic anions (along with EC) in the soil extracts, plant extracts, and soil vs. plant concentrations. In addition, the principal component analysis (PCA) was conducted to characterize anionic compositions of each soil extract and plant extract. All the statistical analyses were conducted using SAS 9.4 (SAS Institute INC, NC, USA).
Results and Discussion
Distribution characteristic of anions in soil and plant extracts
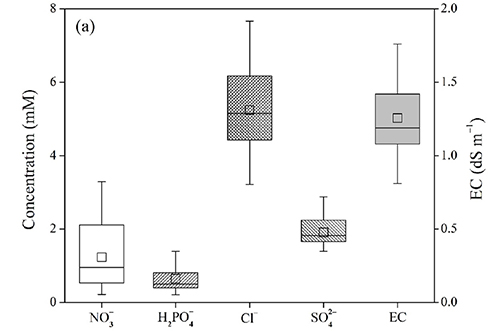
The examined 19 soils showed wide variations in concentrations of each anion (Fig. 1a). Especially, NO3- was most variable and followed by Cl-, SO42-, and H2PO4- (when the solution’s pH is below 7.2, H2PO4- is the dominant species. However, the median values were similar for NO3-, H2PO4-, and SO42- (about 0.15 mM). In contrast, the median concentration was almost double for Cl- (0.3 mM), suggesting that Cl- may occupy much more than other anions in the soil solution. Fig. 1b depicts distributions of the relative proportions of each anion in the soil extracts. Both NO3- and Cl- accounted for 80% at maximum, and their mean and median proportions were also similar (30% and 25%, respectively). The proportions of SO42- and H2PO4- were generally smaller than 25%, but in several soil extracts, they exceeded 90% and 60%, respectively. Therefore, despite the general trends, the anionic compositions are considered to be inherent characteristics of each soil and can vary to a large extent.
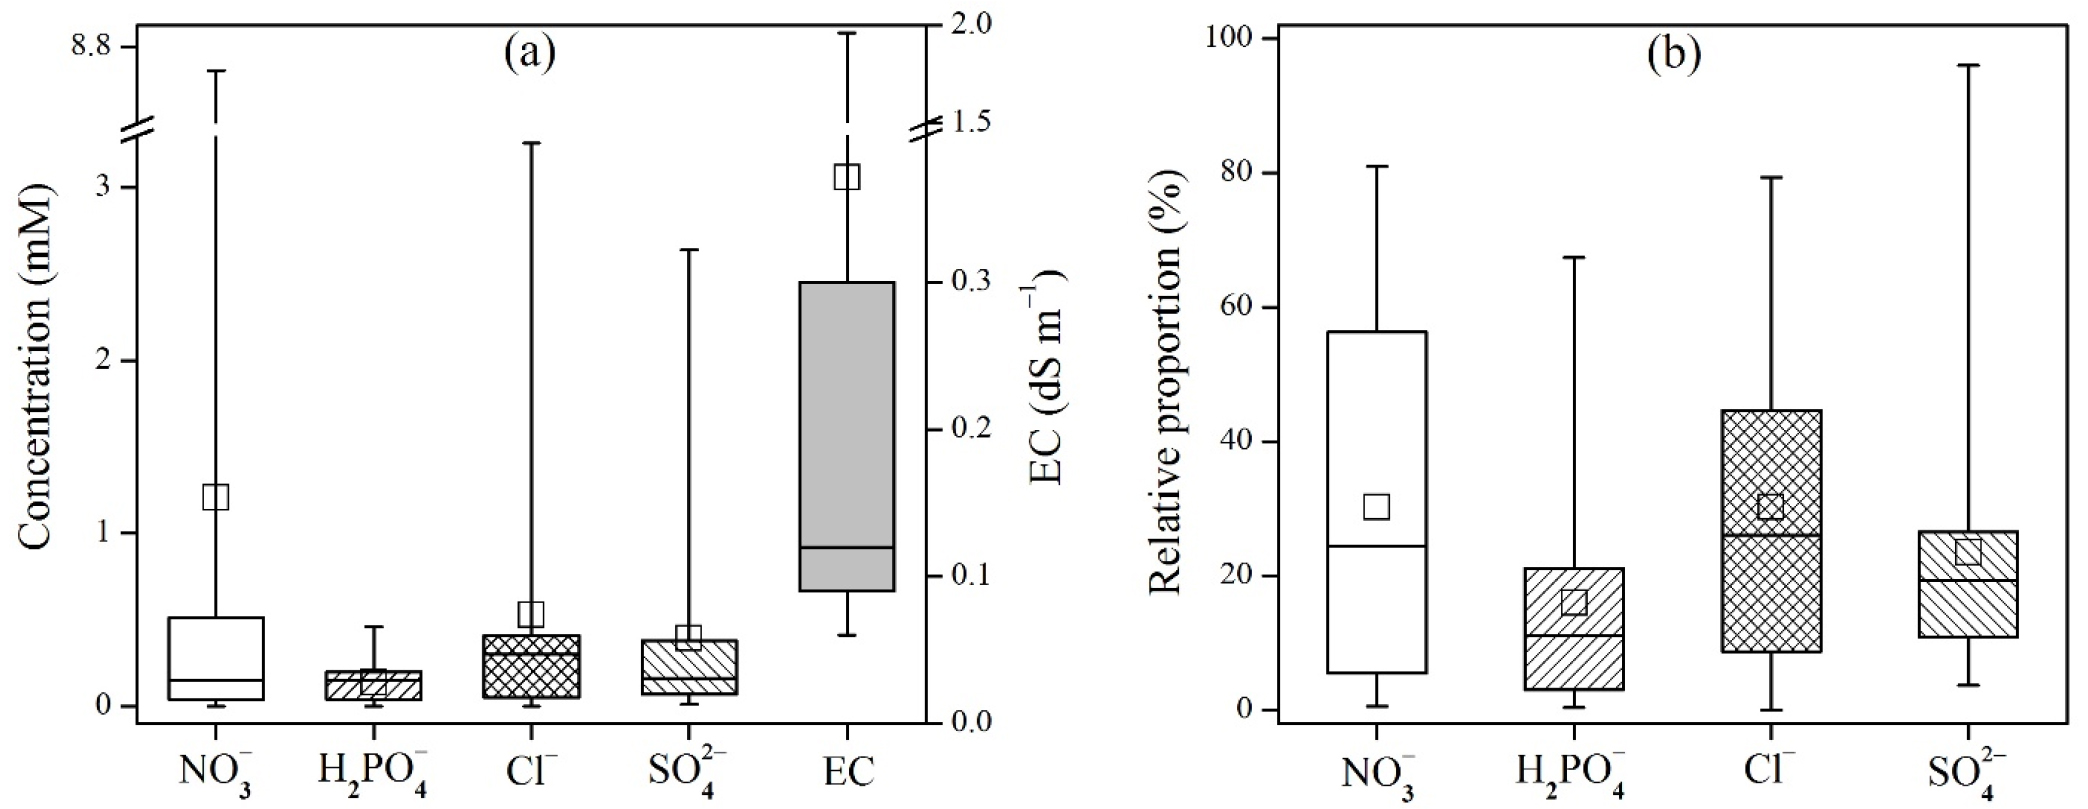
Fig. 1.
Distribution of major inorganic anions in soil extracts (1:5 H2O): (a) concentrations, (b) relative proportions in percentage. The soil extracts were obtained from 19 farmlands (5 monocots, 4 tree dicots, and 10 non-tree dicots). Electrical conductivities were measured for the identical soil extracts.
On the other hand, the leaf-extract concentrations of each anion showed clearly different distributions from those for soil extracts (Fig. 2). The concentrations and relative proportions of Cl- were predominantly higher than other anions. The degree of variation of NO3- was similar to that of Cl-, but its concentrations and proportions were considerably smaller than SO42-. The concentrations, proportions, and degree of variation of H2PO4- were consistently most low in both soil and plant extracts. Therefore, if some high degree of uncertainty is allowed (e.g., taking only the first to the third quartile of the distribution into account), the proportions of each anion in various plant leaf extracts can be estimated to be 5 - 10% (H2PO4-), 6 - 18% (NO3-), 17 - 24% (SO42-), and 54 - 65% (Cl-). However, it has been well documented that the uptake, tolerance, and tissue concentration of an anion is highly variable depending on plant species (Storey, 1995; White and Broadley, 2001). Therefore, the relative proportions of anions mentioned above are hard to be generalized, although significantly different patterns of each anion were observed in this study.
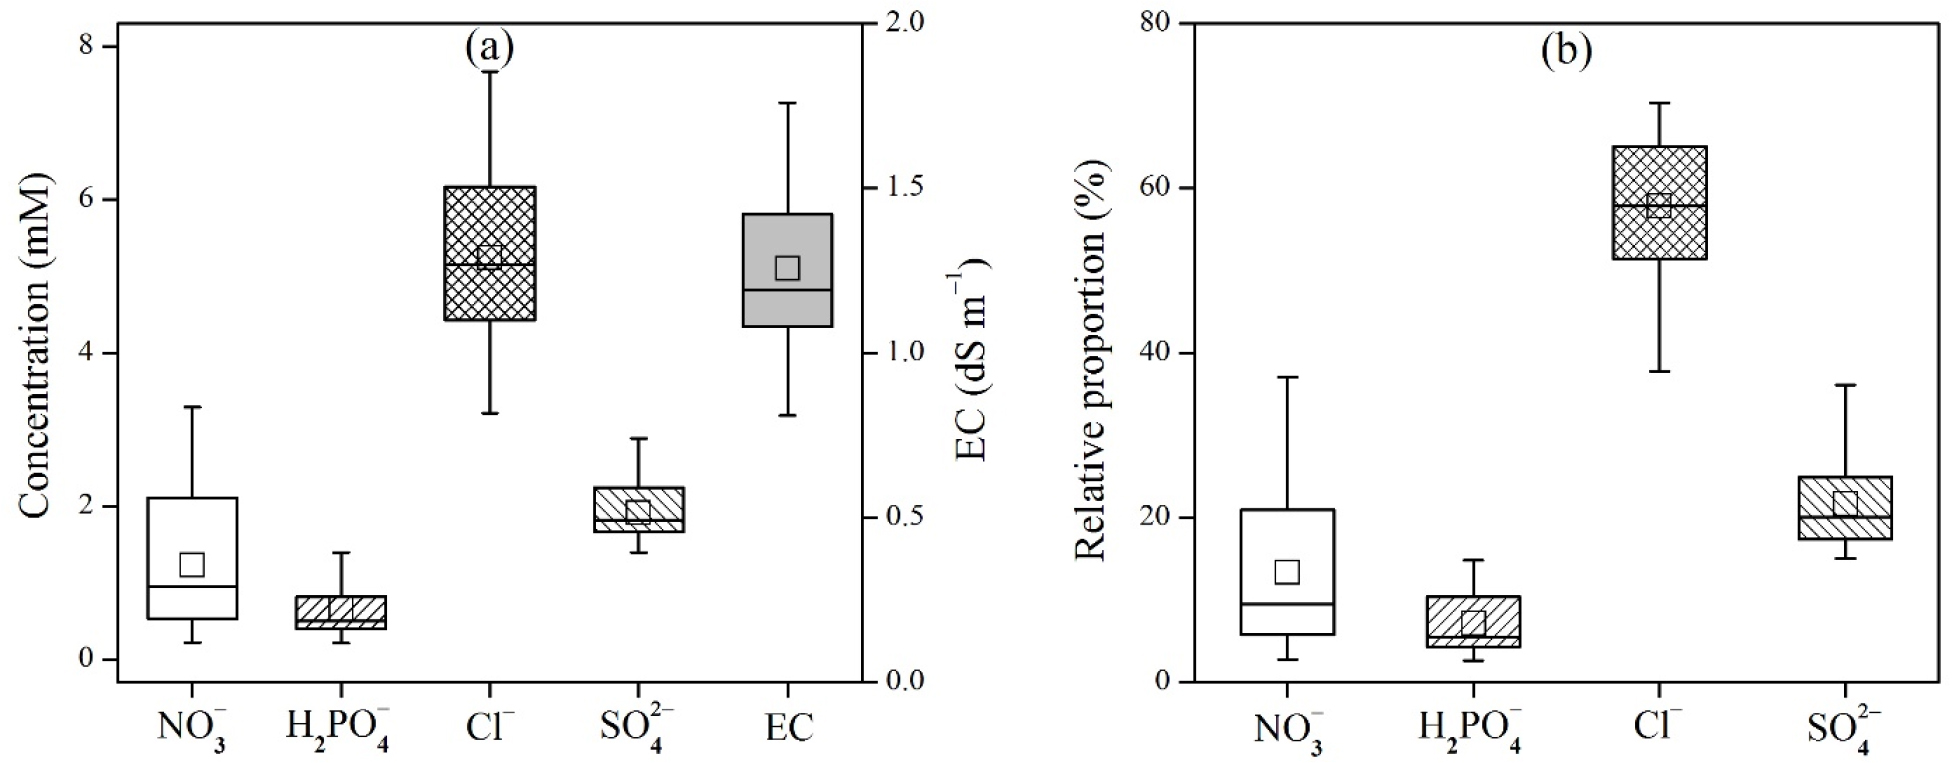
Fig. 2.
Distribution of major inorganic anions in plant-leaf extracts (1:20 H2O): (a) concentrations, (b) relative proportions in percentage. The soil extracts were obtained from 19 farmlands (5 monocots, 4 tree dicots, and 10 non-tree dicots). Electrical conductivities were measured for the identical plant extracts.
Correlations between anions in soil and plant extracts
Table 1 lists the Pearson correlation coefficients between anion concentrations in soil extracts (top), between anion concentrations in plant extracts (middle), and between soil and plant anion concentrations (bottom). Generally, the anion concentrations in soil extracts were well correlated each other, except H2PO4-. This can be attributed to the relatively low concentrations and small variation of H2PO4-. In addition, EC values were also highly correlated with concentrations of NO3-, Cl-, and SO42-. On the other hand, no significant correlation was observed for plant anions. Only plant EC and SO42- were weakly correlated. Likewise, except Cl-, no significant correlation was found between soil and plant concentrations for other anions. These results support the previous reports that anion uptake by plants is highly species-dependent (Storey, 1995; White and Broadley, 2001). However, this does not necessarily underestimate the soil’s functions and capacity associated with nutrient supply to plants.
Table 1.
Pearson correlation coefficients between anion concentrations in soil and plant extracts.
Characterization of anion compositions in soil and plant extracts
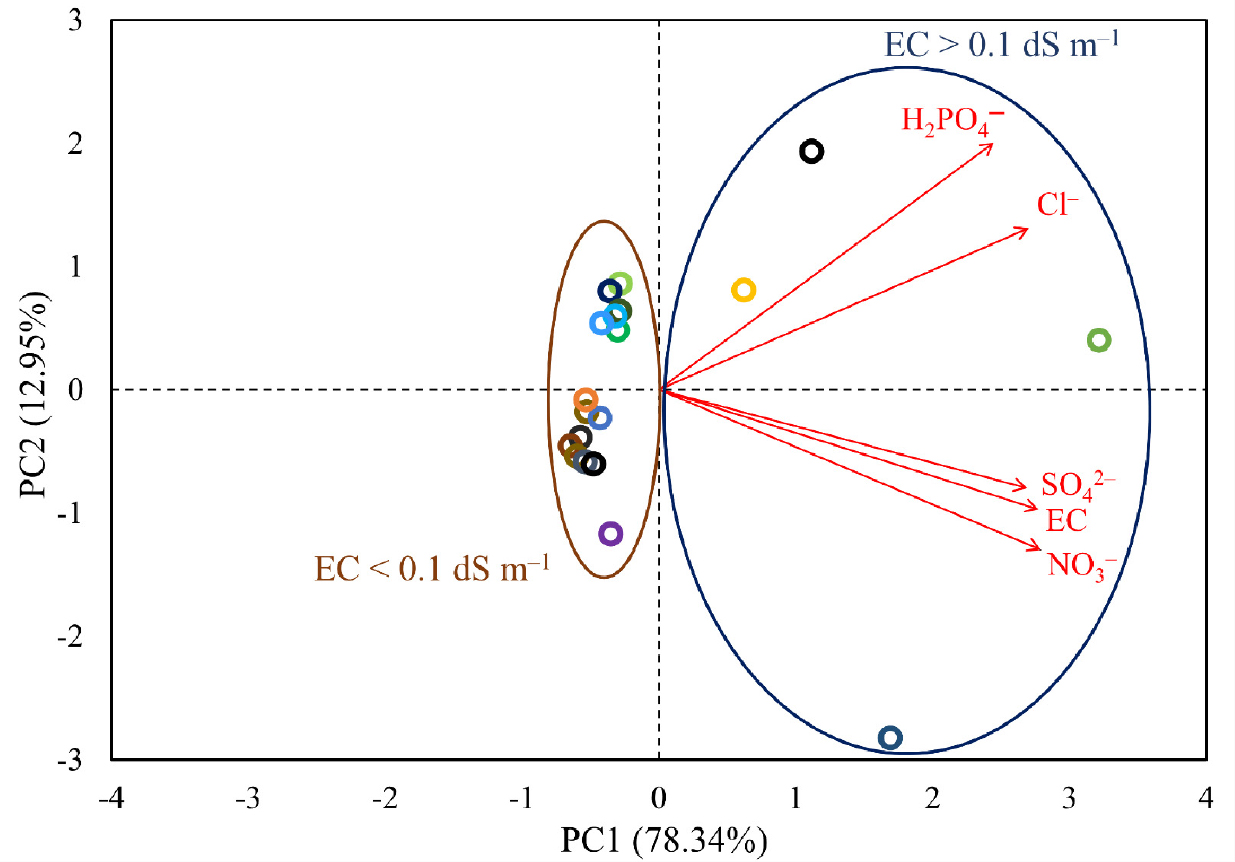
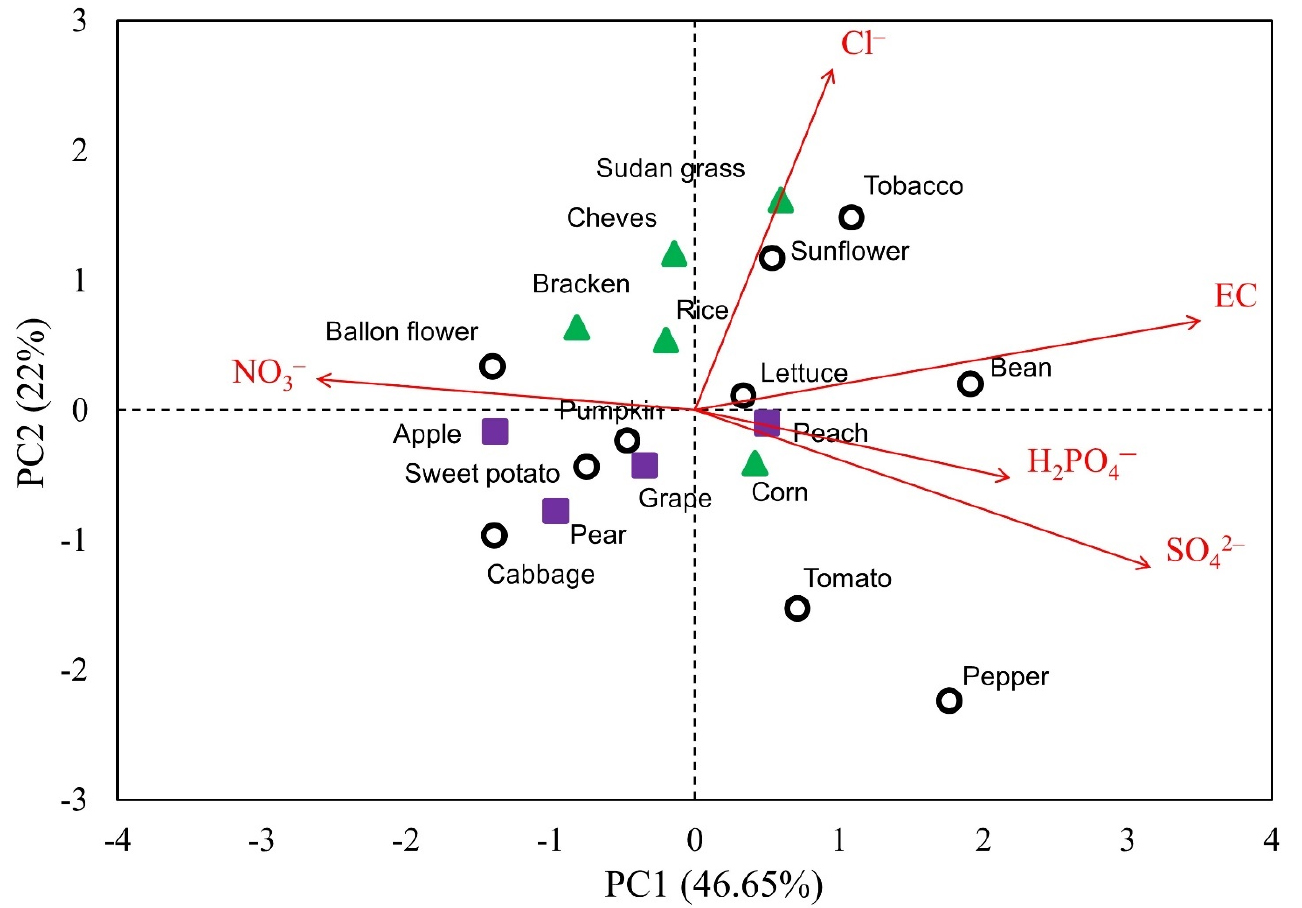
To characterize each soil in terms of its anionic concentrations, a multivariate factor analysis (PCA) was carried out (Fig. 3). Around 78% of the total variance was explained by PC1, which was loaded almost evenly by all the factors (normalized [NO3-], [H2PO4-], [Cl-], [SO42-], and EC). The magnitudes of loading ranged from 0.41 to 0.46. Particularly, the soils with high EC (1:5 H2O; greater than 0.1 dS m-1) were largely separated from the low-EC soils by PC1. The low-EC soils were further differentiated along the PC2 axis. The contribution of H2PO4- and Cl- to PC2 were relatively larger than other factors. These PCA results of soil extracts were generally well coincided with the expectations from the correlation analysis (Table 1). On the other hand, the PCA of plant extracts revealed a quite different pattern of characterization from that for soil extracts (Fig. 4). PC1 and 2 explained around 47% and 22% of the total variance, respectively. PC1 was largely loaded by EC and SO42-, but negatively loaded by NO3-. Additionally, Cl- was the predominant factor that loaded PC2. Overall, the individual plant extracts were well characterized and separated by both PC1 and 2. Although the sizes of our samples were not large enough, the 5 monocot crops and the 4 tree dicots crops tended to cluster and to be identifiable from other dicot crops. These results support the general idea that the anionic compositions of plant tissues are species-dependent and can share some degree of similarity among close species.
Conclusions
The compositional characteristics of major inorganic anions in aqueous phase are important for understanding the soil’s current nutrient supply conditions and the plant’s recent nutrient uptake status. The results of this study suggest that, although we can deduce some important general properties of their distributions and proportions, the anionic compositions are considered to be inherent characteristics of each soil and to vary largely depending on the plant species. However, the anionic compositions of each soil solution were well characterized by their response to increment of total electrolyte concentration (i.e., EC levels). In addition, the leaf anion compositions of each plant tended to share similar characteristics within the same plant types (monocots, tree dicots, and non-tree dicots).
