


Introduction
Materials and Methods
Plant materials and soil conditions
Soybean growth and yield characteristic measurements
Total dry matter and root nodule measurement
Physiological and biochemical characteristics analysis
Statistical analysis
Results and Discussion
Soybean growth and yield characteristics
15N isotope uptake of soybeans
Conclusions
Introduction
Due to climate change, changes of rainfall pattern is now in process globally. National Institute of Meteorological Research reported that average atmospheric temperature and average rainfall amount in Korea have been increased 1.4°C and 124 mm compared to ones from the early 20th century. The rainfall pattern has been changed to rainfalls with greater intensity and less rainfall days (KMA, 2023). Korea has more than 50% of paddy fields across the country and paddy field soils have characteristics of poor drainage and high groundwater levels because rice is cultivated under flooded conditions (Hwang et al., 2022). These soil conditions create excessive soil moisture stress to crop roots and lead to poor growth and yields (Hiler et al., 1971; Belford, 1981; Chun et al., 2018; Chun et al., 2022). Korean government promoted cultivation of upland crops on paddy fields in order to decrease overproduced rice and improve a self-sufficiency rate of field crops in Korea. Therefore, area of soybean cultivation in paddy fields increased from 63,000 ha in 2017 to 115,000 ha in 2019 (KOSIS, 2021). However, soybean cultivation in paddy fields is easily affected by excessive soil moisture stress because of conditions as explained above.
Soybean production is of great importance to crop producers in Korea. The N requirement of soybean is greater than other grain crops for seed production and this N is supplied from soils and biological N fixation (Scott, 2015). Previous studies reported that pre-plant N application for soybean has inconsistent effects on seed yields (Al-Ithawi et al., 1980; Stone et al., 1985; Schmitt et al., 2001). Sorensen and Penas (1978) reported seed yields of soybean increased as pre-plant N fertilizer increased, but it also increased lodging and disease potential in soybeans. Especially, soybeans get N from the atmosphere by N fixation process. Because of this, researchers doubt effects of in-season N application to soybeans. Despite the lack of consistent positive yield responses, the concept of applying N to soybean late in the growing season has scientific merits. Shibles (1998) states that N2-fixing capacity begins to decline rapidly after growth stage R5 (beginning seed), which is approximately the same time as peak N demand. Thus, adding fertilizer N to soybean later in the growing season can extend NO3- reductase activity beyond R5 (Shibles, 1998). Another possible merit of in-season N application is to mitigate crop losses due to soil waterlogging (Nelson and Cripton, 2008). Excessive soil moisture conditions can cause significant N losses from pre-plant fertilizer applications. In-season application of N fertilizer can promote increased seed yield if N deficiencies occur later in the growing season (Scharf et al., 2002; Nelson et al., 2011). However, there is no extensive information available to the effects of in-season N application to soybeans under various soil moisture conditions.
It is necessary to distinguish in-season applied N from pre-plant N in soils and soybeans in order to determine effects of in-season N application. Using an isotope is a typical example of the tracing N method in soil (Holbeck et al., 2013). This study hypothesized that in-season N application would affect seed formation and eventually yields in soybeans. The objective of this study was to determine the effects of in-season N application using 15N isotope to soybeans under various soil moisture conditions.
Materials and Methods
Plant materials and soil conditions
Soybean (Glycine max L. cv. Seonpung) was bred at the National Institute of Crop Science of Rural Development Administration (RDA). The average flowering date of Seonpung is August 5, and the average maturity date is October 19. The average plant has the following characteristics main stem length is 67 cm, branches are 3, number of pods is 46 per plant, 100 grain weight is 25.9 g, and yield is 326 kg 10a-1.
Soybean was grown in a greenhouse at the Department of Southern Area Crop Science, National Institute of Crop Science, Miryang, Korea (greenhouse; 35°29'N, 128°44'E, at 14 m altitude) in 2022.
Soils used in this study were rest for a year in the Department of Southern Area Crop Science, National Institute of Crop Science. These soils were mixed well before they were filled up pots and each pot was filled up with 3 kg of the soils. The soils in the pot were sandy loam. Chemical properties of the soils were pH 7.4, EC 0.48 ds m-1, organic matter 19.8 g kg-1, total N 0.05%, and available P2O5 64.7 mg kg-1 and 0.16 K cmolc kg-1, 0.25 Ca cmolc kg-1, 1.45 Mg cmolc kg-1 (Table 1). Three or four soybean seeds were sown in 1 2,000-1 Wagner pots (25.6 cm in diameter and 39.7 cm in height) on June 24, 2022. Germination was on July 3 and two plants were left after V2 (vegetative 2nd node) growth stage. Three soil water contents were applied to soybeans: drought, control, waterlogging. Two N application treatments were applied; pots with in-season N application or without in-season N application (pre-plant fertilizer). The experiment was replicated eight times per plot, thus the total number of the pots were 48 (Fig. 1a).
Table 1.
Results of soil chemical and physical analyses.
|
pH (1:5) |
EC (dS m-1) |
T-N† (%) |
O.M. (g kg-1) |
Avail. P2O5 (mg k-1) | Exch. cations (cmolc kg-1) | Texture (%) | ||||
| K | Ca | Mg | Sand | Silt | Clay | |||||
| 7.4 | 0.48 | 0.05 | 19.8 | 64.7 | 0.16 | 0.25 | 1.45 | 66.4 | 26.0 | 7.6 |

Pre-plant fertilizer was applied to all pots just before sowing on top of a soil surface and top soils were mixed well with the pre-plant fertilizer. Amount of fertilizer was determined by soybean fertilizer recommendation rate (RDA, 2016); N-P2O5-K2O = 3-3-3.4 kg 10 a-1 (0.32-0.75-0.283 g m-2). NN particles in pre-plant fertilizer were substituted by N isotope (15N) for pots with only pre-plant fertilizer (PP), while pots with in-season N application had normal N particles in pre-plant fertilizer (INA). After sowing, soybeans were cultivated following by a standard method of cultivation for soybean (RDA, 2016).
Soil water contents were maintained at a constant level for a soil water treatment using an automatic irrigation system (Fig. 1b). These soil water content levels maintained from V2 stage to harvest. Irrigation was based on a soil water sensor (Spectrum Technologies, Plainfield, IL, USA) readings installed at a depth of 10 cm, and water was delivered through mini sprinklers. Soil water treatments were divided into three groups based on soil water contents. Drought pots were set at 20 (%, v/v), control pots at 25 (%, v/v), and waterlogging pots at 30 (%, v/v). Each soil water content was determined by measuring water retention using a pressure plate. Water contents were measured at -0.3 bar, -1 bar, and -15 bars. Based on the results of a water retention curve, a field capacity of the soil samples was 28.7% and soil water content at -15 bar was 11%. Therefore, a soil water content of drought (drought) was set as 20%, sufficient soil water content (control) as 25% and an excessive soil water (waterlogging) as 30%.
Soil water content was measured every hour during soybean growth. Results of the soil water measurements are shown in Fig. 2. The drought had average and standard deviation soil water values of 15.86 ± 3.79%. Averaged and standard deviation soil water values of the control were 23.16 ± 3.97% and ones of waterlogging treatment were 29.45 ± 7.80%. The averaged soil water values were close to the target moisture contents throughout soybean growing season.

Soybean growth and yield characteristic measurements
Growth and yield measurements were conducted after harvest. Main stem length, stem diameter, number of branches and number of nodes were measured. The main stem length was measured from the cotyledonary nodes to the last node of the main branch. Stem diameter was measured as the minimum diameter of the stem between the cotyledonary node and the first foliage leaf node with a pair of Vernier calipers (Digimatic Caliper CD67-S15PM, Mitutoyo Corp., Kawasaki, Japan). Branches were counted only if they had two or more internodes. The number of nodes was counted from the cotyledonary node to the last node of the main branch. The number of filled and unfilled pods and seeds was measured after harvest. All seeds were stripped from the pods and dried in a dryer at 65°C for several days. Yields represented seeds dry weight of each pot. The dried seeds were categorized by size: less than 5.6 mm, 5.6 mm to 6.3 mm, 6.3 mm to 6.7 mm, 6.7 mm to 7.1 mm, and bigger than 7.1 mm. Sorting was done by sieves with target sizes.
Total dry matter and root nodule measurement
The total dry matter values were determined by weighing of each plant part from every pot at 119 days after planting (DAP): leaf, stem, pod, kernel, and root. The characteristics of root nodules were investigated at harvest time (119 DAP). The number of nodules, nodule diameter, and dry matter of nodules were examined. Root nodules were counted for number and diameter immediately after harvesting in both periods, and later a dry matter was examined after oven-drying (DS-400BC, Doosung ENG Co., Korea) at 65°C for a week.
Physiological and biochemical characteristics analysis
Isotopes were applied as a pre-plant fertilizer for PP pots and an INA; 15N-urea (5 atom% 15N). PP pots were applied with 15N fertilizer as a part of pre-plant fertilizer. INA pots were applied with pre-plant fertilizer with normal N particles and in-season 15N application. The amount of N applied as pre-plant fertilizer was 3 kg 10a-1 and one as in-season N application was 3 kg 10a-1. In-season 15N particles were applied at a R1 (reproductive stage, beginning blooming) growth stage of soybeans. Eight pots from each soil water treatment were treated with an in-season N application and the remaining eight pots from each soil water treatment were treated with only pre-plant N application. After applying in-season N application, all pots were covered by a net in order to collect all fallen leaves from each pot and analyzed for 15N content and chemical properties such as isoflavone etc.
Crude fat contents of the seeds were measured using the Soxhlet (SoxtecTM 2050 Analyzer Unit, FOSS, Hillerød, Denmark). The crude protein contents of the seed were analyzed following the AOAC standard method (Horwitz and Latimer, 2005) using a FP-428 protein analyzer (LECO, St. Joseph, MI, USA). Isoflavone contents were extracted from each 0.50 g ground seed. Weighed seed samples were placed into vials and 0.2 mL of apigenin (APN) internal standard (2 mg mL-1 in DMSO) was added to each vial. After mixing, isoflavone was extracted with acetonitrile/water (5 mL 3 mL-1) mixture in a vial capped with a Teflon linear cap by shaking for 2 hours on a shaker. An additional 1.8 mL of water was then added to make the total solvent volume 10 mL. The sample was centrifuged and the supernatant was filtered with a 0.45 µm nylon membrane filter before HPLC analysis. The isoflavone analysis was performed with a Perkin-Elmer ISS 200 HPLC system (Norwalk, CT) which included a binary pump, an auto sampler, and a photodiode array detector. Separation was accomplished using a Waters C18 column (5 µm particle size, 150 × 3.9 mm); the mobile phase solvent A was 0.1% acetic acid in water, and solvent B was 0.1% acetic acid in acetonitrile; the flow rate of the mobile phase was 1.5 mL min-1. The linear gradient was from 10% to 30% B in 30 min, then 90% B for 5 min. The column was equilibrated with 10% B for 7 min between runs. UV absorbance at 260 nm was used for the quantification of all isoflavones. The calibration curves were prepared in linear concentration ranges of from 2 mg L-1 to 100 mg L-1.
Soils and plant parts were taken (5 replicates each) for measurements of 15N. Dry mass of each sample was measured and samples were ground. 15N contents were measured using an isotope mass spectrometer (MAT-253, Thermo Fisher, USA) from the ground samples at the General Laboratory Analysis center in Andong National University. After samples were analyized, values of 15N per mil were obtained. These values were calculated by Eq. 1 in order to obtain total amount of 15N in each pot. The total nitrogen (TN) were measured by Kjeldahl (Kjeltec™ 9 Analyser, FOSS, Hillerød, Denmark), and measurements were followed by a standard method (RDA, 2014). Soil 15N uptake amounts meant as a residue of 15N amounts after absorption of 15N by soybean plants. 15N uptake amounts of plant parts and soils were calculated as;
where, drymass : total mass of a dried sample (plant or soil)
TN (%) : nitrogen amounts measured by the Kjeldahl method
15N (per mil) : 15N amounts measured by an isotope mass spectrometer.
Statistical analysis
The data is expressed as the mean ± standard deviation. Statistical analysis was performed using the SPSS program (IBM, v.27, New York, USA). Data was analyzed using one-way ANOVA and missing values were excluded. Duncan test was used for post-hoc analysis.
Results and Discussion
Soybean growth and yield characteristics
Soybeans with in-season N application did not have a significant difference in growth characteristics compared to soybeans without in-season N application (Table 2). Heights, stem thickness, numbers of branches, and numbers of nodes had no difference between the fertilizer treatments. On the other hand, soybeans with a greater soil moisture content showed greater growth characteristics, such as height, stem thickness and number of nodes (Table 2). The soybean height under the waterlogging treatment was 62.29 ± 4.87 cm from in-season N application and 62.00 ± 4.85 cm from non in-season N application, while those with the drought treatment were 49.83 ± 2.24 cm from in-season N application and 51.00 ± 4.77 cm from non in-season N application. Soybeans with the waterlogging treatment had the greatest values in height, diameter, etc. On the other hand, soybeans with the drought treatment had the smallest values in the growth characteristics. Previous studies reported that drought stress causes lower chlorophyll contents in leaves, photosynthetic rate and net carbon assimilation efficiency in soybeans (Velu, 1999; Ghosh et al., 2006). These phenomena lead to a reduction in growth characteristics and production (Brevedan and Egli, 2003; Liu et al., 2004). When comparing plant dry weights, the in-season N application and soil water treatments did not show a distinct trend across treatments (Table 3). The in-season N application did not affect root characteristics, either (Table 4). It is well known that N fixation activity of soybean roots is greatly influenced by the availability of water in soil (Ohashi et al., 2000; Ray et al., 2006). However, there have been no reports of in-season N effects on root nodules. This study found that in-season N application did not affect root nodule development since it had already passed a growing period. On the other hand, root nodules responded well according to soil water content. The greatest number of root nodules was shown from soybeans of the control with in-season N application. The drought or waterlogged soil moisture condition negatively affects root nodules with or without in-season N application.
Table 2.
Growth characteristics of soybean in response to various soil moisture treatments with or without fertilizer; Soil moisture treatment: Drought (20%, v/v), Control (25%, v/v) and Waterlogging (30%, v/v). Fertilizer treatments: PP (pre-plant) and INA (in-season N application).
|
Soil moisture treatment |
Fertilizer treatment |
Heights (cm) |
Thickness (mm) |
Branch (count plant-1) |
Node (count plant-1) |
| Drought | INA | 49.8 ± 2.2 c† | 6.4 ± 0.9 b | 2.8 ± 1.1 ab | 14.2 ± 0.8 bc |
| PP | 51.5 ± 4.7 c | 6.9 ± 0.9 b | 3.1 ± 1.0 a | 14.1 ± 1.4 bc | |
| Control | INA | 58.0 ± 4.3 b | 7.0 ± 1.3 b | 2.4 ± 1.0 ab | 15.3 ± 1.1 ab |
| PP | 55.9 ± 6.2 b | 6.2 ± 1.2 b | 2.2 ± 0.8 b | 14.0 ± 2.1 c | |
| Waterlogging | INA | 62.2 ± 4.8 a | 8.8 ± 1.6 a | 3.2 ± 0.8 a | 16.0 ± 1.2 a |
| PP | 62.0 ± 4.8 a | 8.5 ± 1.8 a | 2.7 ± 1.3 ab | 15.5 ± 1.0 a |
Table 3.
Dry matter of soybean in response to various soil moisture treatments with or without fertilizer; Soil moisture treatment: Drought (20%, v/v), Control (25%, v/v) and Waterlogging (30%, v/v). Fertilizer treatments: PP (pre-plant) and INA (in-season N application).
|
Soil moisture treatment |
Fertilizer treatment |
Leaf dry weight (g) |
Stem dry weight (g) |
Root dry weight (g) |
| Drought | INA | 26.5 ± 5.1 ns† | 14.3 ± 3.6 b | 4.9 ± 1.2 b |
| PP | 30.7 ± 5.5 ns | 14.3 ± 2.3 b | 4.8 ± 1.1 b | |
| Control | INA | 30.9 ± 9.6 ns | 15.8 ± 3.5 b | 6.9 ± 1.9 a |
| PP | 24.4 ± 7.2 ns | 13.7 ± 4.0 b | 3.8 ± 1.4 b | |
| Waterlogging | INA | 27.6 ± 4.4 ns | 30.1 ± 7.4 a | 5.1 ± 1.2 b |
| PP | 27.7 ± 4.4 ns | 27.6 ± 7.6 a | 4.7 ± 1.5 b |
Table 4.
Root nodule characteristics of soybean in response to various soil moisture treatments with or without fertilizer. Soil moisture treatments: Drought (20%, v/v), Control (25%, v/v) and Waterlogging (30%, v/v). Fertilizer treatments: PP (pre-plant) and INA (in-season N application).
|
Soil moisture treatment |
Fertilizer treatment |
Root nodule (count plant-1) |
Root nodule dry weight (g) |
| Drought | INA | 250 ± 92 b† | 0.98 ± 0.19 b |
| PP | 225 ± 60 b | 1.21 ± 0.41 b | |
| Control | INA | 465 ± 126 a | 2.03 ± 1.01 a |
| PP | 180 ± 113 b | 0.87 ± 0.63 b | |
| Waterlogging | INA | 165 ± 138 b | 0.57 ± 0.68 b |
| PP | 127 ± 58 b | 0.43 ± 0.19 b |
Results of yield components are shown in Table 5 and Fig. 3. The greatest yields of soybeans were 43.30 ± 9.01 g pot-1 from the control with in-season N application and 42.75 ± 8.12 g pot-1 from the waterlogging with in-season N application (Fig. 3). Soybeans under the drought treatment had the smallest yield with or without in-season N application as 20.47 ± 4.73 g pot-1 and 19.47 ± 4.75 g pot-1, respectively. Soybeans with in-season N application showed greater values in 100 seed weights and number of pods under the control and waterlogging treatment than ones under the drought treatment. These results followed the trend of yield results as an in-season N effect.
Table 5.
Yield characteristics of soybean in response to various soil moisture treatments with or without fertilizer. Soil moisture treatment: Drought (20%, v/v), Control (25%, v/v) and Waterlogging (30%, v/v). Fertilizer treatments: PP (pre-plant) and INA (in-season N application).
|
Soil moisture treatment |
Fertilizer treatment |
Pod (count plant-1) |
Filled pod (count plant-1) |
Seed (count plant-1) |
100 Seed weight (g plant-1) |
| Drought | INA | 67.8 ± 14.9 d† | 34.1 ± 9.8 e | 97.6 ± 15.4 c | 19.0 ± 3.7 c |
| PP | 63.5 ± 6.5 d | 41.1 ± 12.9 de | 98.8 ± 18.1 c | 20.2 ± 1.8 bc | |
| Control | INA | 103.0 ± 16.4 b | 82.7 ± 20.5 ab | 170.1 ± 28.7 b | 25.3 ± 2.0 a |
| PP | 82.8 ± 15.8 c | 59.7 ± 17.6 cd | 142.0 ± 30.9 b | 22.5 ± 2.9 ab | |
| Waterlogging | INA | 120.3 ± 17.7 a | 93.0 ± 19.5 a | 206.0 ± 33.1 a | 20.2 ± 1.7 bc |
| PP | 95.8 ± 13.3 bc | 67.4 ± 15.7 bc | 160.4 ± 29.0 b | 19.9 ± 2.5 bc |
These results showed that the in-season N application did not affect growth characteristics of soybeans, while soil water content significantly affected them. These are reasonable results since N was applied in the R1 stage when soybeans had passed the vegetative stage and entered the reproductive stage. Chiluwal et al. (2021) reported that in-season N application increased soybean yields; but had no significant effects on soybean growth. However, Schmitt et al. (2001) found that in-season N application did not improve soybean yields in Minnesota, USA and did not recommend it’s use. These conflicting results of in-season N application effects may be induced by soil water conditions. The effect of in-season N application is still being debated, so it is important to investigate the trace of in-season N application under different soil water conditions in soybeans.
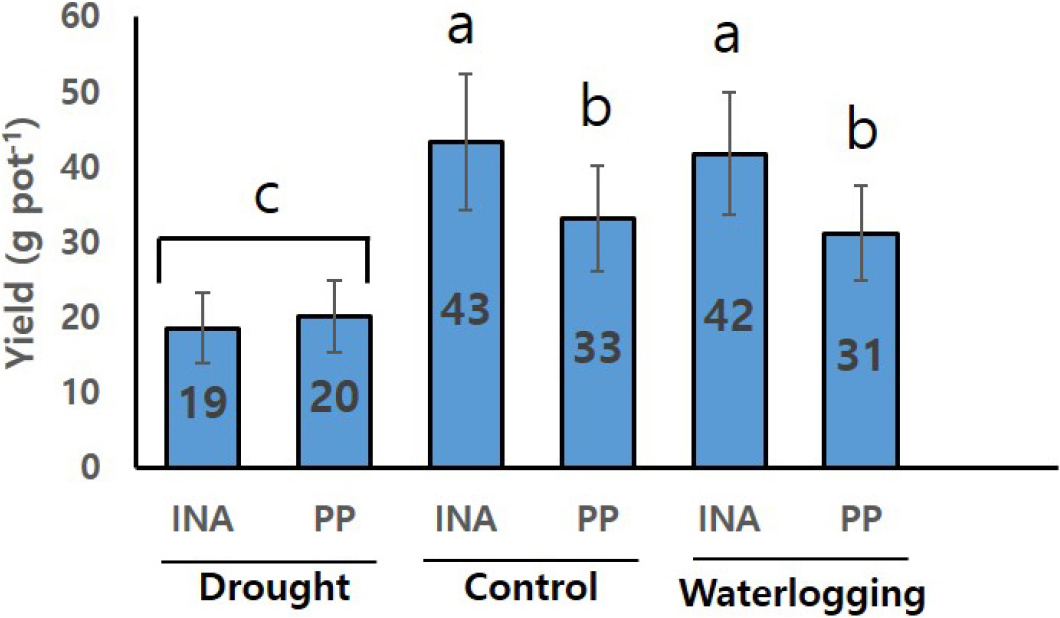
Fig. 3.
Soybean yield results in response to various soil moisture treatments with or without fertilizer. Soil moisture treatments: drought (20%, v/v), Control (25%, v/v) and waterlogging (30%, v/v). Fertilizer treatments: PP (pre-plant) and INA (in-season N application). The different letter means a significant difference among the treatments (at p ≤ 0.05, Turkey’s test). The same letter indicates no significant differences among treatments.
15N isotope uptake of soybeans
Soybean uptake amounts of 15N from pre-plant fertilizer and in-season N application were analyzed from leaves, stalks, roots and seeds after harvest. Total amounts of absorbed 15N in soybeans were greater from soybeans with in-season N application across soil water treatments (Fig. 4). The uptake amount of 15N from drought, control and waterlogging was 0.91 ± 0.18 g plant-1, 1.13 ± 0.16 g plant-1 and 0.93 ± 0.23 g plant-1, respectively. Soybeans with only pre-plant fertilizer had the smallest 15N value at 0.29 ± 0.06 g plant-1 under waterlogging, while those from the control and drought showed slightly greater values at 0.53 ± 0.17 g plant-1 and 0.40 ± 0.01 g plant-1. Tanguilig et al. (1987) tested the effects of water stress on soybean nutrient uptake. Water stress reduced nutrient uptake by crops due to decreased transpiration, impaired active nutrient absorption and transport mechanisms of the roots. Kirda et al. (1989) found that soybean is the most sensitive to N fixation, followed by plant growth under drought conditions. In addition, waterlogging conditions create 30 - 50% losses in photosynthesis, stomatal conductance and poor N status (James and Crawford, 1998; Thomas et al., 2005). The results were confirmed in this study by showing greater N uptake from the control condition and less uptake of N from the drought and waterlogging conditions. Based on these results, it is reasonable that soybeans under the soil water stress absorbed less N from soils. However, this reduced uptake of N can be supplemented by an in-season N application.

Fig. 4.
15N uptake amounts from soybeans in response to various soil moisture treatments with or without fertilizer. Soil moisture treatment: Drought (20%, v/v), Control (25%, v/v) and Waterlogging (30%, v/v). Fertilizer treatments: PP (pre-plant) and INA (in-season N application). The different letter means a significant difference among the treatments (at p ≤ 0.05, Turkey’s test). The same letter indicates no significant differences among treatments.
Soils were also taken for the 15N analysis. There was no significant trend in 15N remaining in soils between fertilizer treatments, but the waterlogging condition showed the greatest remaining 15N values compared to other soil water conditions (Table 6). 15N amounts in soils had no trend with or without in-season N application. However, in-season N application affected absorption of 15N by roots, leaves, pods and seeds from all soil water treatments. Absorption portions of 15N were calculated from root nodules, roots, stalks, leaves, pods and seeds of every plant. Seeds absorbed the most 15N throughout all soil water treatments and fertilizer treatments (Fig. 5). Seeds with in-season N application showed 66% 15N absorption during the drought, while ones with pre-plant fertilizer showed 63%. Seeds with in-season N application showed 75% and 78% compared to the control and waterlogging, respectively, while those with pre-plant fertilizer had 70% and 63%. Seeds with in-season N application absorbed the highest amount of 15N at 78% under waterlogging compared to those under control and drought conditions. These results indicate that waterlogging induces greater N absorption in seeds than other soil water conditions. It is an interesting result that seeds from the waterlogging condition had a greater portion of N absorption under in-season N application, while N absorption from pre-plant fertilizer showed the smallest from the drought and waterlogging. These results made a difference in seed components and seed size ratio. Seed components were analyzed to determine the effects of in-season N application on seed components (Table 7). The in-season N application did not affect seed components, but the water treatments did. Soybean seeds with waterlogging treatment had the greater crude lipids, glycitein, genistein and total isoflavones. Results of seed size ratio analysis are displayed in Fig. 6. The big seeds which are greater than 7.1 mm in diameter were more found under the control and waterlogging conditions. Seeds with in-season N application had greater amounts of large seeds than seeds with only pre-plant fertilizer. On the other hand, the drought condition had the smallest amount of big seeds as only 62%, while the control and waterlogging had 87% and 74% respectively under in-season N application. This trend continued for the pre-plant fertilizer treatment. Chun et al. (2017) reported that crop seed components can increase up to a certain point as soil water stress increased, then decrease as the stress continues to increase. In this study, the waterlogging treatment increased crude lipids and total isoflavone components, but these components could decrease if the waterlogging condition worsens. Wesley et al. (1999) concluded that in-season N fertilizer did not improve grain protein and oil components in soybeans. However, Chiluwal et al. (2021) reported that in-season N application at R5 (beginning seeds) increased protein in soybean seeds. These results indicate that seed components are very sensitive environmental conditions and effects of environmental stress or additional nutrients vary by growth stages.
Table 6.
N isotope (15N) uptake by soybean parts in response to various soil moisture treatments with or without fertilizer. Soil moisture treatment: Drought (20%, v/v), Control (25%, v/v) and Waterlogging (30%, v/v). Fertilizer treatments: PP (pre-plant) and INA (in-season N application).
|
Soil moisture treatment |
Fertilizer treatment |
Soil (g pot-1) |
Nodule (g pot-1) |
Root (g pot-1) |
Stem (g pot-1) |
Leaf (g pot-1) |
Pod (g pot-1) |
Seed (g pot-1) |
| Drought | INA | 0.04 ± 0.04 ab† | 0.005 ± 0.00 ab | 0.02 ± 0.01 b | 0.03 ± 0.01 ns | 0.19 ± 0.08 a | 0.04 ± 0.01 ab | 0.61 ± 0.20 b |
| PP | 0.02 ± 0.01 b | 0.006 ± 0.00 ab | 0.02 ± 0.00 b | 0.02 ± 0.00 ns | 0.06 ± 0.01 b | 0.03 ± 0.01 bc | 0.24 ± 0.00 cd | |
| Control | INA | 0.02 ± 0.00 b | 0.006 ± 0.00 ab | 0.06 ± 0.01 a | 0.03 ± 0.03 ns | 0.11 ± 0.02 b | 0.05 ± 0.01 a | 0.85 ± 0.11 a |
| PP | 0.04 ± 0.01 ab | 0.002 ± 0.01 c | 0.01 ± 0.00 b | 0.01 ± 0.01 ns | 0.10 ± 0.04 b | 0.02 ± 0.01 cd | 0.37 ± 0.11 c | |
|
Water logging | INA | 0.03 ± 0.01 ab | 0.003 ± 0.00 bc | 0.03 ± 0.00 b | 0.01 ± 0.00 ns | 0.09 ± 0.04 b | 0.04 ± 0.00 ab | 0.71 ± 0.16 ab |
| PP | 0.06 ± 0.02 a | 0.001 ± 0.00 c | 0.02 ± 0.01 b | 0.02 ± 0.01 ns | 0.05 ± 0.03 b | 0.01 ± 0.00 d | 0.18 ± 0.04 d |

Fig. 5.
15N absorption ratio from soybean parts (Nodule, root, stem, leaf, pod and seed) in response to various soil moisture treatments with or without fertilizer. Soil moisture treatment: Drought (20%, v/v), Control (25%, v/v) and Waterlogging (30%, v/v). Fertilizer Treatment: PP (pre-plant) and INA (in-season N application).
Table 7.
Physiological characteristics of soybean in response to various soil moisture treatments with or without fertilizer; Soil moisture treatment: Drought (20%, v/v), Control (25%, v/v) and Waterlogging (30%, v/v). Fertilizer treatments: PP (pre-plant) and INA (in-season N application).

Fig. 6.
Soybean seed size ratio results in response to various soil moisture treatments with or without fertilizer. Soil moisture treatment: Drought (20%, v/v), Control (25%, v/v) and Waterlogging (30%, v/v). Fertilizer treatments: PP (pre-plant) and INA (in-season N application). The different letter means a significant difference among the treatments (at p ≤ 0.05, Turkey’s test). The same letter indicates no significant differences among treatments.
In this study, soybeans with in-season N applications under the control and waterlogging treatment had greater yields than those with only pre-plant fertilizer. Soybeans with the drought treatment absorbed a greater amount of N from in-season N application to seeds. However, this greater absorption of N did not lead to an increase in yields under the drought condition. The in-season N application improves yields and seed sizes under the control and waterlogging conditions. Previous studies reported that in-season N applications after R1 increased yields of soybeans (Wesley et al. 1998; Lamond and Wesley, 2001; Chiluwal et al., 2021). The period of peak N demand in soybeans is from R1 to R6 (full seed) growth stage. The N demand at this time is very great, therefore fixed N alone may not be enough to meet it. In-season N application may be necessary for maximum soybean yield. In addition, additional N application during waterlogging conditions mitigates N deficiency in soybean and increases yields (Kaur et al., 2017). Therefore, it is reasonable to conclude that in-season N application may help increase soybean yields and reduce wet injury under sufficient soil water conditions or excessive soil water conditions.
Conclusions
In conclusion, soybean N uptake is very sensitive to environmental conditions, especially, soil water stress. In-season N application can be useful if soybean growth stage and soil water condition are proper. It is still debatable to define the benefits of in-season N application to soybeans. However, it is reasonable to state that in-season N application helped increase seed size, yield and functional components in seeds. Therefore, this study concluded that in-season N application is recommended for soybean cultivation in paddy fields where waterlogging condition occurs easily. Furthermore, soybean cultivation in upland soils or irrigated condition can apply in-season N fertilizer in order to reach maximum yield.
