Original research article

Korean Journal of Soil Science and Fertilizer. 30 November 2021. 451-466
https://doi.org/10.7745/KJSSF.2021.54.4.451

ABSTRACT


MAIN

  • Introduction

  • Materials and Methods

  •   공시 토양 및 바이오차 제조

  •   시험구 처리 및 항온 배양시험

  •   가스 flux 측정 및 분석

  •   통계분석

  • Results

  •   토양 화학성 변화

  •   CO2 배출량

  •   N2O 배출량

  •   온실가스 (CO2, N2O) 누적 배출량

  • Discussion

  • Conclusions

Introduction

국내 농경지에서 작물 재배 후 발생되는 바이오매스량은 연간 약 1,170만 톤으로 추정된다 (Yoon et al., 2014). 활용도가 낮은 농업부산물은 수확 이후 소각하거나 토양 환원을 통해 처리되는 것이 일반적이다 (Park et al., 2011; Woo, 2013). 이런 부산물을 혐기성 환경에서 매립할 경우 메탄 (methane, CH4) 생성을 야기하고, 소각할 경우 각종 유해가스와 이산화탄소 (carbon dioxide, CO2), 아산화질소 (nitrous oxide, N2O)와 같은 온실가스가 발생하게 된다 (Zhang et al., 2008).

1750년대 산업혁명 이후 인간의 활동으로 대기 중 온실가스 (greenhouse gases, GHGs)의 농도가 크게 증가하였다 (IPCC, 2007). 역사적 배출로 CO2, N2O, CH4 등의 대기 중 온실가스 농도가 적어도 지난 80만 년 동안 유례없는 수준으로 상승하였다 (IPCC, 2014). 이러한 온실가스 중 농경지에서 주로 배출되는 CH4와 N2O의 지구온난화지수 (global warming potential, GWP)는 CO2에 비해 각각 25배, 298배에 이르러 지구온난화에 미치는 영향이 훨씬 크다 (IPCC, 2007). 지구온난화에 대한 우려가 증가되면서 국내 농업 분야에서도 저탄소 녹색성장에 대한 필요성이 대두되고, 관련된 정책들과 연구가 진행되고 있다.

최근 기후변화 대응의 일환으로 농업 부산물을 활용한 바이오차 (biochar) 관련 연구가 활발하게 진행되고 있다 (Lehmann et al., 2011; Lee et al., 2020). 바이오차는 바이오매스 (biomass)와 숯 (charcoal)의 합성어로, 바이오매스를 산소가 없는 환경에서 열분해하여 만든 탄소 함량이 높은 고형물이다 (Lehmann, 2007). 바이오매스 내 탄소는 열분해를 거치면서 안정된 형태의 사슬 구조로 재배열돼 토양 미생물에 의해 쉽게 분해되지 않기 때문에 바이오차를 토양에 투입하면 탄소를 반영구적으로 토양에 격리할 수 있다 (Lehmann, 2007; Lehmann and Joseph, 2009). 농업 분야에서 발생되는 각종 바이오매스 자원을 바이오차로 전환하여 활용할 경우 CO2, CH4, N2O 등의 온실가스 저감 효과가 있다 (Ameloot et al., 2013; Liu et al., 2019; Shaukat et al., 2019). 더불어 토양 개량 (Huang et al., 2013; Liu et al., 2016; Nguyen et al., 2017), 작물 수확량 개선 (Park et al., 2019, 2021; Martos et al., 2020) 등의 추가 효과를 얻을 수 있다 (Carvalho et al., 2016).

기존 연구들의 경우 바이오차 재료 및 제조 방법 (Gaskin et al., 2008; Lehmann and Joseph, 2009), 온실가스 배출량 평가 (Karhu et al., 2011; Aguilar-Chavez et al., 2012; Troy et al., 2013), 작물 생육에 초점을 맞추어 연구되어 왔다 (Dong et al., 2015; Park et al., 2021). 바이오차의 효과는 바이오차의 재료 (Liu et al., 2011; Quilliam et al., 2013) 및 물리 ‧ 화학적 특성 (Gaskin et al., 2008; Lehmann and Joseph, 2009), 열분해 온도 (Lehmann et al., 2011; Clough et al., 2013), 기존 토양특성 (Van Zwieten et al., 2014; Nguyen et al., 2017), 비료 투입량 (Carvalho et al., 2016; Shaukat et al., 2019)에 따라 토양특성 및 작물 생육에 차이를 보인다 (Chen et al., 2020; Park et al., 2021). 비옥한 토양보다 빈약한 토양에서 바이오차 적용 효과가 더 높은 것으로 평가되고 있다 (Hailegnaw et al., 2019).

농경지의 경우, 갯벌에서 간척되어 논으로 개간되거나 (Yang et al., 2008), 산림에서 밭 또는 시설재배지 (Lee et al., 2003, Oh et al., 2010; Ok et al., 2015)로 개간되는 등의 경우가 발생한다. 그러므로 토지이용 전환되는 농경지별로 바이오차 적용 효과가 상이할 것으로 판단된다. 그러나 국내에서 농경지 유형별 바이오차 적용에 따른 온실가스 배출 저감 효과 연구는 여전히 미흡한 상황이다.

따라서 이 연구는 농경지 토양별 바이오차 적용 수준에 따른 온실가스 감축 효과를 평가하고자 하였다. 이를 위해 농경지 토양별 바이오차 투입량에 따른 일별 온실가스 배출량을 정량적으로 평가하였다. 이는 농경지별 온실가스 배출량 산정에 기초자료로 활용이 가능하며, 향후 농경지에서 일정 양 이하로 줄인 배출량에 대한 크레딧을 인정받아 거래할 수 있도록 함으로써, 산업 간 혹은 국가 간 탄소배출권 거래에 기여할 수 있을 것으로 판단된다.

Materials and Methods

공시 토양 및 바이오차 제조

본 연구는 기존 배추를 재배하였던 노지 밭 토양 (upland soil: 35°00'7.0"N, 127°30'24.2"E), 시설재배지 토양 (greenhouse soil: 35°22'52.3"N, 126°36'38.8"E), 개간지 토양 (converted soil: 35°49'28.4"N, 127°02'49.0"E), 간척지 토양 (reclaimed soil: 35°49'42.8"N, 126°41'10.0"E)을 사용하였다. 대상지에서 채취한 토양을 풍건 후 2 mm 체에 통과시켜 공시재료로 사용하였다. 공시 토양의 화학적 특성의 경우 아래 표와 같다 (Table 1).

Table 1.

Chemical properties by soil types in farmland.

Type pH
(1:5)
EC
(dS m-1)
T-C
(g kg-1)
T-N
(g kg-1)
NH4
(mg kg-1)
NO3
(mg kg-1)
Av. P2O5
(mg kg-1)
Ex. cation (cmol+ kg-1) C.E.C
K Ca Mg
U 4.8 0.5 14.13 1.40 92.3 260.6 32.0 0.4 2.6 1.2 5.6
G 5.5 4.1 12.05 1.38 289.2 240.2 595.0 0.5 7.5 2.2 14.3
C 6.5 0.3 7.79 0.63 95.3 7.6 160.6 0.2 3.2 1.5 6.7
R 6.7 0.2 4.12 0.57 57.9 2.5 171.7 0.7 1.8 2.2 10.6

U, upland soil; G, greenhouse soil; C, converted soil; R, reclaimed soil.

토양분석은 토양 화학분석법 (NIAS, 2000)에 준하여 pH, T-C 및 T-N을 분석하였다. pH는 토양을 증류수와 1:5 (W V-1)로 혼합한 후 30분간 교반하여 pH meter (S230 Mettler Toledo, Switzerland)로 측정하였고, T-C와 T-N는 CN analyzer (Vario Max CN, Elementar, Germany)로 분석하였다. 유효인산은 Lancaster법 (UV2550PC, Pekinelmer, USA)으로 분석하였으며, NH4+는 Indophenol-Blue 비색법, NO3+는 Brucine법을 이용하여 분석하였다. 양이온치환용량 (cation exchange capacity)과 치환성양이온은 1N-NH4OAc용액으로 침출 후 ICP (ICPE-9000, Shimadzu, Japan)를 사용하여 분석하였다.

본 연구에 사용한 바이오차는 왕겨를 수거, 건조 등 전처리 과정을 거친 후 전북 고창의 왕겨숯 제조공장 탄화로를 이용하여 TLUD (top lit up draft) 열분해 방식으로 약 500°C에서 제조하였다. TLUD 방식은 탄화로 상단 전기 저항체를 통해 점화를 하고, 하단 바이오매스 사이의 미세한 공극을 통해 공기가 유입되어 상층부터 탄화가 될 수 있도록 고안된 장치를 통해 생산한다. 왕겨 바이오차의 pH는 10.8이었고, T-C 함량은 566.9 g kg-1이었다. H:C ratio는 0.37이었고, 표면적은 159.6 m2 g-1으로 분석되었다 (Table 2).

Table 2.

Physicochemical properties of biochar.

Material pH (1:10) T-C (g kg-1) T-N (g kg-1) T-H (g kg-1) H:C ratio Surface area (m2 g-1)
Rice hull biochar 10.8 566.9 5.7 17.6 0.37 159.6

바이오차의 pH는 토양분석 시 사용한 장비를 통하여 바이오차와 증류수를 1:10 (W V-1)로 혼합하여 교반 후 측정하였고, T-C, T-N, 총 수소 (total hydrogen, T-H)는 Elemental Analyzer (Vario MACRO cube, Elementar, Germany)로 분석하였고, 비표면적은 Surface area analyzer (BELSORP-max, BEL, Japan)로 분석하였다.

시험구 처리 및 항온 배양시험

시험구 처리는 농경지 토양 유형에 따라 밭 토양 (upland soil, U), 시설재배지 토양 (greenhouse soil, G), 개간지 토양 (converted soil, C), 간척지 토양 (reclaimed soil, R) 처리구로 구분하였다. 다음으로, 바이오차의 투입량에 따라 ha당 0, 5 ton, 10 ton, 20 ton 투입한 처리구를 정하여 최종적으로 48개의 처리구를 설정하였다 (Table 3).

Table 3.

Description of experimental setup.

Treatments Soil group Biochar type Biochar input amount (ton ha-1)
U0 Upland Rice hull biochar 0
U5 Upland Rice hull biochar 5
U10 Upland Rice hull biochar 10
U20 Upland Rice hull biochar 20
G0 Greenhouse Rice hull biochar 0
G5 Greenhouse Rice hull biochar 5
G10 Greenhouse Rice hull biochar 10
G20 Greenhouse Rice hull biochar 20
C0 Converted Rice hull biochar 0
C5 Converted Rice hull biochar 5
C10 Converted Rice hull biochar 10
C20 Converted Rice hull biochar 20
R0 Reclaimed Rice hull biochar 0
R5 Reclaimed Rice hull biochar 5
R10 Reclaimed Rice hull biochar 10
R20 Reclaimed Rice hull biochar 20

봄배추 표준시비량을 (N-P-K: 32-7.8-19.8 kg 10a-1) 기준으로 토양 10 kg당 요소-용성인비-염화칼리를 5.47 g, 3.53 g, 2.54 g 투입하고, 혼합가축분퇴비를 (우분 28%, 돈분 22%, 계분 19%) 토양 10 kg당 42 g 투입하였다. 바이오차는 각각의 처리구에 맞도록 투입량을 산정하여 투입하였다. 모든 처리구에 토양과 자재를 투입한 후 혼합하여 closed chamber (∅ 9.0 cm, H 12.5 cm)에 충진하였다. 수분은 수분 보수력 (water holding capacity, WHC) 70%, 온도는 25°C로 미생물 분해 활성이 가장 활발한 조건으로 (Zeng et al., 2013) 42일간 배양하였다.

가스 flux 측정 및 분석

항온 조건에서 closed chamber 내 발생되는 CO2와 N2O 농도를 조사하였다. 시료채취 전 진공펌프를 이용하여 새로운 공기를 투입함으로써 closed bottle 내부에 잔존하는 가스를 제거한 후 시료를 채취하였다. 항온 배양 초기 1주일은 2일 간격, 2주차는 3일 간격, 이후는 1주일 간격으로 기체 시료를 채취하였다. 기체 시료를 채취하지 않은 기간에는 산소가 충분히 공급되도록 마개를 열어 두었고, 증발되는 수분량을 고려하여 2 - 3일 간격으로 증류수를 보충하여 일정한 수분함량이 유지되도록 하였다. 기체 시료의 CO2 농도는 불꽃이온화 검출기 (FID detector)로 분석하였으며, 칼럼은 Hayesep Q (80/100 mesh)를 충전한 1/8″ × 3.66 m의 Stainless steel tubing column, 그리고 검출기 온도는 250°C로 하였고, N2O 농도는 전자포획검출기 (ECD detector)로 분석하였으며 칼럼은 Hayesep Q (80/100 mesh)를 충전한 1/8″ × 1.83 m의 UltiMetal tubing column, 그리고 검출기의 온도는 350°C로 한 가스크로마토그래피 (7890A, Agilent, USA)로 각각 측정하였다. 세부조건은 Table 4와 같다. CO2, N2O efflux의 계산은 아래의 Eq. 1을 이용하였다 (Lee et al., 2020).

(Eq. 1)
CO2orN2Oefflux(mgm-2day-1)=ρ×VA×Ct×273(T+273)

여기서, ρ는 기체밀도로써 CO2는 1.977 mg cm-3, N2O는 1.967 mg cm-3, V는 챔버 부피 (m3), A는 챔버 표면적 (m2), Ct는 챔버 내 단위시간당 CO2 및 N2O의 증가농도 (mg m-3 day-1), T는 항온온도를 의미한다. 그리고 누적 발생량은 Σ(R×D)을 이용하여 항온기간 동안 총 CO2 및 N2O efflux를 계산하였다. 이때 R은 CO2 및 N2O 발생량 (mg m-2 day-1)이며, D는 시료채취 공백 기간이다.

Table 4.

Analytical conditions of gas chromatographic measurement for CO2 and N2O.

Gas N2O CO2
Detector µECD FID
Column Packing material Hayesep Q Hayesep Q
Materials UltiMetal Stainless steel
O.D. × length 1/8″ × 1.83 m 1/8″ × 3.66 m
Carrier gas CH4 5.0% Ar-1 N2
Flow rate Carrier 21 mL min-1 23 mL min-1
Make up 2 mL min-1 2 mL min-1
Temperature Oven 60°C 60°C
Detector 350°C 250°C
Retention time 9 min 9 min
Concentration of calibration gas 0.5 and 1.0 ppmv N2O in N2 400 and 1,000 ppmv CO2 in N2
Loop 2 mL 2 mL

통계분석

농경지 토양별 바이오차 투입량에 따른 온실가스 배출량 비교는 SPSS statistics 25를 이용하여 통계처리하였다. 처리간의 차이를 비교하기 위하여 이원 분산분석 (two-way ANOVA)을 실시하였다. 또한, F-test 값이 p < 0.05의 범위에서 유의한 경우에만 Duncan’s multiple range test를 실시하였다.

Results

토양 화학성 변화

토양의 T-C 함량은 토양유형별로 유의미한 차이가 있는 것으로 나타났으며, 바이오차 투입량에 따라서도 유의미하게 증가하는 것으로 나타났다 (p < 0.000). 바이오차를 투입하지 않은 U0, G0, C0, G0 처리구의 T-C는 각각 14.09, 11.32, 6.5, 3.6 g kg-1이었다. 그리고 바이오차를 20 ton ha-1 투입한 U20, G20, C20, G20 처리구의 T-C는 24.97, 16.17, 16.41, 13.61 g kg-1이었다. 밭과 시설재배지 토양의 T-C 함량이 간척지보다 유의미하게 높은 것으로 분석되었으며, 대조구 대비 바이오차를 20 ton ha-1투입한 처리구에서 최소 4.85 g kg-1, 최대 10.88 g kg-1 까지 증가하는 것으로 나타났다.

처리구의 토양 T-N 함량은 토양유형별로 유의미한 차이가 있는 것으로 나타났으며, 바이오차 투입량별로도 그 양에 따라 유의미하게 증가하는 것으로 나타났다 (p < 0.000). 시설재배지에서 T-N 함량은 1.98 g kg-1로 가장 높게 나타났고, 간척지 토양에서 0.75 g kg-1로 가장 낮게 나타났다.

토양의 C/N 비율은 토양유형별로 유의미한 차이가 있는 것으로 나타났으며, 바이오차 투입량에 따라서도 유의미하게 증가하는 것으로 나타났다 (p < 0.000). 바이오차를 투입하지 않은 U0, G0, C0, G0 처리구에서 C/N 비율은 각각 8.70, 6.02, 5.86, 3.76이었고, 20 ton ha-1 투입한 U20, G20, C20, G20 처리구의 C/N 비율은 13.28, 9.35, 15.63, 14.48이었다. 대조구 대비 바이오차를 20 ton ha-1투입한 처리구에서 최소 4.58 g kg-1, 최대 10.72 g kg-1 까지 증가하는 것으로 나타났다 (Table 5).

Table 5.

T-C, T-N and C/N ratio by soil type according to biochar application under closed chamber condition.

Treatments T-C (g kg-1) T-N (g kg-1) C/N ratio
U U0 14.09 ± 0.06 a 1.62 ± 0.00 a 8.70 ± 0.05 a
U5 16.94 ± 0.22 b 1.69 ± 0.11 b 10.02 ± 0.11 b
U10 19.03 ± 0.07 c 1.72 ± 0.01 b 11.06 ± 0.02 c
U20 24.97 ± 0.17 d 1.88 ± 0.00 c 13.28 ± 0.12 d
Average 18.76 ± 0.37 D§ 1.73 ± 0.01 C 10.78 ± 0.16 D
G G0 11.32 ± 0.04 a 1.88 ± 0.02 b 6.02 ± 0.05 a
G5 13.50 ± 0.19 b 1.84 ± 0.02 b 7.34 ± 0.19 b
G10 16.53 ± 0.52 c 1.98 ± 0.01 c 8.35 ± 0.27 c
G20 16.17 ± 0.11 c 1.73 ± 0.01 a 9.35 ± 0.01 d
Average 14.38 ± 0.24 C 1.86 ± 0.01 D 7.77 ± 0.14 A
C C0 6.50 ± 0.12 a 1.11 ± 0.02 b 5.86 ± 0.15 a
C5 8.68 ± 0.10 b 1.10 ± 0.02 ab 7.89 ± 0.04 b
C10 11.47 ± 0.31 c 1.10 ± 0.02 ab 10.43 ± 0.22 c
C20 16.41 ± 0.27 d 1.05 ± 0.0 a 15.63 ± 0.09 d
Average 10.76 ± 0.36 B 1.09 ± 0.01 B 9.98 ± 0.34 C
R R0 3.68 ± 0.06 a 0.98 ± 0.02 d 3.76 ± 0.03 a
R5 5.42 ± 0.14 b 0.75 ± 0.02 a 7.23 ± 0.27 b
R10 8.49 ± 0.10 c 0.89 ± 0.02 b 9.54 ± 0.30 c
R20 13.61 ± 0.03 d 0.94 ± 0.01 cd 14.48 ± 0.20 d
Average 7.80 ± 0.35 A 0.89 ± 0.01 A 9.36 ± 0.15 B
Effect Probability > F
Soil type (A) p < 0.000p < 0.000p < 0.000
Biochar input amount (B) p < 0.000p < 0.000p < 0.000
(A) × (B) p < 0.000p < 0.000p < 0.000

Values are the means with standard errors in parentheses (n = 3), and those followed by a different letter are significantly different at α = 0.05 between treatments.

ANOVA was performed for all the treatments.

The bold indicates that the effects are significant at α = 0.05.

§A result of Duncan’s multiple range test by soil type (p < 0.05).

A result of Duncan’s multiple range test by biochar input amount (p < 0.05).

CO2 배출량

6주간 토양유형별 바이오차 투입량에 따른 CO2 배출량을 분석한 결과 토양유형 및 바이오차 투입량별로 유의미한 차이는 없는 것으로 분석되었다 (Table 6). 다만, 항온 배양 직후 모든 처리구에서 CO2 배출량이 높게 배출되었고, 배양실험 8일차까지 완만하게 감소하다가 11일차에 소폭 증가하고 14일차에 CO2가 가장 적게 배출되는 것으로 분석되었다. 이후 42일차까지 큰 변화는 나타나지 않았다 (Fig. 1).

Table 6.

CO2, N2O emissions & cumulative emissions by soil type according to biochar application under closed chamber condition.
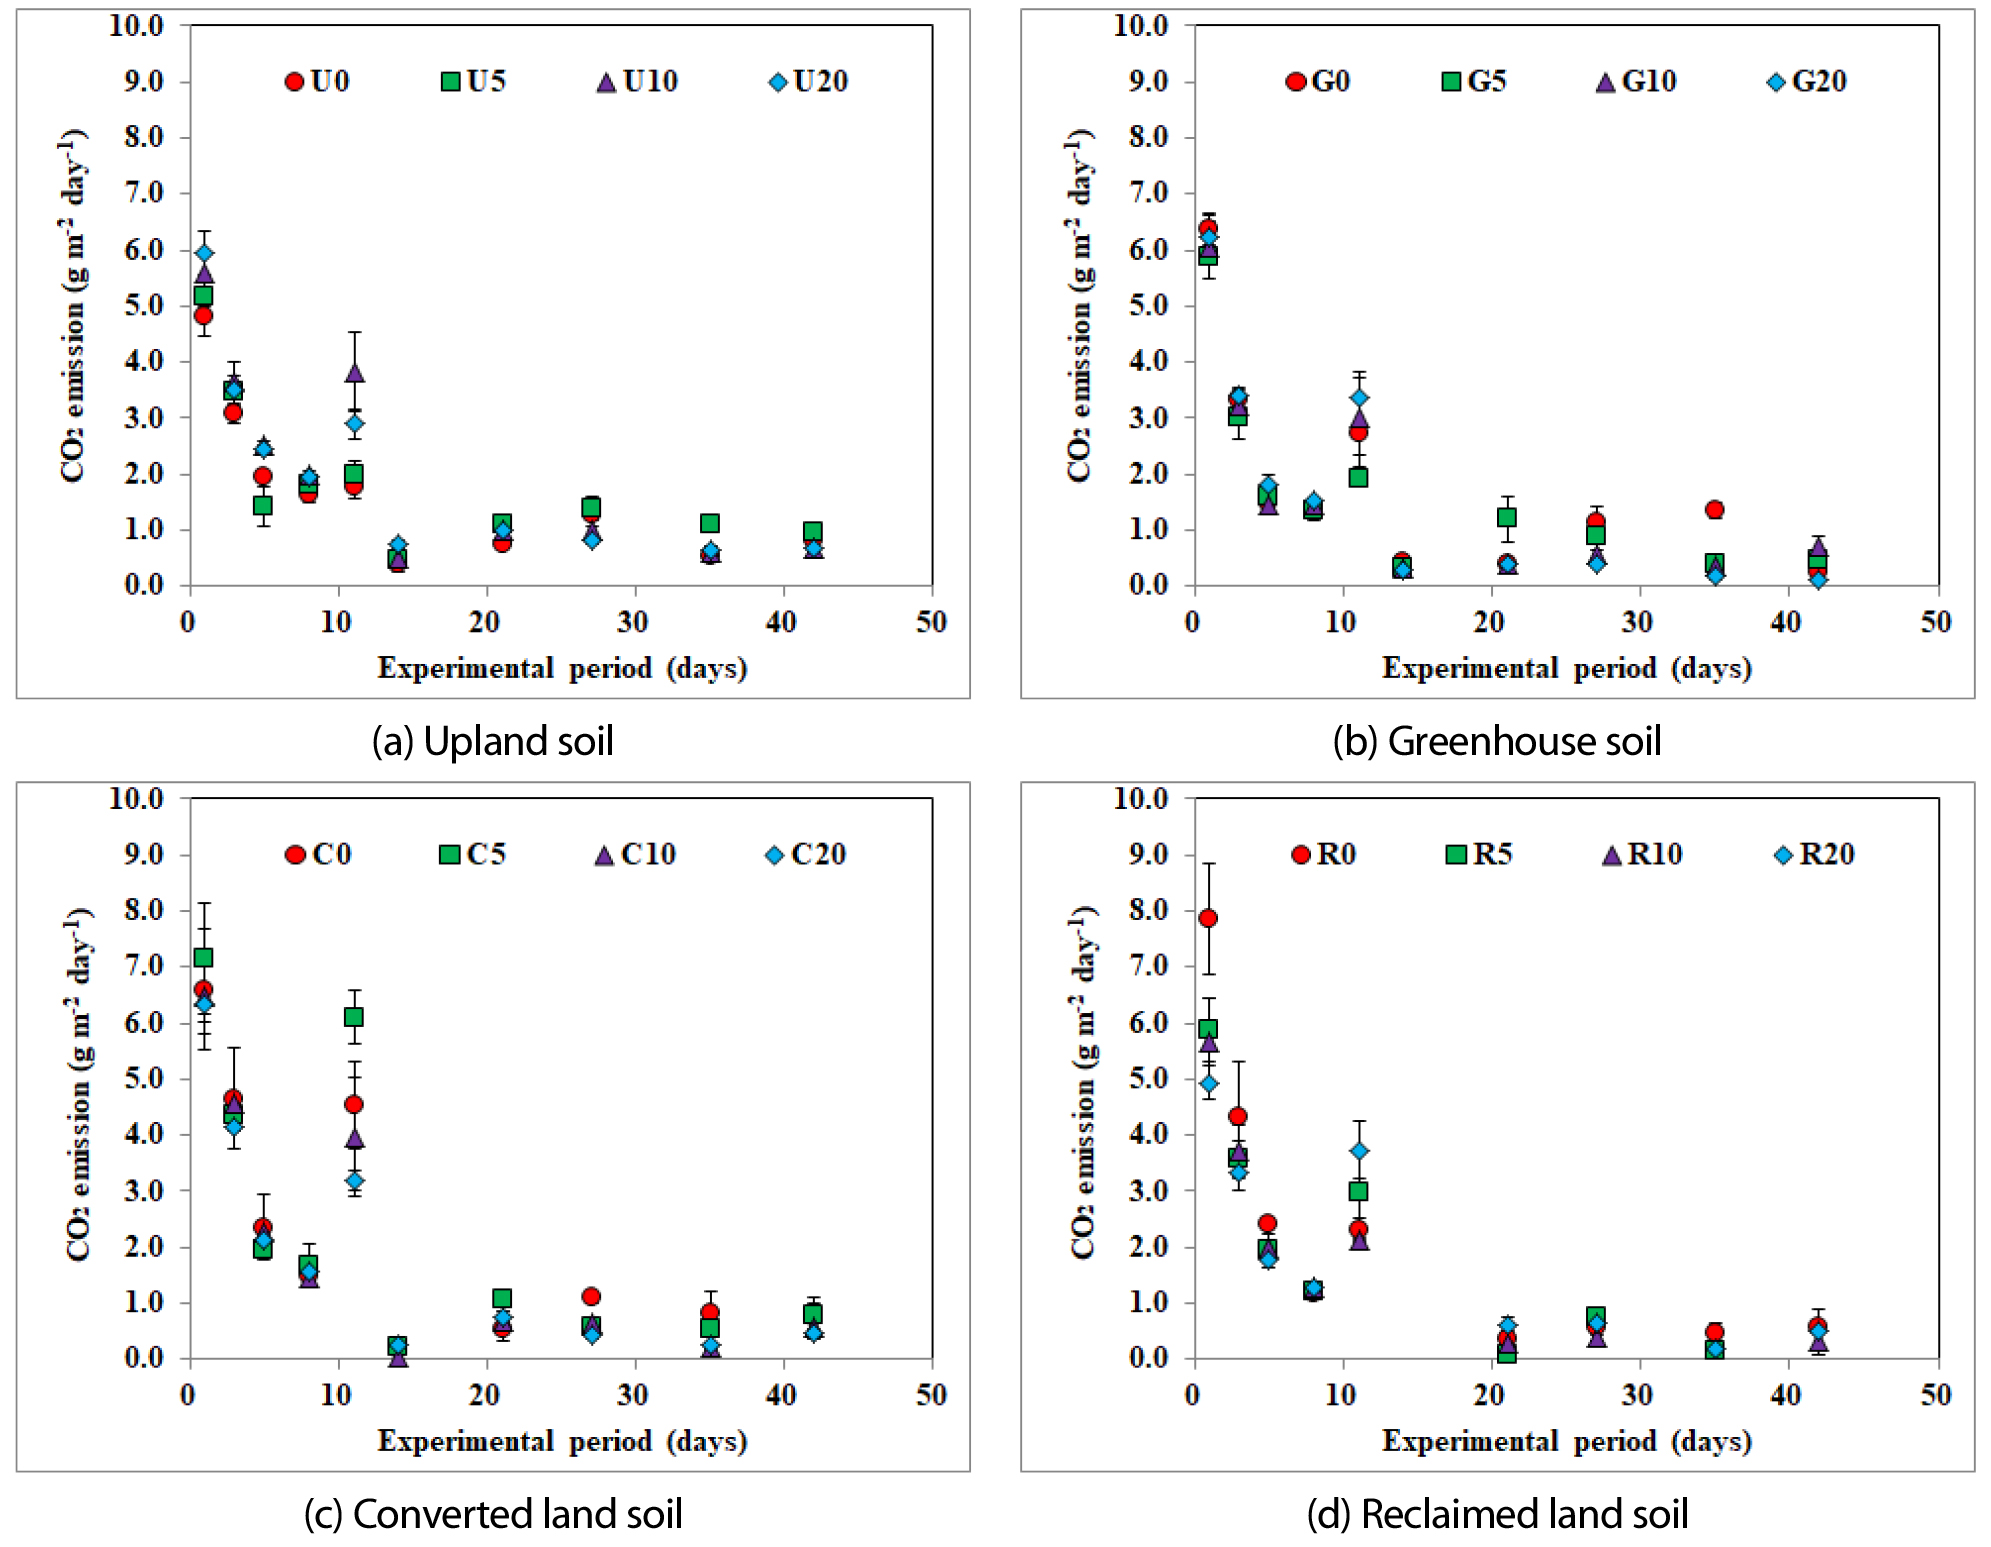
Treatments CO2 emission
(g m-2 day-1)
N2O emission
(mg m-2 day-1)
Cumulative CO2
(g m-2)
Cumulative N2O
(mg m-2)
U U0 1.71 ± 0.24 a 2.74 ± 0.42 b 29.80 ± 2.79 a 52.10 ± 8.39 b
U5 1.99 ± 0.26 a 0.42 ± 1.17 a 34.33 ± 3.54 a 21.15 ± 3.34 a
U10 2.14 ± 0.33 a 1.73 ± 0.28 a 37.76 ± 3.73 a 31.62 ± 5.06 a
U20 2.07 ± 0.30 a 0.95 ± 0.14 a 36.69 ± 3.34 a 17.36 ± 2.80 a
Average 1.98 ± 0.14 A§ 1.65 ± 0.15 A 34.64 ± 1.69 A 30.56 ± 2.92 A
G G0 1.89 ± 0.33 a 2.33 ± 0.46 a 33.13 ± 2.97 a 43.60 ± 3.80 c
G5 1.70 ± 0.30 a 3.25 ± 0.68 ab 30.63 ± 2.75 a 60.88 ± 6.27 d
G10 1.76 ± 0.34 a 1.67 ± 0.36 ab 30.75 ± 2.52 a 31.19 ± 4.04 b
G20 1.77 ± 0.36 a 1.18 ± 0.21 b 31.93 ± 2.50 a 22.45 ± 2.69 a
Average 1.78 ± 0.16 A 2.11 ± 0.24 AB 31.63 ± 1.33 A 39.53 ± 2.54 AB
C C0 2.31 ± 0.41 a 8.33 ± 1.22 c 39.97 ± 3.70 a 161.35 ± 25.81 c
C5 2.44 ± 0.45 a 6.53 ± 1.21 bc 42.70 ± 3.85 a 123.13 ± 15.73 bc
C10 2.09 ± 0.40 a 5.06 ± 0.97 ab 36.91 ± 3.00 a 93.95 ± 11.84 ab
C20 1.95 ± 0.36 a 2.99 ± 0.54 a 34.83 ± 2.78 a 55.56 ± 6.80 a
Average 2.20 ± 0.20 A 5.73 ± 0.53 B 38.60 ± 1.68 B 108.50 ± 8.93 A
R R0 1.99 ± 0.45 a 4.42 ± 0.93 b 35.10 ± 2.48 b 83.19 ± 13.57 b
R5 1.63 ± 0.36 a 3.15 ± 0.72 ab 29.26 ± 2.22 a 59.90 ± 8.09 ab
R10 1.56 ± 0.34 a 2.97 ± 0.65 ab 27.91 ± 2.01 a 57.15 ± 9.08 ab
R20 1.69 ± 0.31 a 1.89 ± 0.40 a 29.66 ± 2.56 a 35.54 ± 4.30 a
Average 1.72 ± 0.18 A 3.10 ± 0.36 C 30.48 ± 1.18 A 58.95 ± 4.87 C
Effect Probability > F
Soil type (A) p = 0.212 p < 0.000p < 0.001p < 0.000
Biochar input amount (B) p = 0.975 p < 0.000p = 0.913 p < 0.000
(A) × (B) p = 0.972 p = 0.066 p = 0.237 p < 0.001

Values are the means with standard errors in parentheses (n = 30), and those followed by a different letter are significantly different at α = 0.05 between treatments.

ANOVA was performed for all the treatments.

The bold indicates that the effects are significant at α = 0.05.

§A result of Duncan’s multiple range test by soil type (p < 0.05).

A result of Duncan’s multiple range test by biochar input amount (p < 0.05).

https://static.apub.kr/journalsite/sites/ksssf/2021-054-04/N0230540408/images/ksssf_54_04_08_F1.jpg
Fig. 1.

CO2 emission by soil type according to biochar application under closed chamber condition during the 42 days. Values are the means of triplicate and vertical bars are standard errors of the means (n = 3). Error bars are often too small to be depicted. Detailed treatments are provided in Table 3.

42일간 토양유형별 CO2 배출량을 분석한 결과 개간지 토양에서 평균 2.20 g m-2 day-1로 가장 높게 나타났으며, 밭 토양 1.98 g m-2 day-1, 시설재배지 토양 1.78 g m-2 day-1, 간척지 토양 1.72 g m-2 day-1 순으로 분석되었다. 바이오차 투입량에 따른 CO2 배출량을 분석한 결과 20 ton ha-1 처리구에서 1.87 g m-2 day-1로 가장 낮게 나타났고, 10 ton ha-1 처리구 1.88 g m-2 day-1, 5 ton ha-1 처리구 1.94 g m-2 day-1, 대조구 1.97 g m-2 day-1 순으로써, 바이오차 투입 비율이 높을수록 CO2 배출량이 낮아지는 것으로 분석되었다.

N2O 배출량

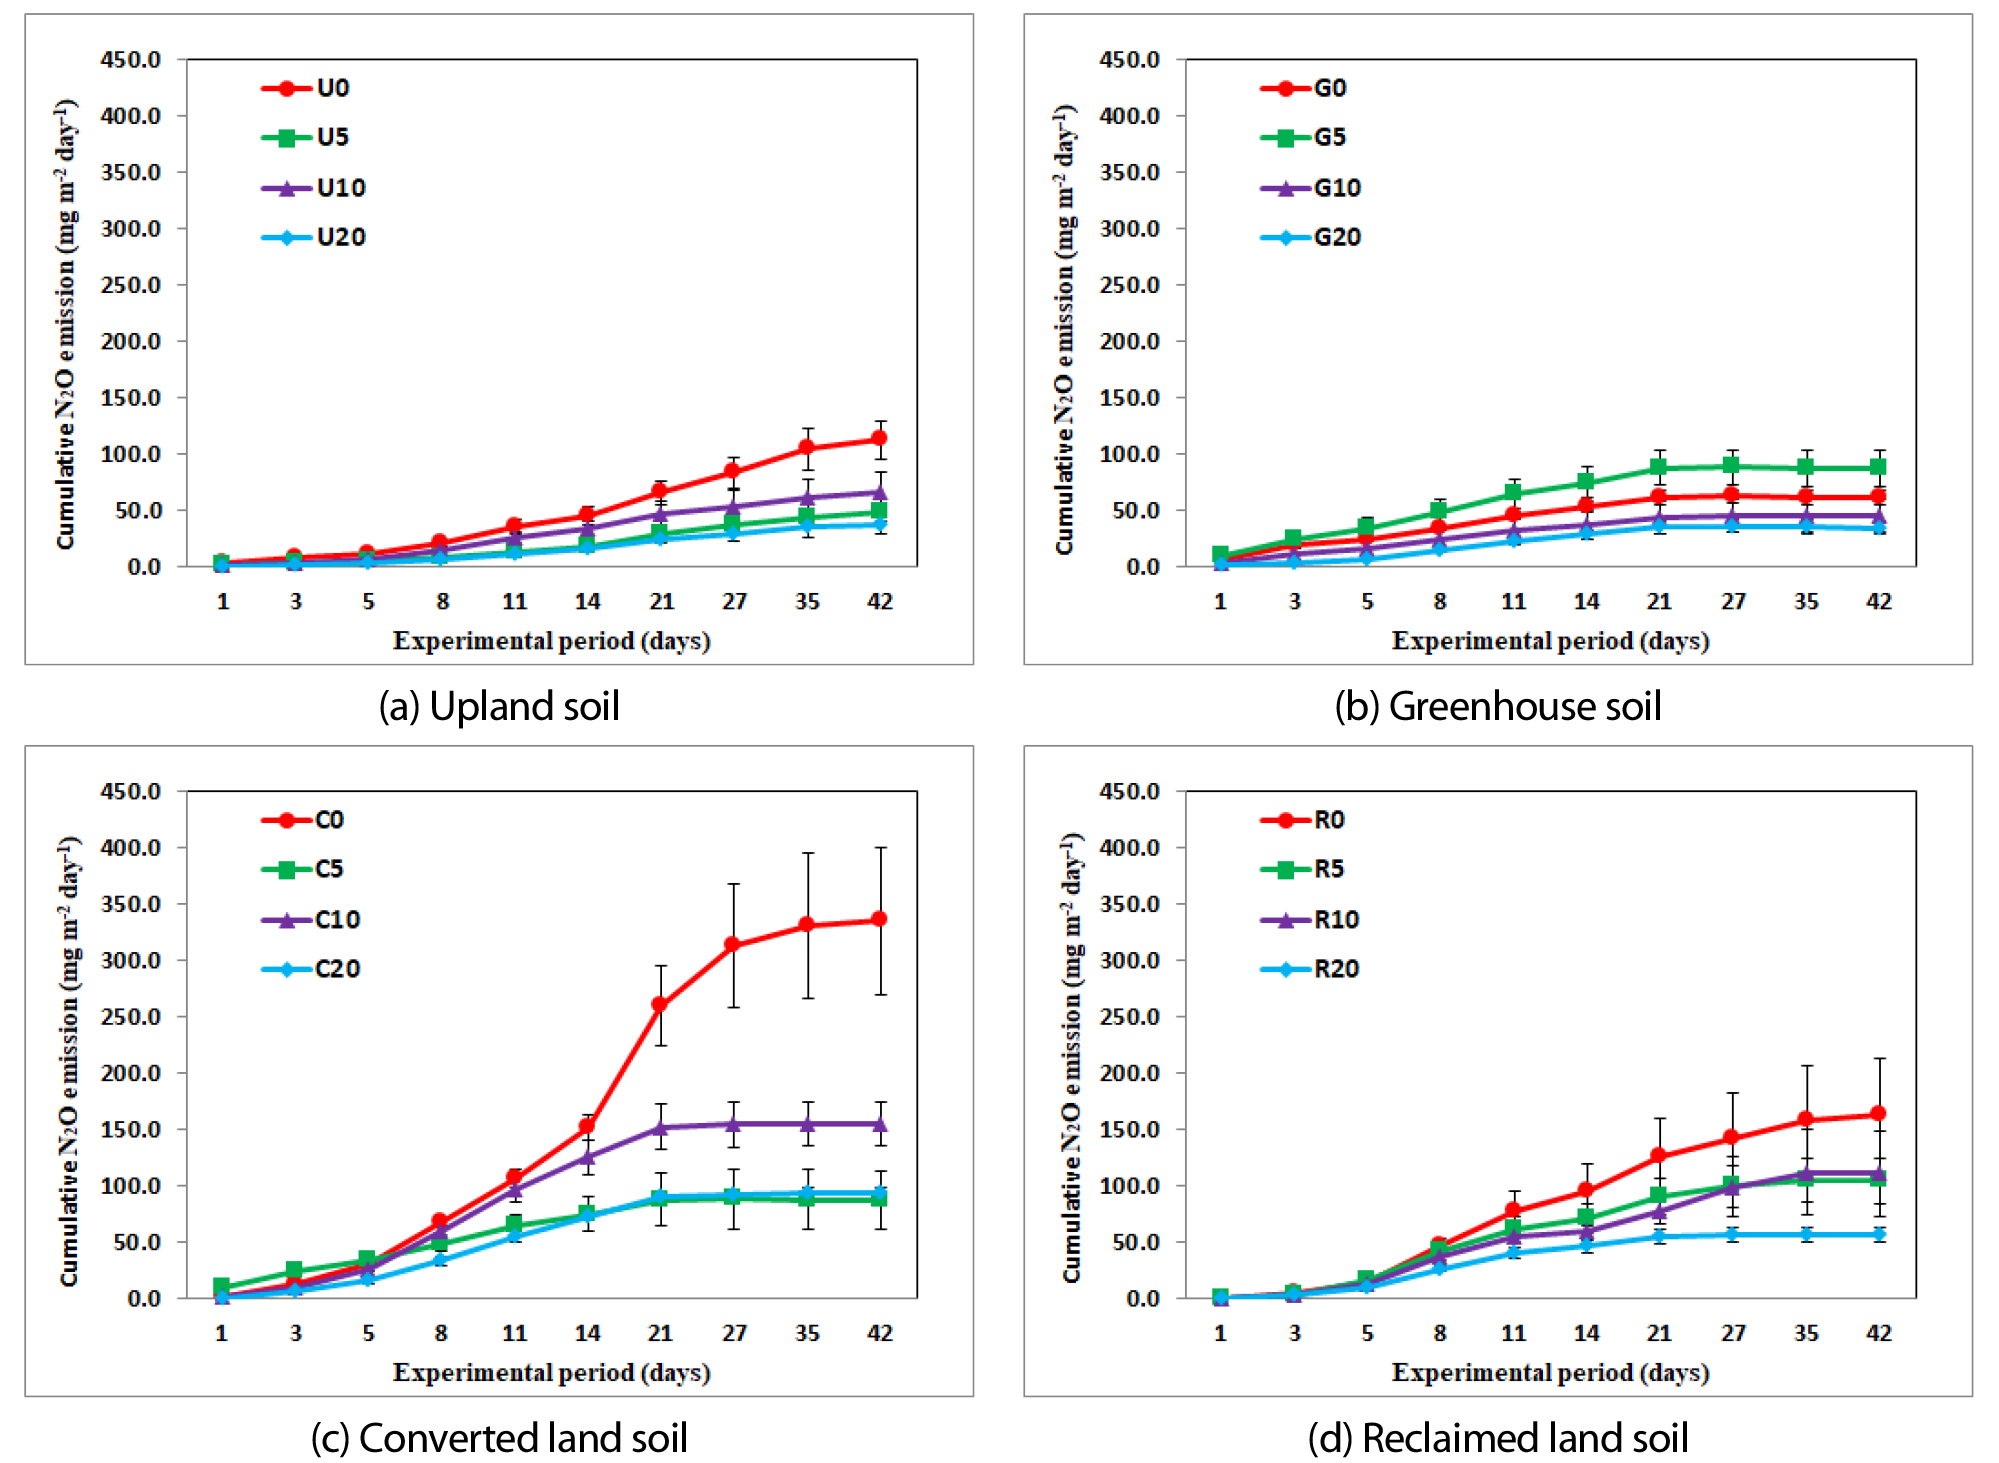
4가지 농경지 토양에 대해 바이오차 처리구별 N2O 배출량을 분석한 결과 토양유형과 바이오차 투입량에 따라 N2O 배출량이 유의미하게 증가 (p < 0.000) 하는 것으로 분석되었다 (Table 6). 42일 중 밭 토양, 개간지 토양, 간척지 토양에서는 8일차에 N2O 배출량이 가장 높게 나타났으며, 시설재배지 토양에서는 1일차에 가장 높게 나타났다 (Fig. 2). 42일간 토양유형별 N2O 배출량을 분석한 결과 개간지 토양에서 평균 5.73 g m-2 day-1로 가장 높게 나타났으며, 간척지 토양 3.10 g m-2 day-1, 시설재배지 토양 2.11 g m-2 day-1, 밭 토양 1.65 g m-2 day-1 순으로 분석되었다. 바이오차 투입량에 따른 N2O 배출량을 분석한 결과 20 ton ha-1 처리구에서 1.75 g m-2 day-1로 가장 낮게 나타났고, 10 ton ha-1 처리구 2.86 g m-2 day-1, 5 ton ha-1 처리구 3.52 g m-2 day-1, 대조구 4.45 g m-2 day-1 순으로써, 바이오차 투입 비율이 높을수록 N2O 배출량이 낮아지는 것으로 분석되었다 (Table 6).
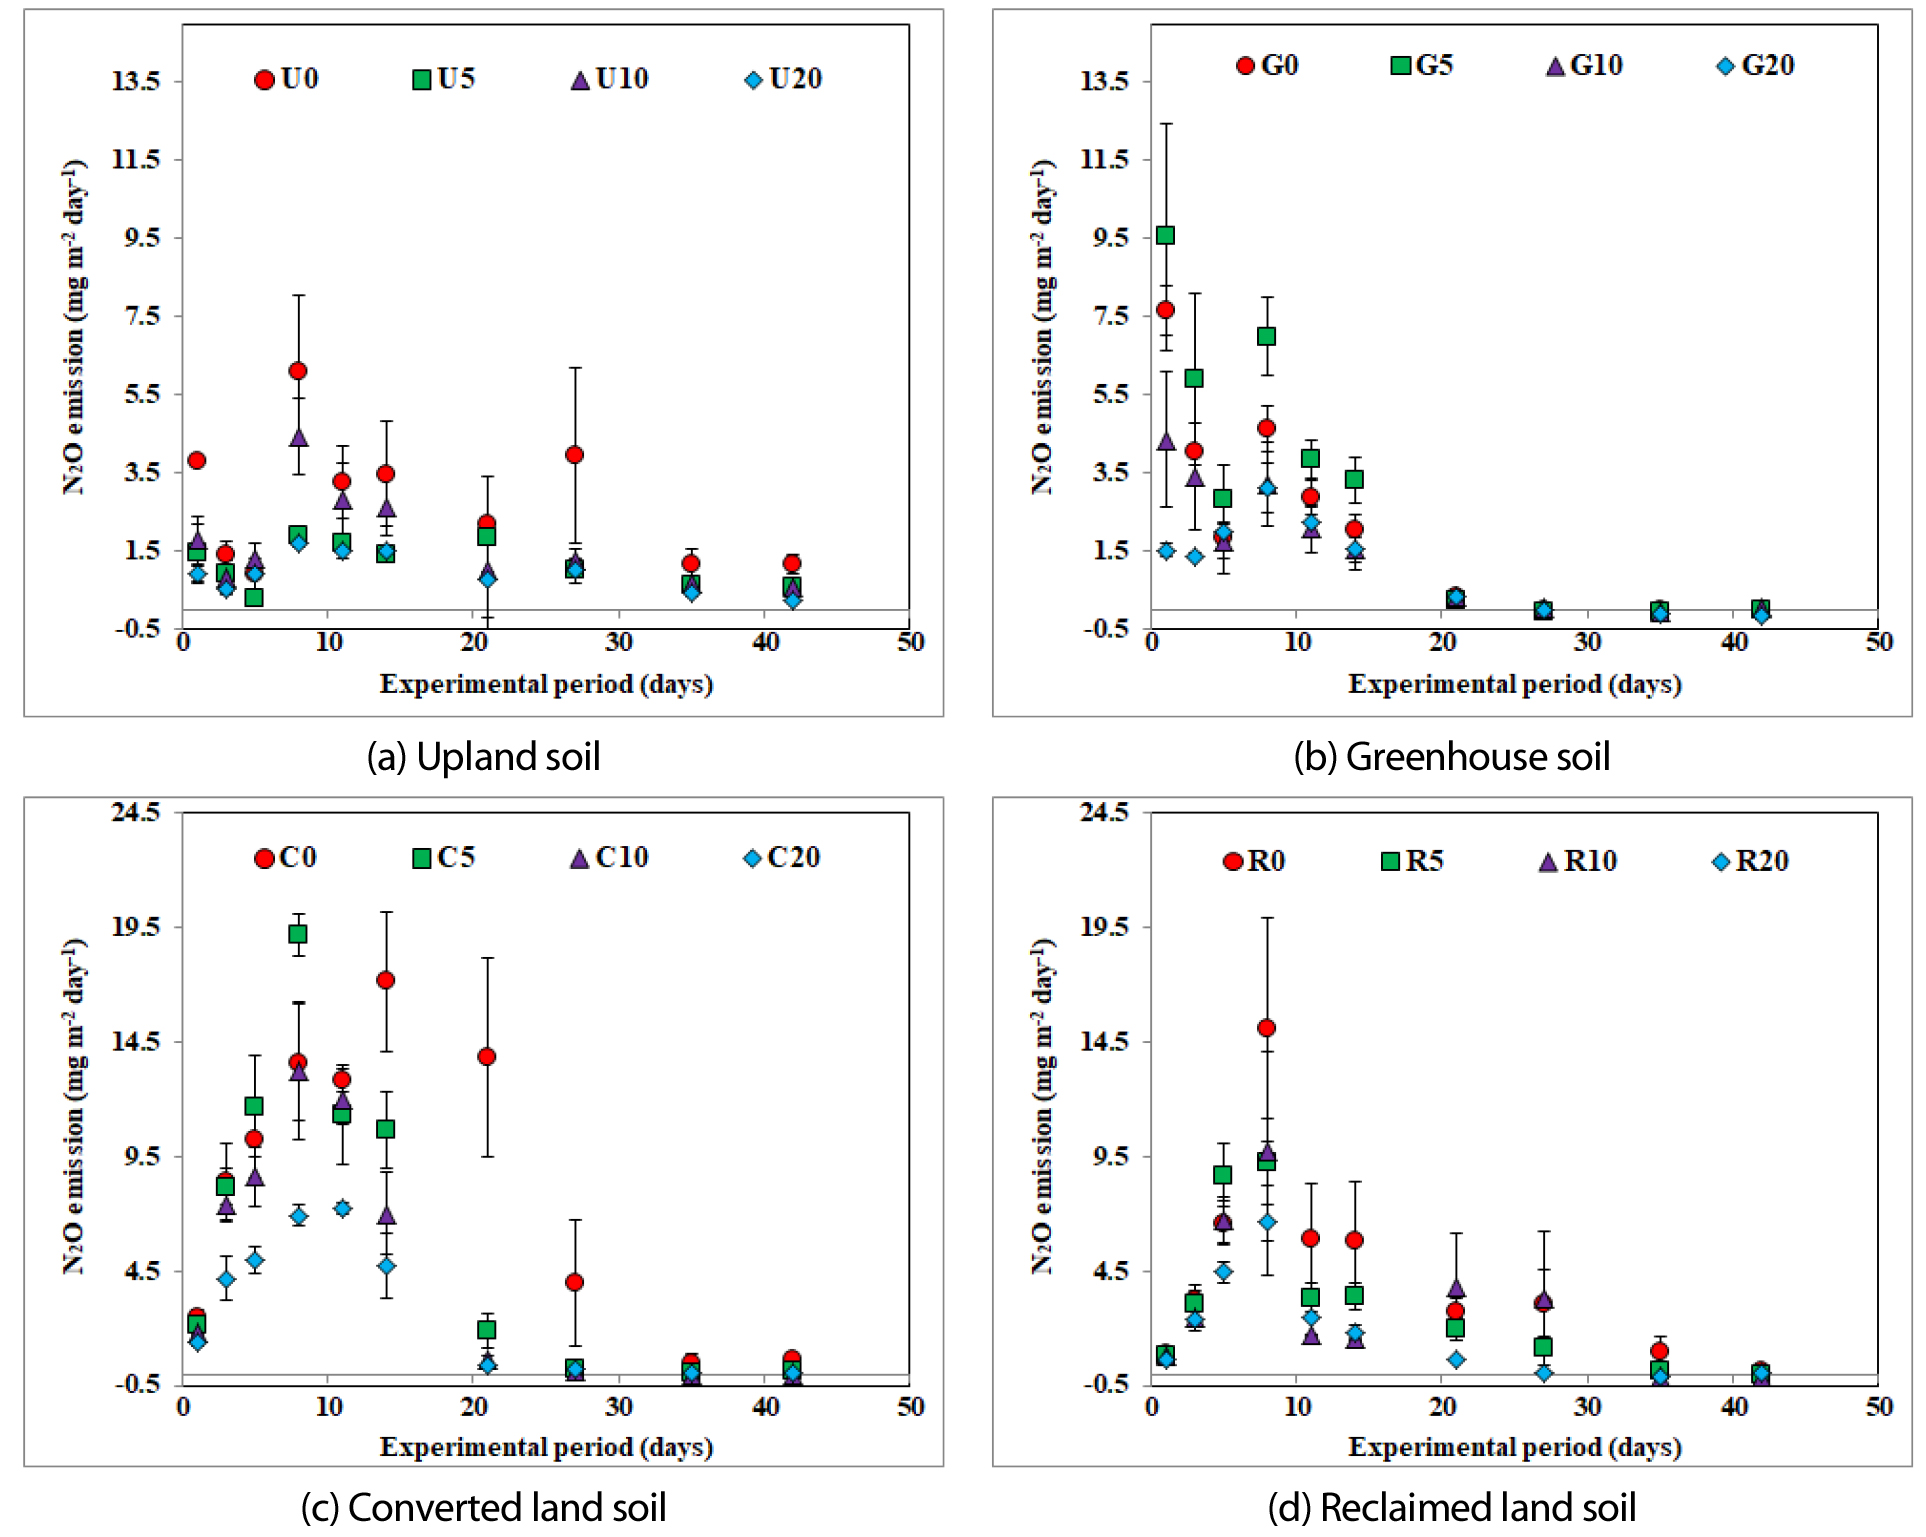
https://static.apub.kr/journalsite/sites/ksssf/2021-054-04/N0230540408/images/ksssf_54_04_08_F2.jpg
Fig. 2.

N2O emission by soil type according to biochar application under closed chamber condition during the 42 days. Values are the means of triplicate and vertical bars are standard errors of the means (n = 3). Error bars are often too small to be depicted. Detailed treatments are provided in Table 3.

온실가스 (CO2, N2O) 누적 배출량

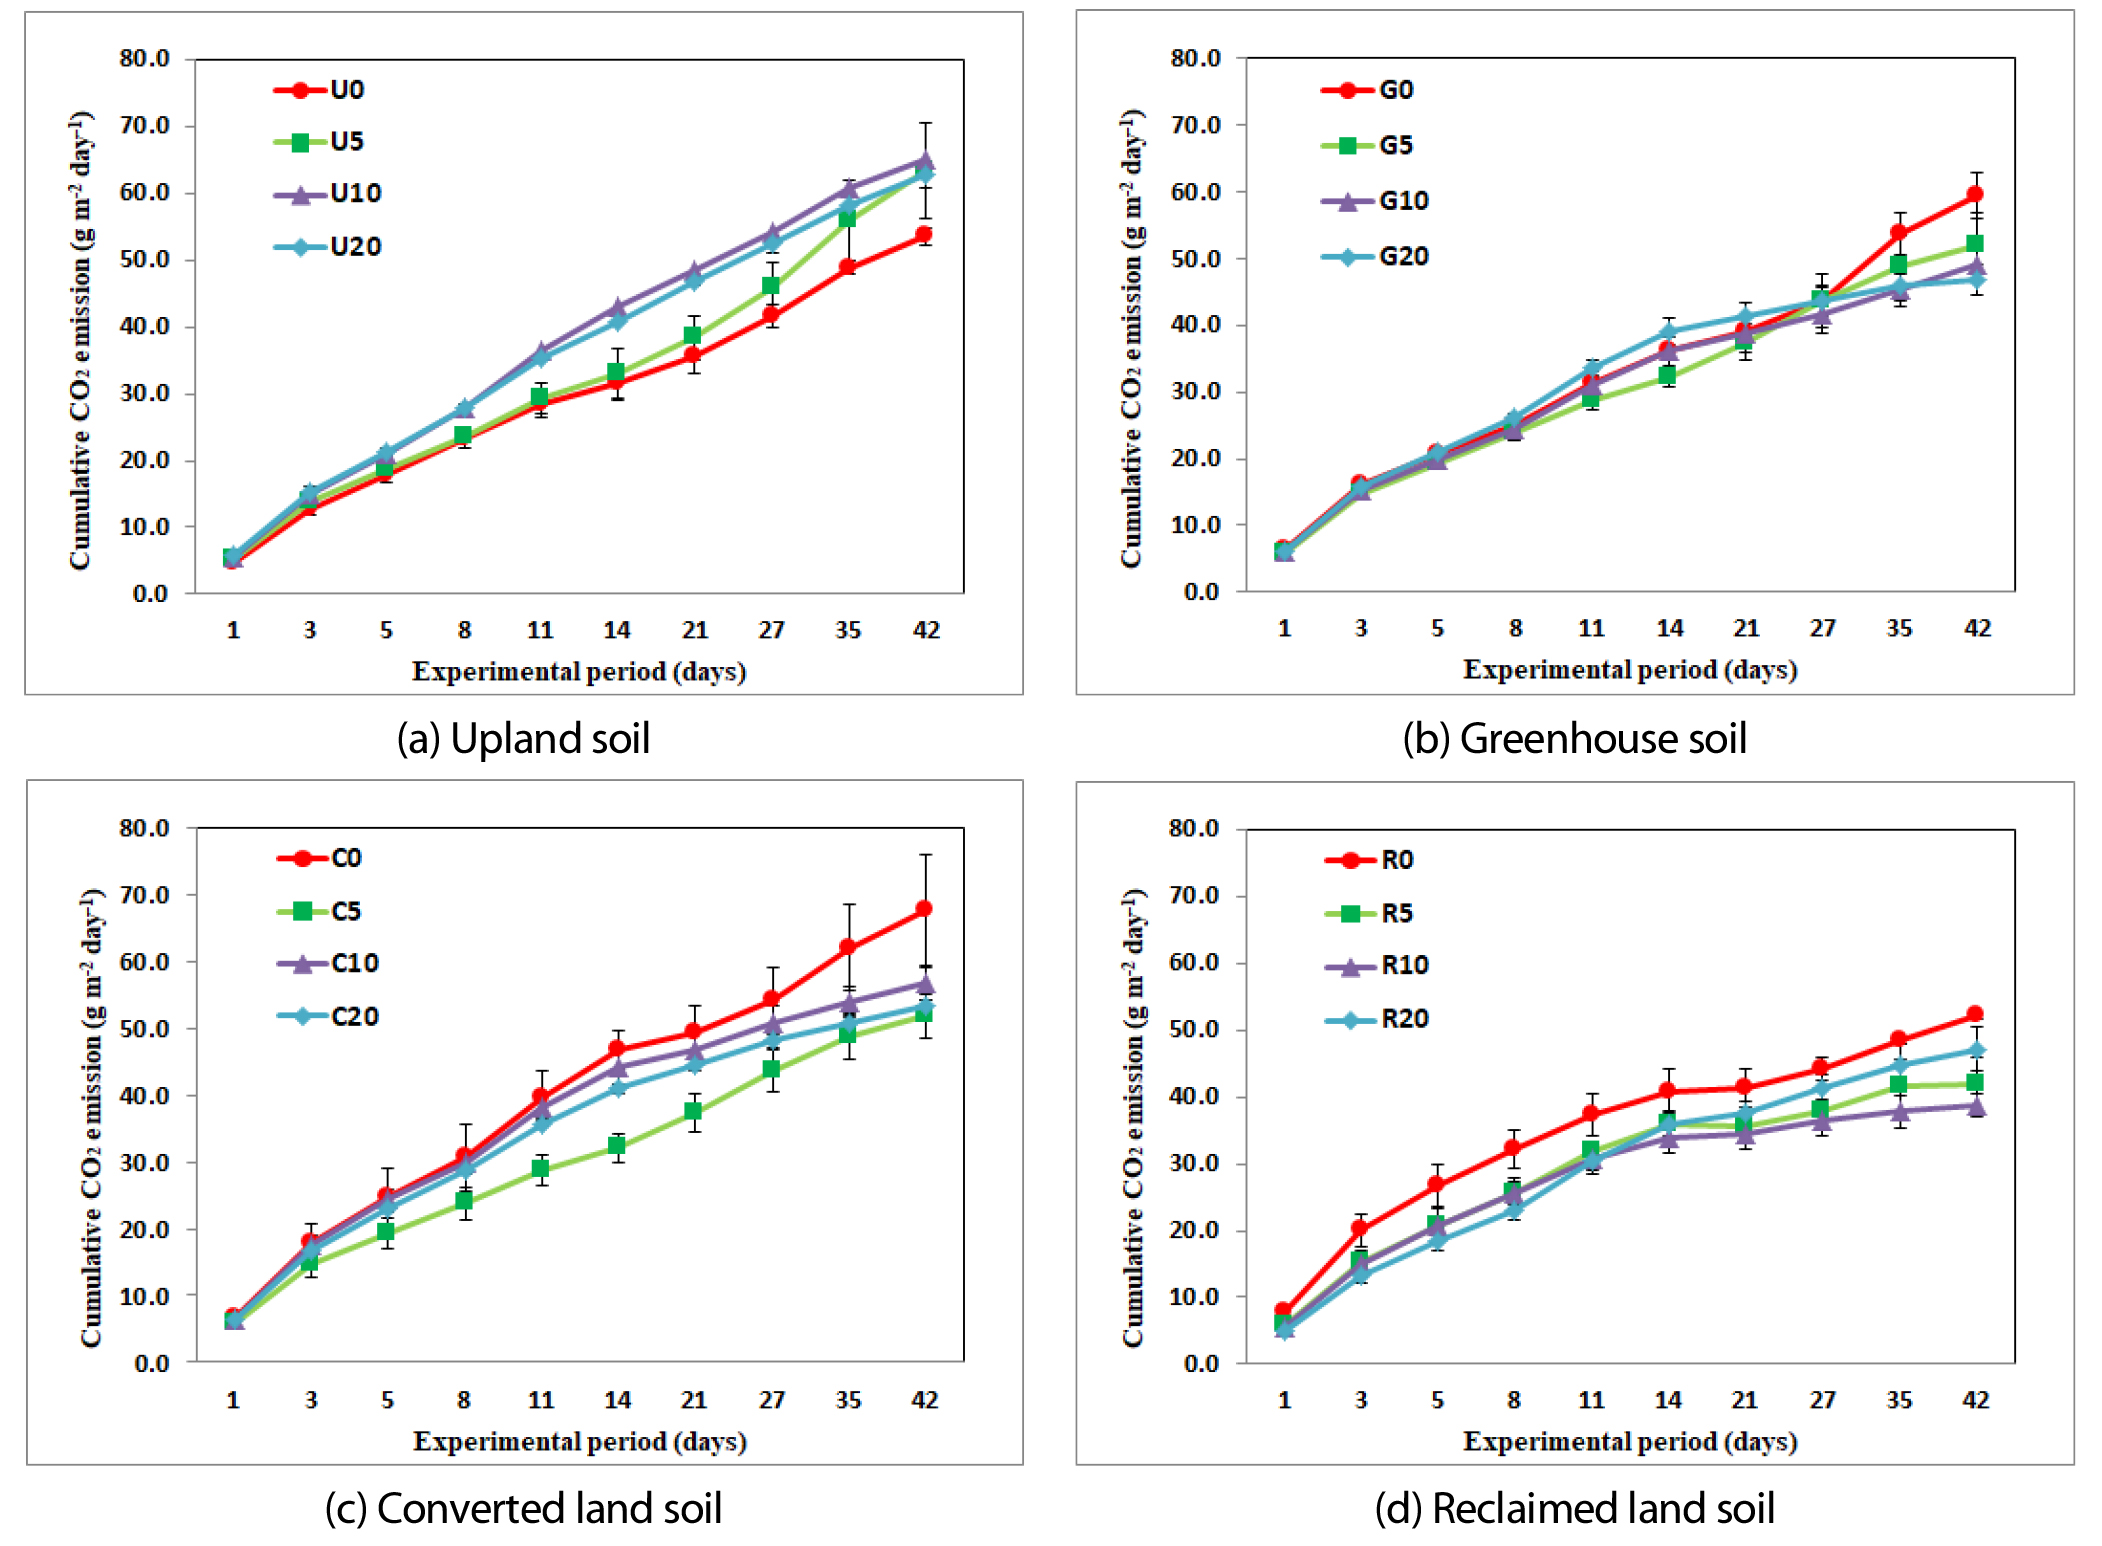
누적 CO2 배출량은 토양유형별로 유의미한 차이 (p < 0.001)가 있는 것으로 나타났으나, 바이오차 투입량과는 유의미한 차이가 나타나지 않았다 (Table 6). 42일째 누적 CO2 배출량은 바이오차를 투입하지 않은 U0, G0, C0, G0 처리구에서 각각 53.61, 59.32, 67.58, 52.14 g m-2이었고, 바이오차를 5 ton ha-1를 투입한 U5, G5, C5, G5 처리구에서는 각각 63.31, 51.84, 69.87, 41.97 g m-2이었다. 바이오차 10 ton ha-1를 투입한 U10, G10, C10, G10 처리구에서는 각각 65.22, 49.05, 56.83, 38.73 g m-2이었다. 바이오차 20 ton ha-1를 투입한 U20, G20, C20, G20 처리구에서는 각각 62.80, 46.81, 53.41, 47.21 g m-2이었다. 밭 토양에서는 바이오차를 처리하지 않은 U0에서 53.61 g m-2로 가장 낮게 나타났고, 시설재배지와 개간지 토양에서는 바이오차를 20 ton ha-1처리한 처리구의 누적 CO2 배출량이 46.81, 53.41 g m-2로 가장 낮았다. 간척지 토양에서는 바이오차를 10 ton ha-1처리한 처리구의 누적 CO2 배출량이 38.73 g m-2로 가장 낮게 분석되었다 (Fig. 3).

https://static.apub.kr/journalsite/sites/ksssf/2021-054-04/N0230540408/images/ksssf_54_04_08_F3.jpg
Fig. 3.

Cumulative total CO2 emission by soil type according to biochar application under closed chamber condition during the 42 days.

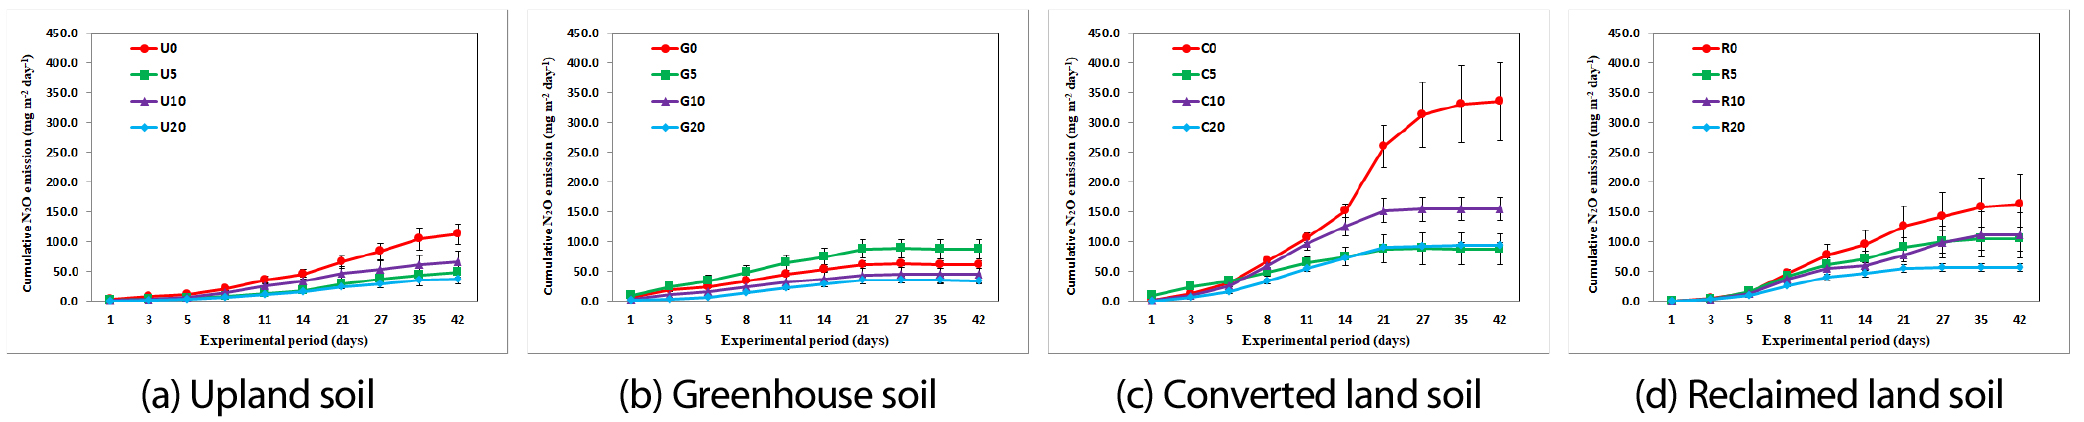
누적 N2O 배출량은 토양유형별로 유의미한 차이가 있는 것으로 나타났으며, 바이오차 투입량과도 유의미한 차이 (p < 0.000)가 있는 것으로 나타났다 (Table 6). 42일째 누적 N2O 배출량은 바이오차를 투입하지 않은 U0, G0, C0, G0 처리구에서 각각 112.73, 62.16, 334.85, 162.86 mg m-2이었고, 바이오차를 5 ton ha-1를 투입한 U5, G5, C5, G5 처리구에서는 각각 48.89, 87.74, 208.42, 105.17 mg m-2이었다. 바이오차 10 ton ha-1를 투입한 U10, G10, C10, G10 처리구에서는 각각 65.86, 45.74, 155.01, 105.17 mg m-2이었다. 바이오차 20 ton ha-1를 투입한 U20, G20, C20, G20 처리구에서는 각각 38.21, 35.00, 93.46, 56.83 mg m-2이었다. 누적 N2O 배출량은 시설재배지 토양을 제외하면 바이오차를 투입하지 않은 U0, C0, R0 처리구에서 각각 112.73, 208.42, 162.86 mg m-2로 가장 높게 나타났다. 4가지 농경지 토양 모두 바이오차를 20 ton ha-1처리한 처리구의 누적 N2O 배출량이 가장 낮게 나타났다 (Fig. 4).

https://static.apub.kr/journalsite/sites/ksssf/2021-054-04/N0230540408/images/ksssf_54_04_08_F4.jpg
Fig. 4.

Cumulative total N2O emission by soil type according to biochar application under closed chamber condition during the 42 days.

Discussion

바이오차는 농경지 토양 개선에 긍정적인 영향이 있지만 (Chen et al., 2020), 그 효과는 바이오차 공급 원료 (Liu et al., 2011, 2016), 공급량 (Amoakwah et al., 2020; Duan et al., 2021), 제조 온도 (Han et al., 2021) 토양 조건 (Van Zwieten et al., 2014; Nguyen et al., 2020) 등에 따라 상이하다. 그럼에도 분해에 대한 저항성이 있는 바이오차를 토양에 투입하면 토양 탄소 함량이 증가하여 (Lee et al., 2020), 토양의 물리, 화학, 생물학적 성질 회복을 유도할 수 있다고 평가되고 있다 (Bai et al., 2015; El-Naggar et al., 2018; Han et al., 2021).

바이오차의 여러 가지 효과 중 가장 높게 평가되는 것이 탄소 저장 및 온실가스 배출량을 저감할 수 있는 기능이라고 할 수 있다 (Jeffery et al., 2016; Chen et al., 2020; Deng et al., 2020). 토양에 볏짚과 같은 유기물질을 직접 투입하면 생물학적 분해의 영향으로 CO2 배출량이 크게 증가한다 (Liu et al., 2011). 그러나 바이오차는 생물학적 분해의 영향을 받지 않는 난분해성 물질이기 때문에 (Nichols et al., 2000; Ascough et al., 2010), 토양탄소 함량은 증가하지만 분해가 되지 않아, 직접적인 CO2 배출에 큰 영향을 주지 않는다 (Lee et al., 2020). 본 연구에서도 바이오차 투입량에 따라 CO2 배출량의 차이를 분석한 결과 1.5 - 5.1% 더 낮게 나타났다. Spokas et al. (2009)은 우드칩 바이오차가 대조군 토양에 비해 CO2 배출을 억제하는 효과가 있다는 연구결과를 발표했는데, 이는 본 연구결과와 매우 유사하다고 판단된다. 누적 CO2 배출량도 밭 토양을 제외하면 대조구 대비 바이오차를 적용한 토양에서 21.1 - 25.7% 낮게 나타났다. 이는 논토양에서 볏짚을 적용한 대조구와 바이오차를 적용한 처리구간의 누적 CO2 배출량을 실험한 Liu et al. (2011)의 연구결과와 동일하게 분석되었다.

다만, 기존 배추를 재배했던 밭 토양의 경우 대조구보다 바이오차 처리구에서 CO2 배출량이 높게 나타났다. 바이오차는 점화효과 (priming effect)로 인하여 단기간은 CO2 배출이 증가할 수 있는데 (Woolf and Lehmann, 2012), 이는 바이오차가 토양 내 미생물의 성장을 촉진시킴에 따라 호흡률이 증가하고, 결국 CO2 배출량에 영향을 미치기 때문이다 (Woo, 2015; Dai et al., 2021). 장기적으로는 점차 CO2 배출량이 낮아질 것으로 사료된다 (Woolf and Lehmann, 2012). 일반적으로 토양에서 배출되는 CO2는 탄소 함량에 비례하여 증가하는데 (Sistani et al., 2011), 바이오차를 투입한 시설재배지, 개간지, 간척지 토양에서는 탄소 함량이 증가함에도 불구하고 CO2 배출량이 증가하지 않았다. 이는 타 연구의 결과와도 유사한 것으로 나타났다 (Liu et al., 2011; Ameloot et al., 2013; Lee et al., 2020). 다만, 밭 토양의 경우 기존 농경으로 인하여 기본적인 탄소 함량이 높았고, 다량의 바이오차가 투입됨에 따라 CO2 배출량이 증가된 것으로 사료된다. 즉, 바이오차 투입으로 토양 내 증가된 탄소는 분해되지 않고 축적되었다고 사료된다. 향후 바이오차의 점화효과를 정량적으로 규명하기 위한 토양미생물과 바이오차 관련 추가 연구가 필요할 것으로 판단된다.

본 연구에서 바이오차 투입량에 따라 N2O 배출량의 차이를 분석한 결과 대조구에 비해 바이오차를 투입한 처리구에서 20.9 - 60.7% 낮게 분석되었다. 누적 N2O 배출량도 대조구 대비 바이오차를 투입한 토양에서 43.7 - 72.1% 낮게 나타났다. Cayuela et al. (2014)의 연구에서 바이오차를 활용한 N2O 배출량 평가 연구 261건에 대해 메타분석을 수행한 결과, 바이오차 투입에 의해 토양 N2O 배출이 평균 54% 감소한 것과 유사하게 나타났다. 또한 Ameloot et al. (2013)은 700°C에서 제조한 바이오차가 N2O를 50% 감축하였다고 보고하였고, Shaukat et al. (2019)은 질소만 처리한 대조구와 바이오차를 중복 처리한 실험에서 49 - 61%의 N2O를 감축할 수 있었다는 보고와 본 연구 결과가 유사한 것으로 나타났다. 이러한 감축 원인으로는 높은 C/N 비율의 바이오차가 토양에 투입되었을 때, 질소 부동화를 유발하여 토양에서 배출되는 N2O를 억제하기 때문이다 (Lehmann et al., 2006; Liu et al., 2011). 이 연구에서 사용된 왕겨 바이오차의 경우 C/N 비율이 99.5로 바이오차 투입량에 따라 비례하여 N2O 배출량이 점차 감소한 것으로 판단된다. 이외에도 바이오차는 무기태 질소 흡착 (van Zwieten et al., 2010), 완전 탈질 (Uchida et al., 2019) 등 다양한 기작이 복합적으로 작용하여 N2O 배출을 저감하는 것으로 평가되고 있다 (Case et al., 2015; Li et al., 2021).

본 연구에서 바이오차를 투입함에 따라 시설재배지 토양을 제외하고 모두 N2O 배출량이 저감되었다. 시설재배지 토양의 경우 일반 밭 토양, 개간지 토양에 비해 다량의 양분이 투입되는 경향이 높다. 이 때문에 EC 함량은 8배 이상, NH4+ 함량은 2배 이상 높은 화학적 특성을 나타낸 바 (Table 2), 바이오차 투입에 따른 일정 패턴을 보이지 않은 것으로 판단된다. 이러한 원인을 해석하기 위해, 동위원소기법 등을 활용해 과정별 기여도를 구명하는 향후 연구가 필요할 것으로 사료된다.

바이오차의 N2O 배출량 저감 효과는 많은 연구들을 통해 증명된 바 있다 (Ameloot et al., 2013; Liu et al., 2014; Lee et al., 2020). 이 연구에서도 바이오차 투입량이 증가할수록 N2O 배출량이 낮아져, 20 ton ha-1 투입한 처리구에서 N2O 배출량이 가장 낮았다. 하지만, 바이오차 투입 비율이 높을수록 탄소 격리가 증가하지만 (Amoakwah et al., 2020), 경제적인 측면에서 생산 및 유통 비용이 많이 들고, 토양 비옥도가 감소할 수 있다 (Beesley et al., 2011). 따라서 작물 생육과 온실가스배출량 억제하기 위해서는 적정량의 바이오차를 투입하는 것이 바람직할 것으로 판단된다.

Conclusions

본 연구는 밭 토양, 시설재배지 토양, 개간지 토양, 간척지 토양을 대상으로 바이오차를 0, 5, 10, 20 ton ha-1을 투입하여 온실가스 발생량을 비교 ‧ 분석하였다. 토양의 특성에 따라 바이오차의 적용 효과가 다르고, 이에 온실가스 배출양상이 상이함으로 각각 농경지 토양별 바이오차의 투입량에 따른 효과를 평가하였다.

CO2 배출량은 밭 토양을 제외하면 바이오차를 투입한 처리구에서 1.5 - 5.1% 가량 감소하는 것으로 분석되었으나, 처리구별 유의미한 차이는 나타나지 않았다. N2O 배출량의 경우 대조구 대비 20.9 - 60.7% 유의미하게 감소하는 것으로 나타남에 따라 바이오차의 N2O 배출 억제 효과가 증명되었다. 누적 CO2 배출량도 대조구 대비 바이오차를 적용한 토양에서 21.1 - 25.7% 낮게 나타났으나, 바이오차 투입량과는 유의미한 차이가 없었다. 다만, 개간지 토양이 타 유형에 비해 누적 CO2 배출량이 유의미하게 높았다. 누적 N2O 배출량은 43.7 - 72.1%로 모든 토양 유형에서 바이오차 투입량에 따라 유의미하게 감소하는 것으로 나타났다.

이 연구에서는 바이오차를 토양에 투입했을 때, CO2 배출량보다는 N2O 배출량 감소에 더 효과적인 것으로 분석되었다. 따라서 농경지에서 토양 내 탄소를 저장하고, N2O 배출량을 저감하기 위해서는 바이오차를 활용하는 것이 바람직할 것으로 판단된다. 본 연구에서는 바이오차의 종류가 한정적이고, 투입량에 따른 장기적인 효과에 대해서는 수행하지 못한데 한계가 있다. 그러나 다양한 농경지 토양유형별 T-C 및 T-N 증가, C/N 비율 증가, N2O 배출저감 효과를 확인한 것에 큰 의미가 있다. 지속가능한 농업 측면에서 향후 바이오차를 활용하여 대기 중 N2O 배출을 억제하고, 작물 생산에 긍정적인 영향을 줄 수 있도록 장기 모니터링 연구가 필요할 것으로 사료된다.

Acknowledgements

This work was carried out by the support of Cooperative Research Program for Agriculture Science & Technology Development (PJ015568012021), Rural Development Administration, Republic of Korea.

References

1
Aguilar-Chavez, A., M. Díaz-Rojas, M.R. Cardenas-Aquino, L. Dendooven, and M. Luna-Guido. 2012. Greenhouse gas emissions from a wastewater sludge-amended soil cultivated with wheat (Triticum spp. L.) as affected by different application rates of charcoal. Soil Biol. Biochem. 52:90-95. 10.1016/j.soilbio.2012.04.022
2
Ameloot, N., S. De Neve, K. Jegajeevagan, G. Yildiz, D. Buchan, Y.N. Funkuin, W. Prins, L. Bouckaert, and S. Sleutel. 2013. Short-term CO2 and N2O emissions and microbial properties of biochar amended sandy loam soils. Soil Biol. Biochem. 57:401-410. 10.1016/j.soilbio.2012.10.025
3
Amoakwah, E., E. Arthur, K.A. Frimpong, S.J. Parikh, and R. Islam. 2020. Soil organic carbon storage and quality are impacted by corncob biochar application on a tropical sandy loam. J. Soils Sediments 20(4):1960-1969. 10.1007/s11368-019-02547-5
4
Ascough, P.L., C.J. Sturrock, and M.I. Bird. 2010. Investigation of growth responses in saprophytic fungi to charred biomass. Isot. Environ. Health Stud. 46:64-77. 10.1080/1025601090338843620229385
5
Bai, S.H., F. Reverchon, C.Y. Xu, Z. Xu, T.J. Blumfield, H. Zhao, L. Van Zwieten, and H.M. Wallace. 2015. Wood biochar increases nitrogen retention in field settings mainly through abiotic processes. Soil Biol. Biochem. 90:232-240. 10.1016/j.soilbio.2015.08.007
6
Beesley, L., E. Moreno-Jiménez, J.L. Gomez-Eyles, E. Harris, B. Robinson, and T. Sizmur. 2011. A review of biochars’ potential role in the remediation, revegetation and restoration of contaminated soils. Environ. Pollut. 159(12):3269-3282. 10.1016/j.envpol.2011.07.02321855187
7
Carvalho, M.T.M., B.E. Madari, L. Bastiaans, P.A.J. van Oort, W.G.O. Leal, A.B. Heinemann, M.A.S. da Silva, A.H.N. Maia, D. Parsons, and H. Meinke. 2016. Properties of a clay soil from 1.5 to 3.5 years after biochar application and the impact on rice yield. Geoderma 276:7-18. 10.1016/j.geoderma.2016.04.013
8
Case, S.D.C., N.P. McNamara, D.S. Reay, A.W. Stott, H.K. Grant, and J. Whitaker. 2015. Biochar suppresses N2O emissions while maintaining N availability in a sandy loam soil. Soil Biol. Biochem. 81(2):178-185. 10.1016/j.soilbio.2014.11.012
9
Cayuela, M.L., L. van Zwieten, B.P. Singh, S. Jeffery, A. Roig, and M.A. Sánchez-Monedero. 2014. Biochar’s role in mitigating soil nitrous oxide emissions: A review and meta-analysis. Agric., Ecosyst. Environ. 191:5-16. 10.1016/j.agee.2013.10.009
10
Chen, K., J. Peng, J. Li, Q. Yang, X. Zhan, N. Liu, and X. Han. 2020. Stabilization of soil aggregate and organic matter under the application of three organic resources and biochar-based compound fertilizer. J. Soils Sediments 20(10):3633-3643. 10.1007/s11368-020-02693-1
11
Clough, T., L. Condron, C. Kammann, and C. Müller. 2013. A review of biochar and soil nitrogen dynamics. Agronomy 3(2):275-293. 10.3390/agronomy3020275
12
Dai, Z., X. Xiong, H. Zhu, H. Xu, P. Leng, J. Li, C. Tang, and J. Xu. 2021. Association of biochar properties with changes in soil bacterial, fungal and fauna communities and nutrient cycling processes. Biochar 3(3):239-254. 10.1007/s42773-021-00099-x
13
Deng, B., L. Zheng, Y. Ma, L. Zhang, X. Liu, X. Zhang, W. Zhang, W. Huang, X. Hu, X. Guo, and E. Siemann. 2020. Effects of mixing biochar on soil N2O, CO2, and CH4 emissions after prescribed fire in alpine meadows of Wugong Mountain, China. J. Soils Sediments 20:3062-3072. 10.1007/s11368-019-02552-8
14
Dong, D., Q. Feng, K. McGrouther, M. Yang, H. Wang, and W. Wu. 2015. Effects of biochar amendment on rice growth and nitrogen retention in a waterlogged paddy field. J. Soils Sediments 15(1):153-162. 10.1007/s11368-014-0984-3
15
Duan, M., G. Liu, B. Zhou, X. Chen, Q. Wang, H. Zhu, and Z. Li. 2021. Effects of modified biochar on water and salt distribution and water-stable macro-aggregates in saline-alkaline soil. J. Soils Sediments 21(6):2192-2202. 10.1007/s11368-021-02913-2
16
El-Naggar, A., Y.M. Awad, X.Y. Tang, C. Liu, N.K. Niazi, S.H. Jien, and S.S. Lee. 2018. Biochar influences soil carbon pools and facilitates interactions with soil: A field investigation. Land Degrad. Dev. 29:2162-2171. 10.1002/ldr.2896
17
Gaskin, J.W., C. Steiner, K. Harris, K.C. Das, and B. Bibens. 2008. Effect of low-temperature pyrolysis conditions on biochar for agricultural use. Trans. ASABE 51:2061-2069. 10.13031/2013.25409
18
Hailegnaw, N.S., F. Mercl, K. Pračke, J. Száková, and P. Tlustoš. 2019. Mutual relationships of biochar and soil pH, CEC, and exchangeable base cations in a model laboratory experiment. J. Soils Sediments 19(5):2405-2416. 10.1007/s11368-019-02264-z
19
Han, L., B. Zhang, L. Chen, Y. Feng, Y. Yang, and K. Sun. 2021. Impact of biochar amendment on soil aggregation varied with incubation duration and biochar pyrolysis temperature. Biochar 3(3):339-347. 10.1007/s42773-021-00097-z
20
Huang, M., L. Yang, H. Qin, L. Jiang, and Y. Zou. 2013. Quantifying the effect of biochar amendment on soil quality and crop productivity in Chinese rice paddies. Field Crops Res. 154:172-177. 10.1016/j.fcr.2013.08.010
21
IPCC (Intergovernmental Panel on Climate Change). 2007. Climate change. In S. Solomon et al. (ed.) The scientific basis. Contribution of Working Group I to the Fourth Assessment Report of the Intergovernmental Panel on Climate Change. Cambridge University Press, New York, USA.
22
IPCC (Intergovernmental Panel on Climate Change). 2014. Climate change 2014: Synthesis report. Contribution of Working Groups I, II and III to the Fifth Assessment Report of the Intergovernmental Panel on Climate Change. IPCC, Geneva, Switzerland. 10.1017/CBO9781107415416
23
Jeffery, S., F.G.A. Verheijen, C. Kammann, and D. Abalos. 2016. Biochar effects on methane emissions from soils: A meta-analysis. Soil Biol. Biochem. 101:251-258. 10.1016/j.soilbio.2016.07.021
24
Karhu, K., T. Mattilab, I. Bergstrom, and K. Regina. 2011. Biochar addition to agricultural soil increased CH4 uptake and water holding capacity-Results from a short-term pilot field study. Agric., Ecosyst. Environ. 140:309-313. 10.1016/j.agee.2010.12.005
25
Lee, M., U. Han, N. Kim, J. Han, K. Shin, and C. Kang. 2003. Analysis on the spatial characteristics caused by the cropland increase using multitemporal landsat images in lower reach of Duman River, Northeast Korea. J. Korea Geogr. Soc. 38(4):630-639.
26
Lee, S.I., G.Y. Kim, H.S. Gwon, J.S. Lee, E.J. Choi, and J.D. Shin. 2020. Effects of different nitrogen fertilizer and biochar applications on CO2 and N2O emissions from upland soil in the closed chamber. Korean J. Soil Sci. Fert. 53(4):431-445.
27
Lehmann, J. 2007. A handful of carbon. Nature 447:143-144. 10.1038/447143a17495905
28
Lehmann, J. and S. Joseph. 2009. Biochar for environmental management: Science and technology. Earthscan, London, UK.
29
Lehmann, J., J. Gaunt, and M. Rondon. 2006. Bio-char sequestration in terrestrial ecosystems: A review. Mitigation Adapt. Strategies Global Change 11:403-427. 10.1007/s11027-005-9006-5
30
Lehmann, J., M.C. Rillig, J. Thies, C.A. Masiello, W.C. Hockaday, and D. Crowley. 2011. Biochar effects on soil biota - A review. Soil Biol. Biochem. 43(9):1812-1836. 10.1016/j.soilbio.2011.04.022
31
Li, J., S. Wang, J. Luo, L. Zhang, Z. Wu, and S. Lindsey. 2021. Effects of biochar and 3,4-dimethylpyrazole phosphate (DMPP) on soil ammonia-oxidizing bacteria and nosZ-N2O reducers in the mitigation of N2O emissions from paddy soils. J. Soils Sediments 21(2):1089-1098. 10.1007/s11368-020-02811-z
32
Liu, J., J. Shen, Y. Li, Y. Su, T. Ge, D.L. Jones, and J. Wu. 2014. Effects of biochar amendment on the net greenhouse gas emission and greenhouse gas intensity in a Chinese double rice cropping system. Eur. J. Soil Biol. 65:30-39. 10.1016/j.ejsobi.2014.09.001
33
Liu, X., J. Zhou, Z. Chi, J. Zheng, L. Li, X. Zhang, J. Zheng, K. Cheng, R. Bian, and G. Pan. 2019. Biochar provided limited benefits for rice yield and greenhouse gas mitigation six years following an amendment in a fertile rice paddy. Catena 179:20-28. 10.1016/j.catena.2019.03.033
34
Liu, Y., H. Lu, S. Yang, and Y. Wang. 2016. Impacts of biochar addition on rice yield and soil properties in a cold waterlogged paddy for two crop seasons. Field Crops Res. 191:161-167. 10.1016/j.fcr.2016.03.003
35
Liu, Y., M. Yang, Y. Wu, H. Wang, Y. Chen, and W. Wu. 2011. Reducing CH4 and CO2 emissions from waterlogged paddy soil with biochar. J. Soils Sediments 11(6):930-939. 10.1007/s11368-011-0376-x
36
Martos, S., S. Mattana, A. Ribas, E. Albanell, and X. Domene. 2020. Biochar application as a win-win strategy to mitigate soil nitrate pollution without compromising crop yields: A case study in a Mediterranean calcareous soil. J. Soils Sediments 20(1):220-233. 10.1007/s11368-019-02400-9
37
Nguyen, B.T., B.T. Phan, T.X. Nguyen, V.N. Nguyen, T. Van Tran, and Q.V. Bach. 2020. Contrastive nutrient leaching from two differently textured paddy soils as influenced by biochar addition. J. Soils Sediments 20(1):297-307. 10.1007/s11368-019-02366-8
38
Nguyen, T.T.N., C.Y. Xu, I. Tahmasbian, R. Che, Z. Xu, X. Zhou, H.M. Wallace, and S.H. Bai. 2017. Effects of biochar on soil available inorganic nitrogen: A review and meta-analysis. Geoderma 288:79-96. 10.1016/j.geoderma.2016.11.004
39
NIAS. 2000. Methods of soil and plant analysis. National Institute of Agricultural Sciences, RDA, Suwon, Korea.
40
Nichols, G.J., J.A. Cripps, M.E. Collinson, and A.D. Scott. 2000. Experiments in waterlogging and sedimentology of charcoal: Results and implications. Palaeogeogr., Palaeoclimatol., Palaeoecol. 164:43-56. 10.1016/S0031-0182(00)00174-7
41
Oh, S., J. Son, Y. Ok, and J. Joo. 2010. A modified methodology of salt removal through flooding and drainage in a plastic film house soil. Korean J. Soil Sci. Fert. 43(5):443-449.
42
Ok, J.H., J.L. Cho, B.M. Lee, N.H. An, and J.H. Shin. 2015. Monitoring for change of soil characteristics by repeated organic supply of comport and green manures in newly reclaimed organic upland field. Korean J. Org. Agric. 23(4):813-827. 10.11625/KJOA.2015.23.4.813
43
Park, D.G., S.G. Hong, E. Jang, and J.D. Shin. 2019. Assessment of an optimum biochar application rate for tomato (Solanum lycopersicum L.) cultivation. J. Korea Org. Resour. Recycl. Assoc. 27(1):39-48.
44
Park, J.H., S.W. Kang, J.J. Yun, S.G. Lee, S.H. Kim, J.S. Beak, and J.S. Cho. 2021. Effects of co-application of biochars and composts on lettuce growth. Korean J. Soil Sci. Fert. 54(2):151-160.
45
Park, W.K., N.B. Park, J.D. Shin, S.G. Hong, and S.K. Kwon. 2011. Estimation of biomass resource conversion factor and potential production in agricultural sector. Korean J. Environ. Agric. 30(3):252-260. 10.5338/KJEA.2011.30.3.252
46
Quilliam, R.S., H.C. Glanville, S.C. Wade, and D.L. Jones. 2013. Life in the “charosphere” - Does biochar in agricultural soil provide a significant habitat for microorganisms? Soil Biol. Biochem. 65:287-293. 10.1016/j.soilbio.2013.06.004
47
Shaukat, M., K. Samoy-Pascual, E.D.V.L. Maas, and A. Ahmad. 2019. Simultaneous effects of biochar and nitrogen fertilization on nitrous oxide and methane emissions from paddy rice. J. Environ. Manage. 248:109242. 10.1016/j.jenvman.2019.07.01331315074
48
Sistani, K.R., M. Jn-Baptiste, N. Lovanh, and K.L. Cook. 2011. Atmospheric emissions of nitrous oxide, methane, and carbon dioxide from different nitrogen fertilizers. J. Environ. Qual. 40:1797-1805. 10.2134/jeq2011.019722031562
49
Spokas, K.A., W.C, Koskinen, J.M. Baker, and D.C. Reicosky. 2009. Impacts of woodchip biochar additions on greenhouse gas production and sorption/degradation of two herbicides in a Minnesota soil. Chemosphere 77:574-581. 10.1016/j.chemosphere.2009.06.05319647284
50
Troy, S.M., P.G. Lawlor, C.J. O’Flynn, and E.H. Healy. 2013. Impact of biochar addition to soil on greenhouse gas emissions following pig manure application. Soil Biol. Biochem. 60:173-181. 10.1016/j.soilbio.2013.01.019
51
Uchida, Y., M. Moriizumi, and M. Shimotsuma. 2019. Effects of rice husk biochar and soil moisture on the accumulation of organic and inorganic nitrogen and nitrous oxide emissions during the decomposition of hairy vetch (Vicia villosa) mulch. Soil Sci. Plant Nutr. 65:409-418. 10.1080/00380768.2019.1624139
52
Van Zwieten, L., B.P. Singh, S.W.L. Kimber, D.V. Murphy, L.M. Macdonald, J. Rust, and S. Morris. 2014. An incubation study investigating the mechanisms that impact N2O flux from soil following biochar application. Agric., Ecosyst. Environ. 191:53-62. 10.1016/j.agee.2014.02.030
53
van Zwieten, L., S. Kimber, A. Downie, S. Morris, S. Petty, J. Rust, and K.Y. Chan. 2010. A glasshouse study on the interaction of low mineral ash biochar with nitrogen in a sandy soil. Soil Res. 48:569-576. 10.1071/SR10003
54
Woo, S.H. 2013. Biochar for soil carbon sequestration. Clean Technol. 19(3):201-211. 10.7464/ksct.2013.19.3.201
55
Woo, S.H. 2015. A new wave of biochar to respond to climate change. p.172. Good Land, Seoul, Korea.
56
Woolf, D. and J. Lehmann. 2012. Modelling the long-term response to positive and negative priming of soil organic carbon by black carbon. Biogeochemistry 111(1-3):83-95. 10.1007/s10533-012-9764-6
57
Yang, C.H, C.H. Yoo, J.H. Jung, B.S. Kim, W.K. Park, J.H. Ryu, T.K. Kim, J.D. Kim, S.J. Kim, and S.H. Baek. 2008. The change of physico-chemical properties of paddy soil in reclaimed tidal land. Korean J. Soil Sci. Fert. 41(2):94-102.
58
Yoon, Y.M. 2014. The actual conditions of biomass use in Korea and the activation plan. KREI Report, Naju, Korea.
59
Zeng, W., C. Xu, J. Wu, J. Huang, and T. Ma. 2013. Effect of salinity on soil respiration and nitrogen dynamics. Ecol. Chem. Eng. 20:519-530. 10.2478/eces-2013-0039
60
Zhang, A.F., L.Q. Cui, G.X. Pan, L.Q. Li, Q. Hussain, X.H. Zhang, J.W. Zheng, and D. Crowley. 2010. Effect of biochar amendment on yield and methane and nitrous oxide emissions from a rice paddy from Tai Lake plain, China. Agric., Ecosyst. Environ. 139:469-475. 10.1016/j.agee.2010.09.003
61
Zhang, X., S. Kondragunta, C. Schmidt, and F. Kogan. 2008. Near real time monitoring of biomass burning particulate emissions (PM 2.5) across contiguous United States using multiple satellite instruments. Atmos. Environ. 42:6959-6972. 10.1016/j.atmosenv.2008.04.060
페이지 상단으로 이동하기