


Introduction
Materials and Methods
Experiment management
Soil sampling and chemical analysis of organic material
Labile organic carbon measurements
SOC stock and CMI calculation
Statistical analysis
Results and Discussion
Soil organic carbon stock and soil properties
Soil labile organic C fractions
Carbon management index and correlation analysis
Conclusions
Introduction
Organic farming could be an alternative to conventional farming, because it has been known to lower environmental impacts and meet sustainability requirements. It desists from using pesticides, synthetic fertilizers and promotes organic fertilization and crop rotations. All of those practices focused on closed nutrient cycle and improved soil quality (Stockdale et al., 2001; Cho et al., 2009; Foley et al., 2011).
Soil organic carbon (SOC) is one of the most widely used for soil quality indicator, as it plays an important role in multiple soil functions in agricultural soils (Lal, 2004; Bünemann et al., 2018). Several previous field experiments have reported that organic farming practices have potential to increases in SOC stocks (Marinari et al., 2006; Elfstrand et al., 2007; Deb et al., 2015). Soil organic carbon consists of multiple compounds, which can have different stability and functions. It is difficult to detect by total SOC analysis, that’s why soil fractionation is required (Haynes, 2005).
Among the SOC pool, the labile organic carbon (LOC) can turns over relatively rapidly, then function as primary energy source for microorganisms (Kaye and Hart, 1997). According to these properties, LOC have been considered as a more sensitive indicators of soil changes in soil quality (Xiao et al., 2015; Blanco-Moure et al., 2016). Various techniques are used to estimate the contents of the LOC pools. From the previous studies (Li et al., 2018; Bongiorno et al., 2019), several LOC pools extracted by chemical, physical methods were selected for this research. Water and hot-water extracted carbon (WEC and HWEC) represents the organic carbon which loosely bound to soil minerals in the soil solution. Permanganate oxidizable carbon (POXC) is oxidized OC derived from dissolved organic matter and microbial biomass. Physical fractionation by particle size (<53 um sieving) or density determines particulate organic carbon (POC) and light fraction organic carbon (LFOC) which consists mainly of partially decomposed organic residues. Microbial biomass carbon (MBC) is called biological fractions, normally determined soil microorganisms by soil fumigation. The CMI can also be a useful parameter for evaluating the potential of organic amendment such as straw, crop residues or conservation agriculture to improve soil quality (Xu et al., 2011; Li et al., 2018).
However, most previous researches have focused on changes on total SOC content and overall soil properties. Not only total SOC, LOC fraction and CMI measurement is required to fully understand impact of organic fertilization on soil quality. Therefore, the objectives of this study were to investigate the effects of organic fertilization on total SOC stocks, labile organic carbon fractions and carbon management index under the 7 years of organic maize cropping system, then finally assess the suitability of different LOC fractions as soil quality indicators in agricultural soils.
Materials and Methods
Experiment management
The experiment was conducted at field station of rural development administration, which has operated for further long-term test since 2016. The test consisted of following four treatments with three replicates; (1) COM (compost), (2) GM (green manure/hairy vetch), (3) NPK (inorganic fertilizer), and (4) NF (no fertilization). The recommendation rates (N-P2O5-K2O = 174-30-69 kg ha-1) of inorganic fertilizers were applied for NPK, and based on N rate, compost and hairy vetch biomass were incorporated into the soil 10 days before maize transplanting. The properties of compost and hairy vetch were not significantly different during six years of maize cultivation, thus mean value of materials used for experiment were shown in Table 1.
Table 1.
Chemical properties of organic materials used for this study.
| Material | TC (%) | TN (%) | C/N (%) | TP (%) | TK (%) |
| Compost | 36.02 | 3.10 | 11.63 | 4.54 | 1.83 |
| Hairy vetch | 44.01 | 2.85 | 15.46 | 0.78 | 0.84 |
Soil sampling and chemical analysis of organic material
The bulk soil was sampled by an augur (20 cm), and sieved with 2 mm mesh for chemical analysis. For bulk density (BD) measurement, undisturbed samples were collected using soil core sampler (0 - 20 cm, 3 replicates in each plot) and were dried in an oven at 105°C for 48 h.
The total carbon and nitrogen contents were analyzed by element analyzer (CHNS-932 Analyzer, Leco), and P and K contents were determined from digested samples using H2SO4 and ternary solution (HNO3:H2SO4:HClO4 = 10:1:4, v/v/v), respectively (Yoshida et al., 1976).
Labile organic carbon measurements
The water extractable carbon (WEC) was determined with fresh field soil samples by a modified method of Ghani et al. (2003) as follows. Briefly, the samples were mixed with distilled water in tubes, shaken for 1 hour, centrifuged for 20 minutes at 3,750 rpm. The supernants were filtered with 0.45 µm membrane filters to obtain total WEC. Hot water extractable carbon (HWEC) was subsequently extracted at 80°C for 16 hours. A further 30 mL of distilled water was added to the sediments remaining. The tubes were shaken on a vortex shaker to suspend the soil in the water, then placed in hot water bath at 80°C for 16 hours. After this step, the tubes were shaken and centrifuged for 20 min at 3,500 rpm. The supernatants were filtered using 0.45 µm membrane filters and C concentration was determined on a TOC-5050A analyzer (Shimadzu Corporation, Japan). Extractable organic C (EOC) was also determined by a TOC analyzer after 0.5 M K2SO4 (soil:solution, 1:5) extraction, but there was any difference among the treatments, then data was not shown in this manuscript.
Microbial biomass C (MBC) was determined by the CHCl3 fumigation-extraction method (Vance et al., 1987). Extract C concentration was determined using a TOC-5050A analyzer. Extracted C was converted to microbial biomass C as reported in Vance et al. (1987).
The permanganate oxidizable carbon (POXC) was extracted and analyzed following the procedure of Weil et al. (2003) modified as follows. Briefly, 2.5 g of air-dried soil was weighed and 18 mL of demineralized water and 2 mL of 0.2 M K2MnO4 was added. The tube was shaken for 2 min at 120 rpm and thereafter left undisturbed on a lab bench for 8 min to continue the oxidation reaction. Subsequently, 0.5 mL of solution was taken from the tube and placed in another tube with 49.5 mL of distilled water, allowing the reaction to stop. The absorbance of each sample at 550 nm (Abs) was determined using a UV-VIS Spectrophotometer. Permanganate oxidizable carbon was calculated according to Weil et al. (2003).
Particulate organic C (POC) was determined with modifications of the method described by Cambardella and Elliott (1992). In brief, 10 g air-dry soil and 30 mL Na hexametaphosphate solution (5 g L-1) were added to a 100 mL centrifuge tube, and shaken for approximately 18 h. The soil suspension was poured over a 53-µm screen and the retained coarse fraction was rinsed with distilled water. All material remaining on the mesh was washed into a dry dish, oven dried at 60°C for 48 h, and ground to determine C content using element analyzer (CHNS-932 Analyzer).
Light fraction organic C (LFOC) was determined using the method described by Gregorich and Ellert (1993). Briefly, 10 g of air-dried soil were homogenized with 30 mL NaI solution (density 1.8 g cm-3) in a 100-mL centrifuge tube by shaking on a rotating shaker for 60 min at 200 rpm, after which it was centrifuged at 1,000 rpm for 15 min. The light fraction, all floating materials after centrifugation, was transferred to a vacuum filter unit with a 20-µm nylon filter, and the material retained by the filter was washed by deionized water. This process was repeated three times. The light fractions were dried at 60°C for organic C determinations (CHNS-932 Analyzer).
SOC stock and CMI calculation
The SOC stocks (Mg ha-1) were calculated according to (Eq. 1) (Liu et al., 2013):
The carbon management index (CMI) was obtained according to the method of Blair et al. (1995). CMI was calculated as follows (Eq. 2):
The C lability is the ratio of labile C (POXC) to non-labile C, and non-labile C is determined as the difference between total C content and labile C (POXC) content of soil. Blair et al reported two carbon fractions; one is labile organic carbon oxidized by permanganate (KMnO4), and the other is non-labile organic carbon not oxidized by KMnO4 in his highly cited publication. That is because the KMnO4 method has been known to be rapid and inexpensive to determine LOC, and it showed clear analysis data (Xu et al., 2011; Ghosh et al., 2016).
Statistical analysis
The effects of different fertilization on SOC content, SOC stock, and soil labile organic carbon fractions were analyzed using One-way analysis of variance (ANOVA) least significant difference (LSD) test (p < 0.05). The Pearson correlation coefficients were calculated using R software to determine the linear relationship between carbon fractions and SOC stocks.
Results and Discussion
Soil organic carbon stock and soil properties
The mean soil bulk density (BD) ranged between 1.24 and 1.40 Mg m-3 in all treatments and was significantly lower in green manure (GM) treatment compared to no fertilization (NF), which indicated the improvement of soil quality.
Organic fertilization; COM and GM, significantly increased SOC content and stocks (Table 2). The SOC concentration was significantly different (p < 0.05) between all the treatments; COM (10.38 g kg-1) > GM (8.46 g kg-1) > NPK (7.17 g kg-1) > NF (6.24 g kg-1). Although both NPK and NF did not have additional carbon input, there was significant difference between them. It might be due to the consecutively increased rhizodeposition, root biomass by increased maize biomass (Hwang et al., 2020; Kong et al., 2020). The SOC stock in COM was the highest (27.0 Mg C ha-1) which was increased by 10 - 55% over NPK (19.1 0 Mg C ha-1) and NF (17.4 Mg C ha-1).
Table 2.
Soil organic carbon (SOC), bulk density and SOC stock from different fertilization practice under organic maize farming condition.
After maize harvest, the soil chemical properties were shown in Table 3. Overall soil characteristics such as pH, content of soil organic matter (OM), nitrogen and exchangeable cations were improved in COM treatment. For GM plot, concentration in OM and nitrogen was increased, but soil pH value was slightly decreased compare to NPK. That is due to the organic acids released from mineralization process of organic materials (Kim et al., 2020).
Table 3.
Soil chemical properties after maize harvest.
Soil labile organic C fractions
The effects of different fertilization treatments on soil labile organic C fractions (WEC, HWEC, MBC, POXC, POC and LPOC) are shown in Fig. 1. All labile carbon fractions were higher in organic fertilization treatments compared to NPK and NF, except MBC content. Other research also reported that inconsistent effect of fertilization on MBC with positive, negative and no impacts (Xue et al., 2006; Gong et al., 2009; Li et al., 2018). Also, significant increases (p < 0.05) in WEC, POXC, POC and LFOC were observed in COM, suggesting that organic materials as fertilizer had beneficial effects on the activity of microorganisms probably by providing a readily-available C source and improving the soil physical environment (Yang et al., 2012). The content of HWEC, POXC, POC, LFOC was higher in order: COM > GM > NPK > NF. These concentrations is moderated with nutrient mineralization and can contribute to nutrient availability and soil properties. Improved soil characteristics was shown in Table 4.
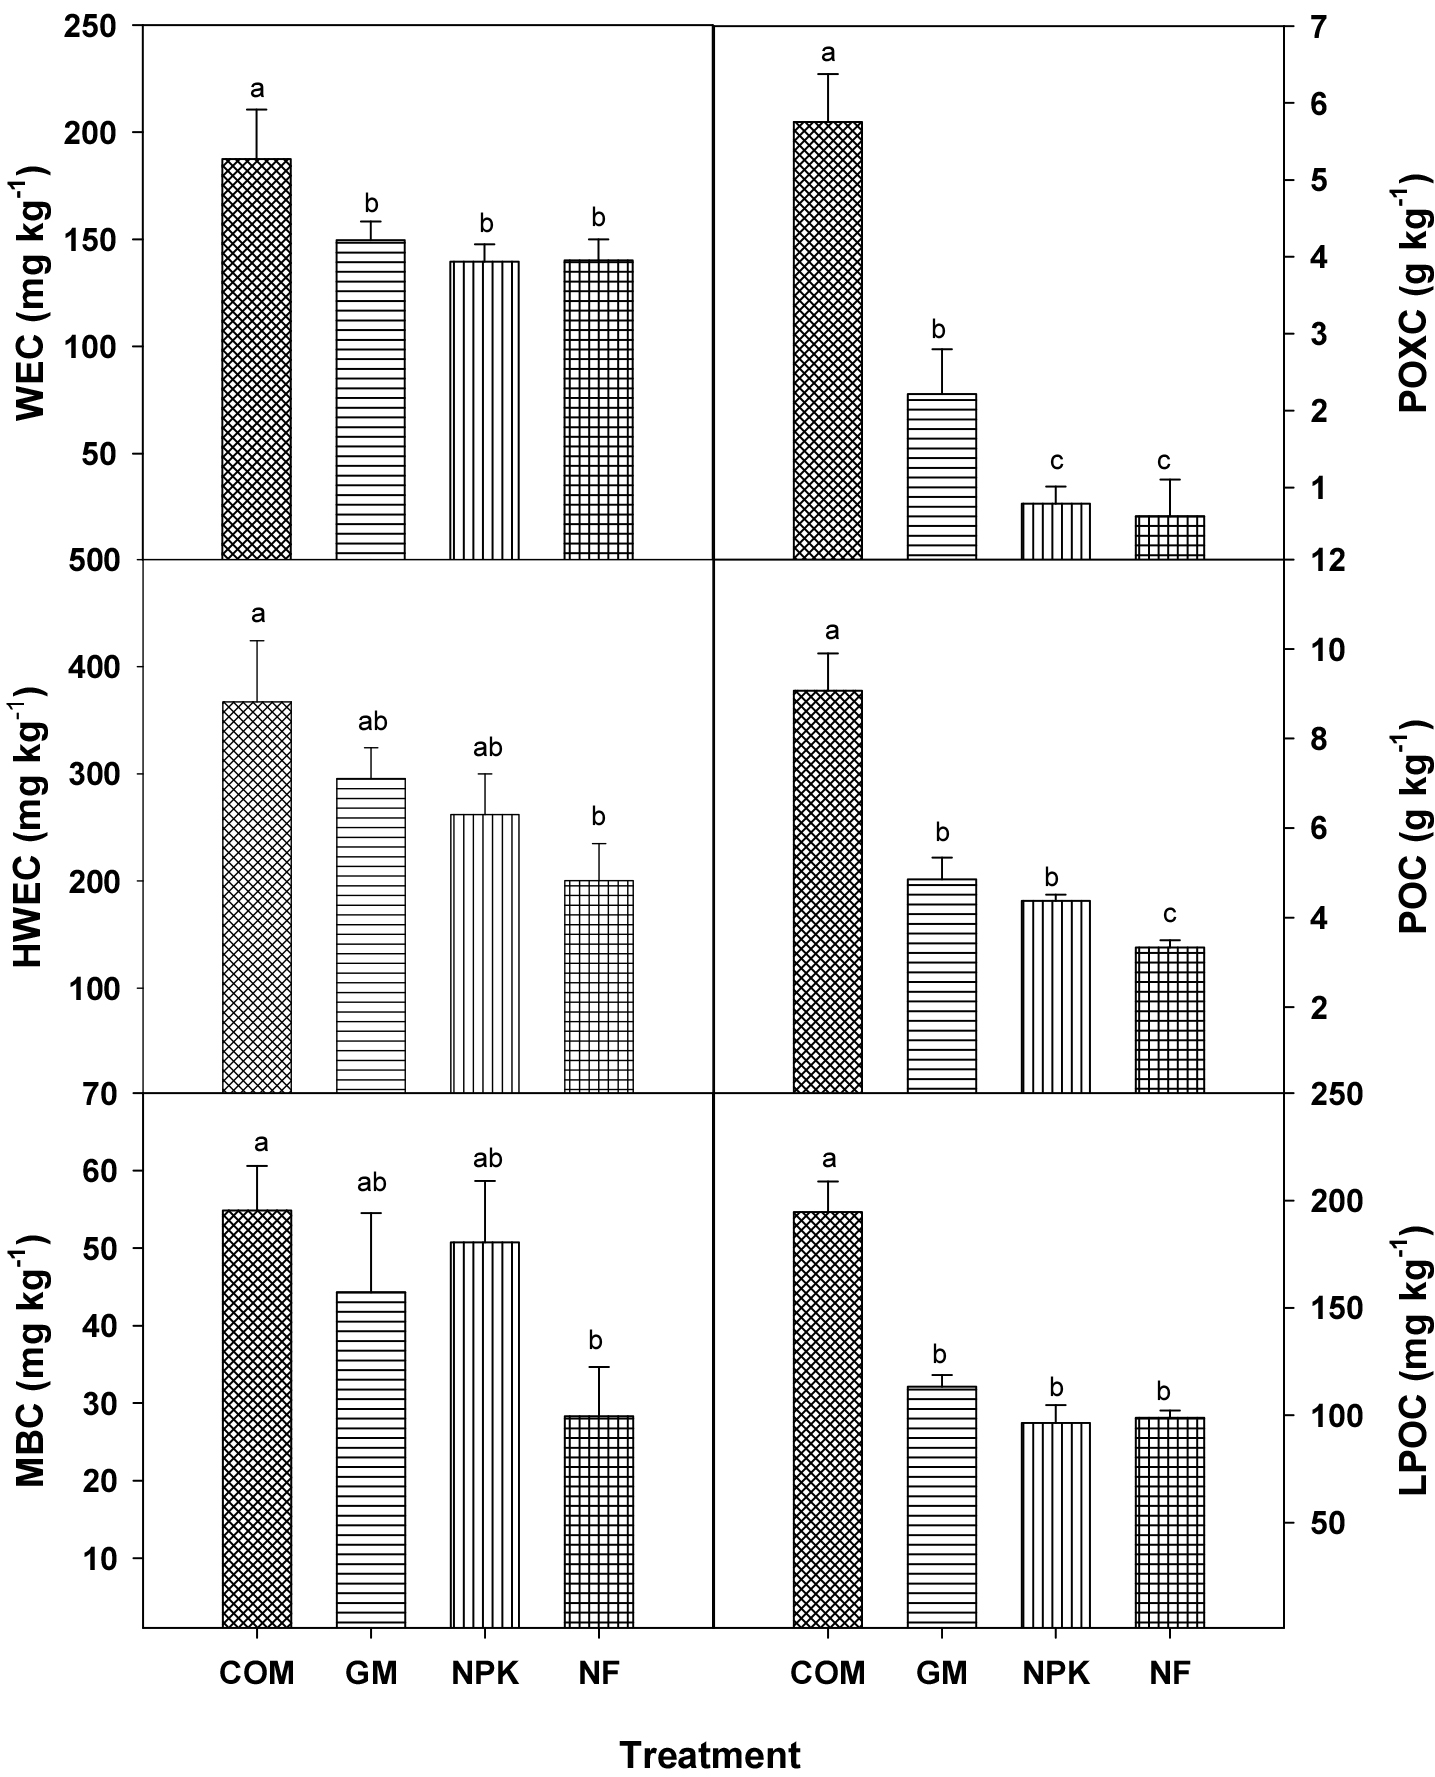
Fig. 1.
Effect of different fertilization on labile organic C fractions; water extractable C (WEC), hot-water extractable C (HWEC), microbial biomass C (MBC), permanganate oxidizable C (POXC), particulate organic C (POC) and light fraction organic C (LFOC) in soil. Different letter means significant difference (LSD, p < 0.05).
Table 4.
Labile organic C fractions including water extractable C (WEC), hot-water extractable C (HWEC), microbial biomass C (MBC), permanganate oxidizable C (POXC), particulate organic C (POC) and light fraction organic C (LFOC) as a proportion of total SOC (%) in different fertilizer treatments.
The WEC and LPOC showed same patterns. The highest values were obtained in COM, WEC (187 mg kg-1) and LPOC (194 mg kg-1) of COM were approximately higher 23% and 45% than others, respectively. And there’s no difference among others. HWEC had significant difference only between COM (367 mg kg-1) and NF (200 mg kg-1), even GM and NPK increased HWEC by 31 - 47% over that of NF. Organic fertilization treatment (COM and GM) had significantly higher POXC compared to NPK and NF (p < 0.05, Fig. 1). POXC contents of COM and GM were 2.8 - 7.3 times and 3.6 - 9.2 times higher than NPK and NF, respectively, which is possibly attributed to a large amount of organic compound in organic materials.
Table 3 showed the proportion of each labile organic C fraction relative to total SOC. When labile carbon fractions were calculated as a proportion of total SOC, only POXC was significantly higher in the organic treatments compared to NPK and NF. The highest proportion (32 - 87%) was observed in POC. It might be due to the analysis method, since POC concentrations; macro-aggregate size associated C, was also directly determined by element analyzer. Although they account for only a small proportion of SOC; 0.27 - 0.53 for MBC, 0.93 - 1.88 for WEC, 1.81 - 1.44 for LFOC, 1.93 - 3.54 for HWEC, these measures of soil C are considered good indicators of the soil’s potential to nutrients cycle (Haynes, 2005; Li et al., 2016).
Carbon management index and correlation analysis
The carbon management index (CMI) is a useful factor to assess the capacity of management systems to improve soil quality (Diekow et al., 2005). Changes in CPI under different fertilizer treatments increased in the order COM > GM > NF, with values ranging from 0.87 to 2.77 (Table 5). With reference to CMI, it showed a similar trend to CPI as influenced by different fertilizer treatments. The highest values of CMI was found in COM, and organic fertilization; COM and GM increased CMI value by 3.2 and 1.7 times than that of NPK.
Table 5.
Lability of C (L), Lability index (LI), Soil Carbon pool index (CPI), and Carbon management index (CMI) of different fertilizer treatments.
| Treatment | Lability | Lability index | CPI | CMI |
| COM | 55.85 a† | 1.67 a | 1.66 a | 2.77 a |
| GM | 36.32 b | 1.08 b | 1.36 b | 1.47 b |
| NPK | 25.39 c | 0.76 c | 1.15 c | 0.87 c |
Most of the labile carbon fractions were positively correlated with each other (Fig. 2). This suggests that dynamics of labile C fractions can be used as a rapid indicator of TOC dynamics in soils. The Pearson correlations between values of LOC fractions are shown in Fig. 2. The positive and significant correlations were observed between POXC, POC and other fractions except EOC, MBC. Furthermore, correlation between POXC and POC was very significant (r = 0.92***). This result agreed with the previous literature, recently, Fine et al. (2017) found that POXC was the best single predictor of overall soil quality measured in USA. Using POXC and POC, two indicators, is strongly recommended to briefly assess soil quality in agricultural system.
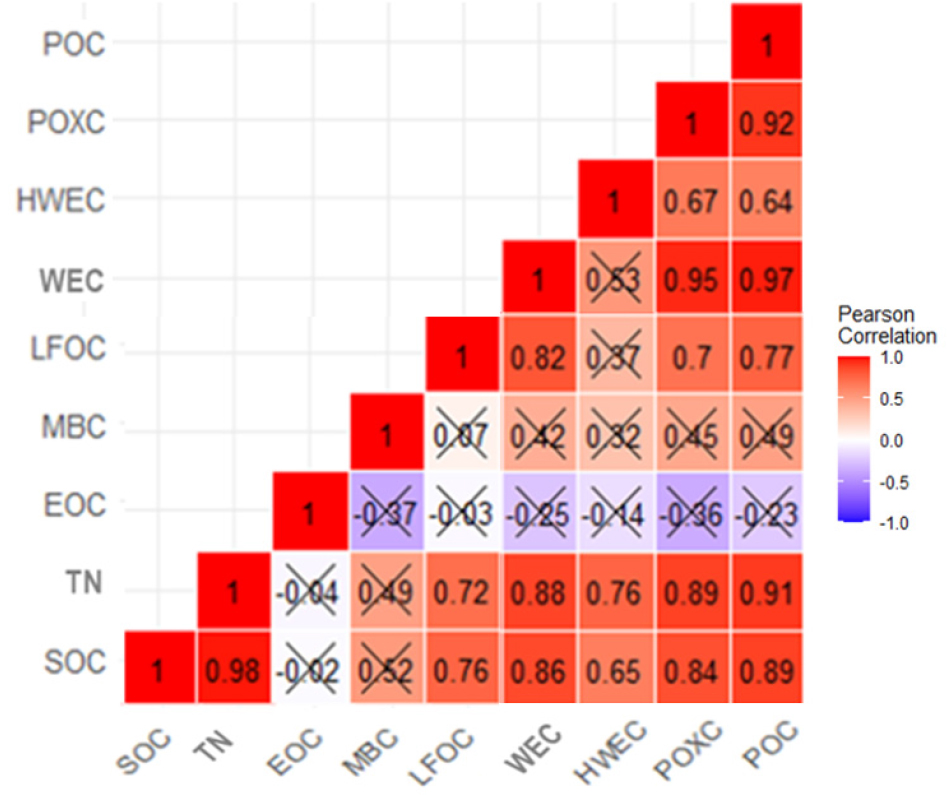
Fig. 2.
Pearson correlation analysis based on heat map of soil labile organic carbon fractions and soil properties. Soil organic carbon (SOC), soil total nitrogen (TN), extractable organic carbon (EOC), microbial biomass C (MBC), light fraction organic C (LFOC)water extractable C (WEC), hot-water extractable C (HWEC), permanganate oxidizable C (POXC) and particulate organic C (POC).
Conclusions
Our results clearly indicated that 6 years of organic fertilization significantly decreased soil bulk density, increased total SOC concentrations, SOC stocks and labile organic C fractions compared to inorganic fertilizers or the unfertilized treatment in organic maize cropping system. Great improvement in CMI value under organic fertilization indicated enhanced delivery of C sequestration and nutrient cycling in soil ecosystem services compared to inorganic treatment. From this study, POC and POXC could be recommended for the most informative soil labile organic carbon fractions about SOC stock and other labile OC.
