Conversion Factors for Electrical Conductivity of 1:5 Soil-Water Extracts to Saturated Paste of Reclaimed Tideland Soils are Affected by Sand Contents
ABSTRACT
Introduction
Materials and Methods
연구 대상 지역
토양 시료 채취 및 분석
환산계수 평가 및 통계 분석
Results and Discussion
Conclusions
Introduction
염류 토양에서 작물은 삼투압 스트레스로 인해 수분 흡수 저하 현상이 발생하며, 또한 특정 이온 (Na+와 Cl-)에 대한 독성 스트레스로 인해 작물 생리에 장애가 발생할 수 있다 (Castillo et al., 2007). 우리나라 농경지의 약 11.7%를 차지하는 간척지도 입지 특성에 의한 염해 가능성이 높아서 (Lim et al., 2020), 염해를 회피하고 주곡인 쌀 생산을 위해 밭작물에 비해 내염성이 높은 벼를 주로 재배하고 있다 (Jeong et al., 2020; Lim et al., 2020). 하지만, 쌀 과잉 생산에 따른 간척지 밭 작물 재배에 대한 정책적 요구가 증가하고 있어 간척지 염농도 모니터링과 그에 따른 작물 재배 관리가 더욱 중요해지고 있다 (Ryu et al., 2021; Seo et al., 2021; Yun et al., 2021; Lee et al., 2022).
토양의 염도는 관행적으로 토양 용액의 전기전도도 (electrical conductivity, EC)를 측정함으로써 평가한다 (US Salinity Laboratory Staff, 1954). 토양의 EC를 측정하는 여러 방법 중에서도 토양 포화반죽 침출액의 EC (ECe)는 작물 생육에 직접적으로 영향을 미치는 가용성 염의 농도를 가장 잘 반영하기 때문에 토양 염도를 평가하는 가장 표준적인 EC 측정법으로 사용된다 (Rhoades et al., 1989). 하지만, 토양 포화반죽은 고강도의 노동력과 장기간의 분석 시간을 필요로 하기 때문에, 다량의 토양 시료를 분석하거나 지속적으로 토양 염도를 모니터링하는 데에 사용하기에는 어려움이 있다 (Al-Busaidi et al., 2006; Aboukila and Norton, 2017; Seo et al., 2021). 따라서, 보다 간편하고 쉽게 분석이 가능한 일정 비율 (1:1, 1:2, 1:2.5, 1:5 등)의 토양-증류수 혼합물의 EC (각 비율에 대해 EC1:1, EC1:2, EC1:2.5, EC1:5)를 측정하여 ECe로 환산하는 방법이 모색되고 있다 (Liu et al., 2006; Sonmez et al., 2008; Khorsandi and Yazdi, 2011; Aboukila and Abdelaty, 2017; Aboukila and Norton, 2017; Kargas et al., 2018; Gharaibeh et al., 2021).
우리나라를 비롯한 주요 국가에서 주로 사용되는 EC1:5의 경우, EC1:5-ECe 환산계수가 5.0 - 11.7 범위로 제시되고 있다 (Lee et al., 2003; Sonmez et al., 2008; Chi and Wang, 2010; Khorsandi and Yazdi, 2011; He et al., 2012; Aboukila and Abdelaty, 2017; Aboukila and Norton, 2017; Kargas et al., 2020). 하지만, EC1:5-ECe 환산계수는 토성 (Monteleone et al., 2016), 염의 종류 (Richard and Gouny, 1965), 황산칼슘 함량 (Khorsandi and Yazdi, 2011), 점토광물 종류 (Sonmez et al., 2008), 이온 조성 (Park et al., 2019) 등 토양의 물리화학성에 의해 달라질 수 있다. 특히, 토양의 모래 함량은 포화 수분함량을 결정하는 중요한 요소이기 때문에 EC1:5-ECe 환산계수에 직접적으로 영향을 미칠 수 있다 (Seo et al., 2022). 예를 들어, 모래 함량이 높은 토양의 경우, 공극률이 낮아서 ECe 측정을 위한 포화 수분함량이 적어 염의 희석도가 낮아지고 그 결과 EC1:5와 비교하여 염이 농축되기 때문에 EC1:5-ECe 환산계수는 증가한다 (Gibbs, 2000; Seo et al., 2022). 최근, Seo et al. (2022)이 실험실 조건에서 다양한 토성과 염농도 조건에서 모래 함량에 따른 EC 환산계수 변화를 조사하였지만, 현장 간척지 토양을 대상으로 한 관련 연구가 없어 모래 함량에 따른 EC 환산계수 변화에 대한 추가적인 연구가 요구된다.
따라서, 본 연구에서는 우리나라 19개 간척지를 대상으로 간척지별 EC1:5-ECe 환산계수를 도출하고, 간척지별 평균 모래함량과 평균 환산계수의 상관관계를 평가하여 모래함량에 따른 EC 환산계수 변화를 조사하였다. 19개 간척지 토양의 모래 함량이 높을수록 EC1:5-ECe 환산계수가 높아질 것으로 가설을 세웠다.
Materials and Methods
연구 대상 지역
본 연구는 2018년부터 2021년까지 우리나라의 경기, 충남, 전남에 위치한 19개의 간척지 (고흥, 군내, 남포, 보전, 삼산, 석문, 시화, 영산강, 고천암, 만덕, 복길, 백수, 사내, 서심천, 소포, 염산, 운남, 월천, 톱머리 지구)를 대상으로 실시하였다 (Table 1 and Fig. 1). 조사 대상 간척지의 면적은 298 - 20,249 ha로 다양하였으며, 토양 시료를 채취한 필지는 모두 경사가 없는 지형에서 벼 재배지로 활용되고 있었다. 또한, 연구 기간 동안 평균 기온 13.4°C, 강수량 1,379.7 mm로 기후 조건이 유사하였다 (KMA, 2021). 조사 대상 간척지의 토양은 모두 2차 염류집적으로 형성된 염류 토양이 아닌 해안가라는 입지 특성에 의해 자연적으로 염이 집적된 1차 염류 토양으로 분류되었다 (Pitman and Läuchli, 2002).
Table 1.
Brief information of reclaimed tideland (RTL) investigated in this study.
|
RTL
|
Administrative district† |
Reclaimed area
(ha)
|
Number of soil sampling
|
Sand
(%)
|
|
Baegsu (BS)
|
Yeongwang-gun, Chonnam
|
377
|
20
|
5.1
|
|
Boggil (BG)
|
Muan-gun, Chonnam
|
500
|
10
|
1.1
|
|
Bojeon (BJ)
|
Jindo-gun, Chonnam
|
298
|
16
|
47.5
|
|
Gocheonam (GC)
|
Haenam-gun, Chonnam
|
3,020
|
20
|
23.2
|
|
Goheung (GH)
|
Goheung-gun, Chonnam
|
3,100
|
36
|
17.0
|
|
Gunnae (GN)
|
Jindo-gun, Chonnam
|
1,381
|
28
|
8.5
|
|
Mandeog (MD)
|
Gangjin-gun, Chonnam
|
316
|
10
|
30.8
|
|
Nampo (NP)
|
Boryeong-si, Chungnam
|
682
|
64
|
71.7
|
|
Samsan (SS)
|
Jangheung-gun, Chonnam
|
420
|
29
|
33.6
|
|
Sanae (SN)
|
Gangjin-gun, Chonnam
|
822
|
18
|
24.5
|
|
Seongmun (SM)
|
Dangjin-si, Chungnam
|
3,740
|
165
|
37.5
|
|
Seosimcheon (SC)
|
Haenam-gun, Chonnam
|
238
|
20
|
5.2
|
|
Sihwa (SH)
|
Ansan-si, Gyeonggi
|
4,396
|
56
|
23.1
|
|
Sopo (SP)
|
Jindo-gun, Chonnam
|
1,323
|
10
|
22.2
|
|
Tobmeoli (TM)
|
Muan-gun, Chonnam
|
1,633
|
10
|
44.2
|
|
Unnam (UN)
|
Muan-gun, Chonnam
|
648
|
18
|
4.9
|
|
Wolcheon (WC)
|
Hampyeong-gun, Chonnam
|
400
|
20
|
24.7
|
|
Yeomsan (YS)
|
Yeongwang-gun, Chonnam
|
667
|
10
|
2.3
|
|
Youngsangang (YG)
|
Youngam-gun and Haenam-gun, Chonnam
|
20,249
|
68
|
23.9
|
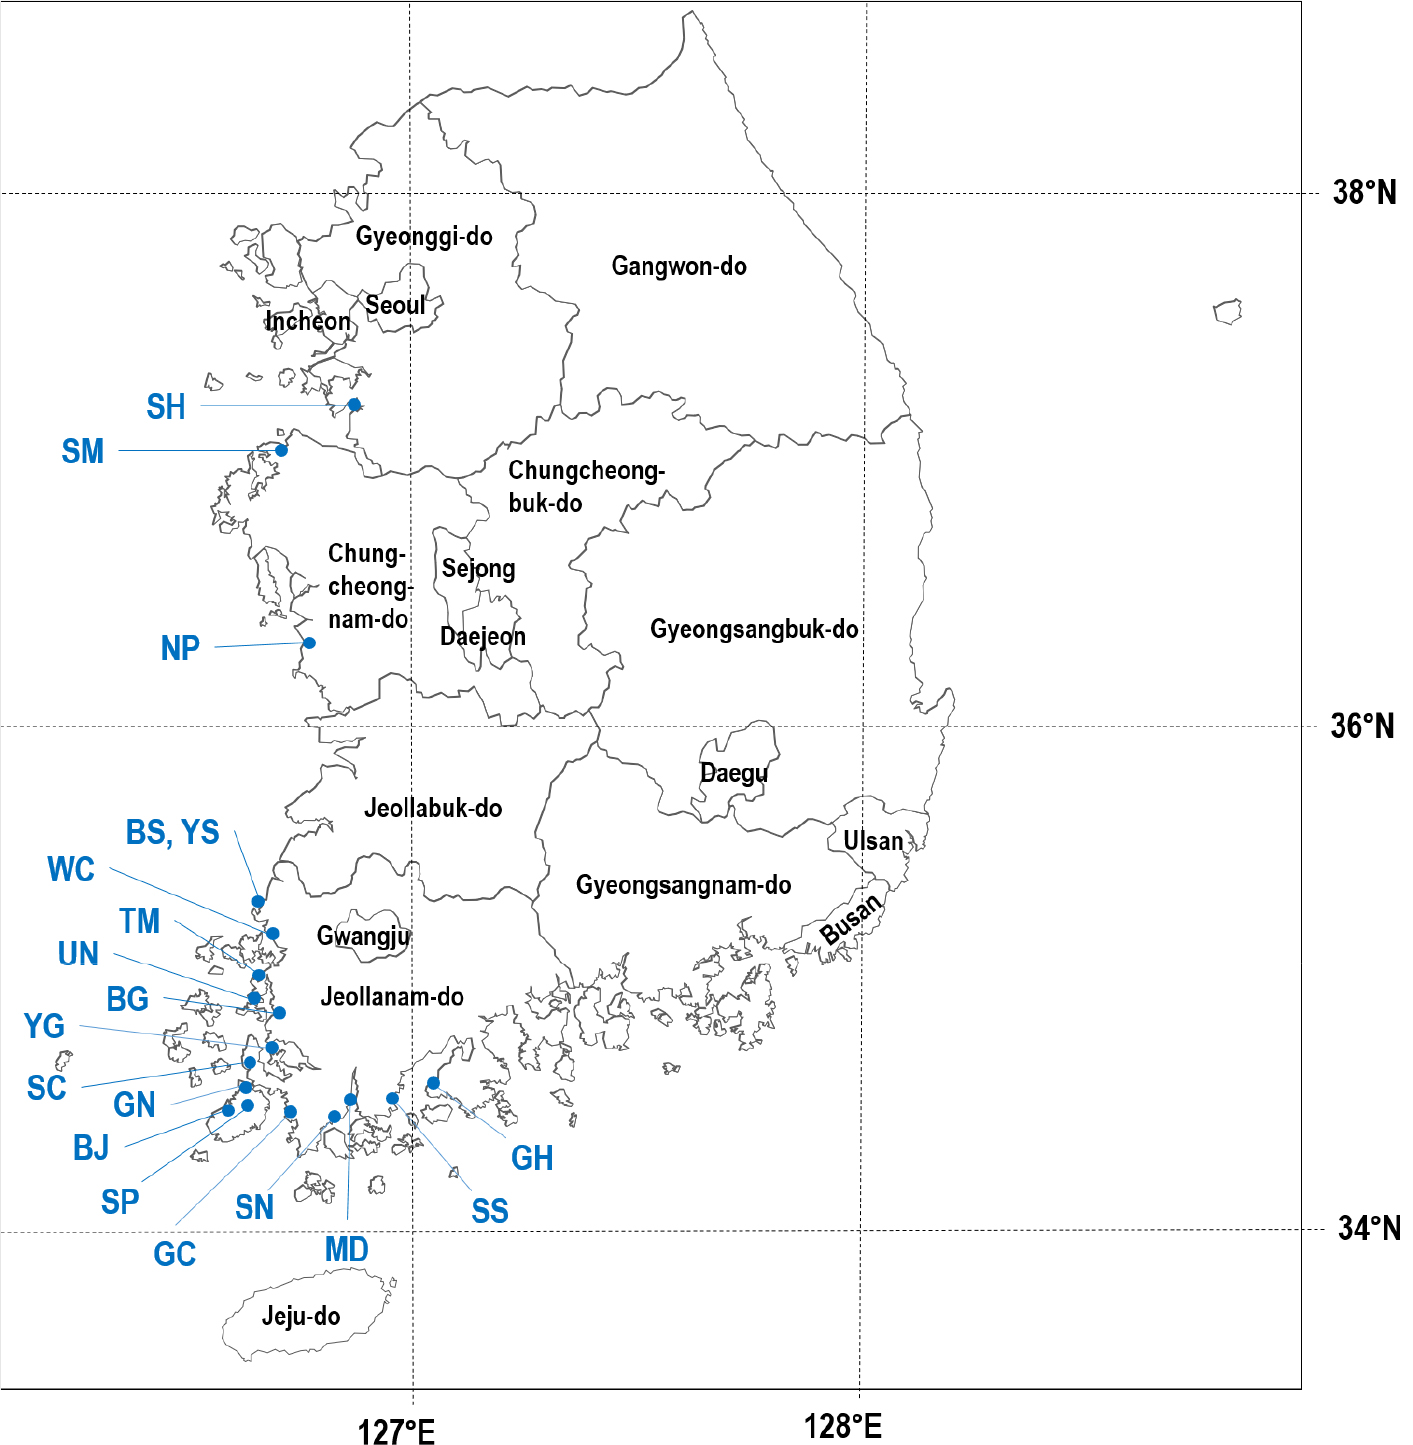
Fig. 1
Geographical distribution of the studied reclaimed tidelands (RTLs) (n = 19 and area = 44,210 ha) along the coastal area of Korea. Locations of RTL were indicated by circle symbols. Details of RTL were described in Table 1.
토양 시료 채취 및 분석
토양 시료는 연구 기간 동안 매년 봄 (4월 경)에 표토 (0 - 20 cm)와 심토 (20 - 40 cm)로 구분하여 총 628점의 시료를 채취하였다. 채취한 토양 시료는 풍건한 후 2 mm 체를 통과시켜 분석에 사용하였다. Pipette법으로 토양의 입경분포를 분석한 결과 (Gee and Bauder, 1986), 조사 대상 간척지 토양의 모래 함량은 1.1 - 71.7% 였다 (Table 1). 토양의 EC1:5를 측정하기 위하여 토양 (10 g)에 증류수 (50 mL)를 첨가하여 150 rpm에서 30분간 교반한 후 No. 2 Whatman 여과지로 여과하였으며, EC meter (Orion 3 STAR, Thermo Fisher Scientific Korea, Seoul, Korea)를 이용하여 여과액의 EC1:5를 측정하였다 (Seo et al., 2021). 토양 ECe 측정을 위한 포화 반죽은 미농무성의 Soil Salinity Laboratory에서 발표한 관행적인 포화 반죽법에 따라 토양 시료 500 g에 대해 토양이 완전히 포화될 때까지 증류수를 첨가하여 포화 반죽하였다 (US Salinity Laboratory Staff, 1954). 포화 반죽된 토양 시료는 진공 용액 추출기 (SampleTek 24VE, MAVCO INDUSTREIS, Inc., Kentucky, USA)를 이용하여 침출액을 채취하였으며, EC meter로 침출액의 ECe를 측정하였다.
환산계수 평가 및 통계 분석
EC1:5-ECe 환산계수를 평가하기 위하여 IBM SPSS Statistics 26 (IBM Crop., Armonk, New York, USA)의 회귀분석을 이용하여 토양의 EC1:5와 ECe의 선형회귀식을 도출하였으며, 회귀식의 기울기를 활용하여 환산계수를 평가하였다. 또한, 환산계수에 대한 토양 모래 함량의 영향은 간척지구의 평균 모래 함량과 평균 환산계수의 상관분석을 통해 조사하였다. 모든 통계분석은 95% 수준에서 유의성을 검토하였다.
Results and Discussion
본 연구에서 조사 대상 간척지 토양의 EC1:5는 0.05 - 4.11 dS m-1의 범위였으며, ECe는 0.32 - 30.40 dS m-1의 범위였다 (Fig. 2a). 남포지구를 제외한 모든 조사 대상 간척지 토양의 ECe가 2.0 dS m-1 이상으로 염해 토양으로 분류되었으며, 특히 복길, 보전, 고흥, 군내, 만덕, 삼산, 시화, 소포, 톱머리, 영산강지구는 ECe가 8.1 dS m-1 이상으로 강염류토양으로 분류되었다 (Smith and Doran, 1997).
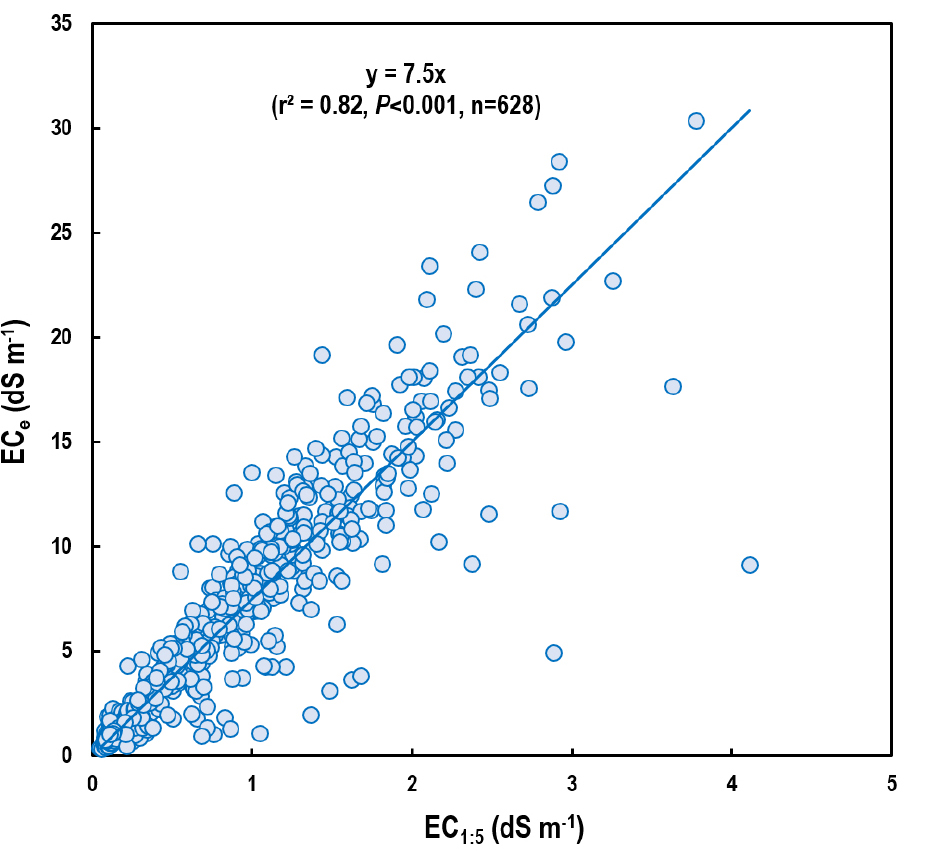
총 19개 간척지에서 채취한 토양 628점의 EC1:5와 ECe에 대한 선형 회귀분석 (r2 = 0.82, P < 0.001)을 통해 평가된 EC1:5-ECe 환산계수는 7.5였으며 (Fig. 2b), 이는 선행연구에서 평가된 환산계수 (5.0 - 11.7)의 범위에 상응하는 값이였다 (Lee et al., 2003; Sonmez et al., 2008; Khorsandi and Yazdi, 2011; Aboukila and Abdelaty, 2017; Aboukila and Norton, 2017). 하지만, 19개 간척지 토양의 EC1:5와 ECe 상관관계는 간척지별로 상이하였으며 (Fig. 3), 간척지별 EC1:5-ECe 환산계수는 4.6 - 9.9 범위였다 (Table 2). 특히, EC1:5-ECe 환산계수는 토양 모래 함량과 유의한 상관관계를 보이며, 토양의 모래 함량이 증가함에 따라 증가하는 경향을 보였다 (Fig. 4). 이는 모래 함량 비율이 상이한 토성을 이용하여 EC1:5-ECe 환산계수를 평가한 다른 연구 결과와 일치한다 (Gibbs, 2000; Seo et al., 2022). Gibbs (2000)는 모래 함량의 비율이 약 90 - 100%에 해당하는 사토의 경우 EC1:5-ECe 환산계수가 17로 평가되었으며, 모래 함량 비율이 약 0 - 45%로 상대적으로 낮은 식토의 경우 EC1:5-ECe 환산계수가 7로 보고 하였다. 이와 같은 결과는 포화반죽 침출액의 희석도와 관련된 것으로 추정되는데, 토양의 토성에 따른 공극률 차이로 인해 포화반죽 침출액에 투입되는 증류수의 양이 달라져 희석도의 차이가 있기 때문이다 (Seo et al., 2022). 예를 들어, 모래 함량이 많은 토양일수록 공극률이 낮아져 포화 수분 함량이 감소하며, 이에 따라 희석도가 낮아져 포화반죽 침출액에 염이 농축된다 (Gibbs, 2000; Seo et al., 2022). 반면, EC1:5를 측정할 때에는 토양의 토성 및 공극률과 관계없이 일정한 양의 증류수를 투입하기 때문에 EC1:5-ECe 환산계수가 높아진다. 비록 일부 연구에서는 모래 함량이 증가함에 따라 포화 수분함량이 오히려 증가한다고 보고하였지만 (Hogg and Henry, 1984; Sonmez et al., 2008), 본 연구에서 나타난 토양 모래 함량과 EC1:5-ECe 환산계수의 정의 상관관계는 포화 수분함량이 환산계수에 직접적으로 큰 영향을 미친다는 선행 연구의 결과를 뒷받침한다 (Gharaibeh et al., 2021; Seo et al., 2022).
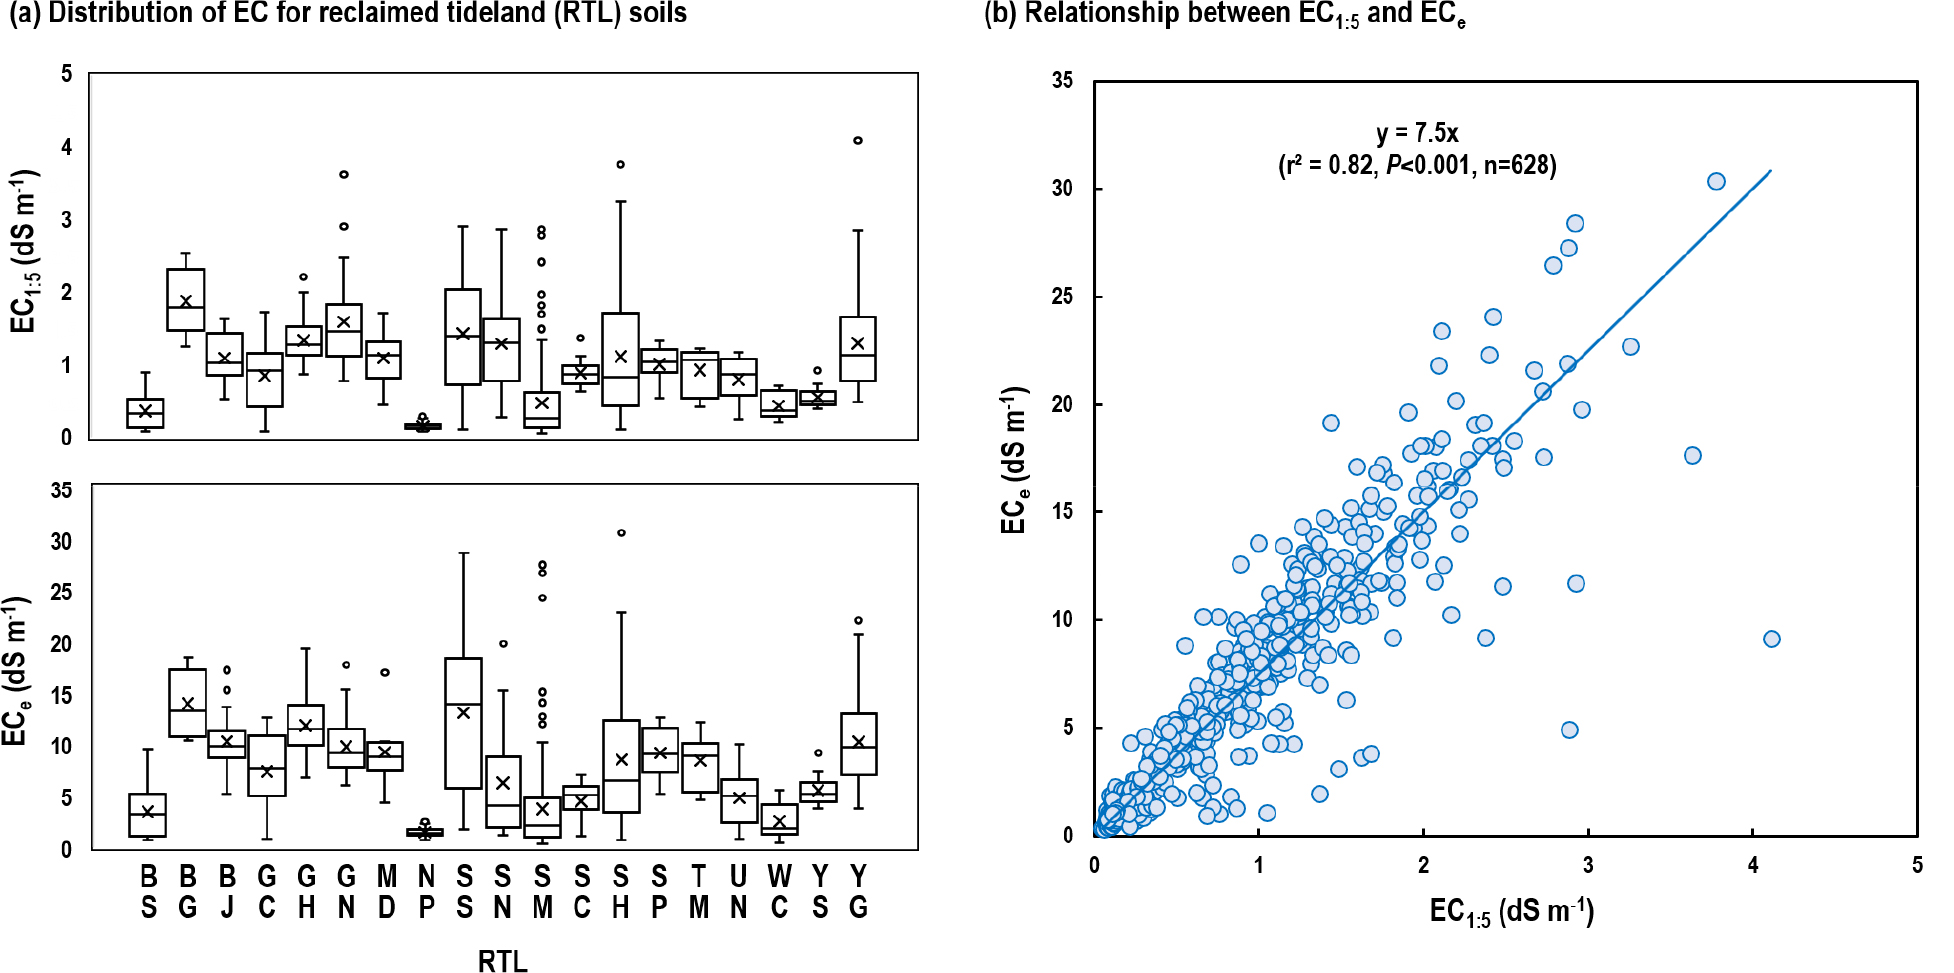
Fig. 2
Electrical conductivity (EC) of the soil samples collected from the studied 19 reclaimed tidelands (RTLs): (a) box plots of the distribution of EC of 1:5 soil-water extracts (EC1:5) and EC of saturated soil paste (ECe) and (b) relationship between EC1:5 and ECe. For (a), boxes represent interquartile ranges (IQRs) and horizontal lines within boxes indicate median values, and the upper and lower whiskers indicate 75 percentile plus 1.5 IQR and 25 percentile minus 1.5 IQR, respectively. The code names of the RTLs are provided in Table 1.
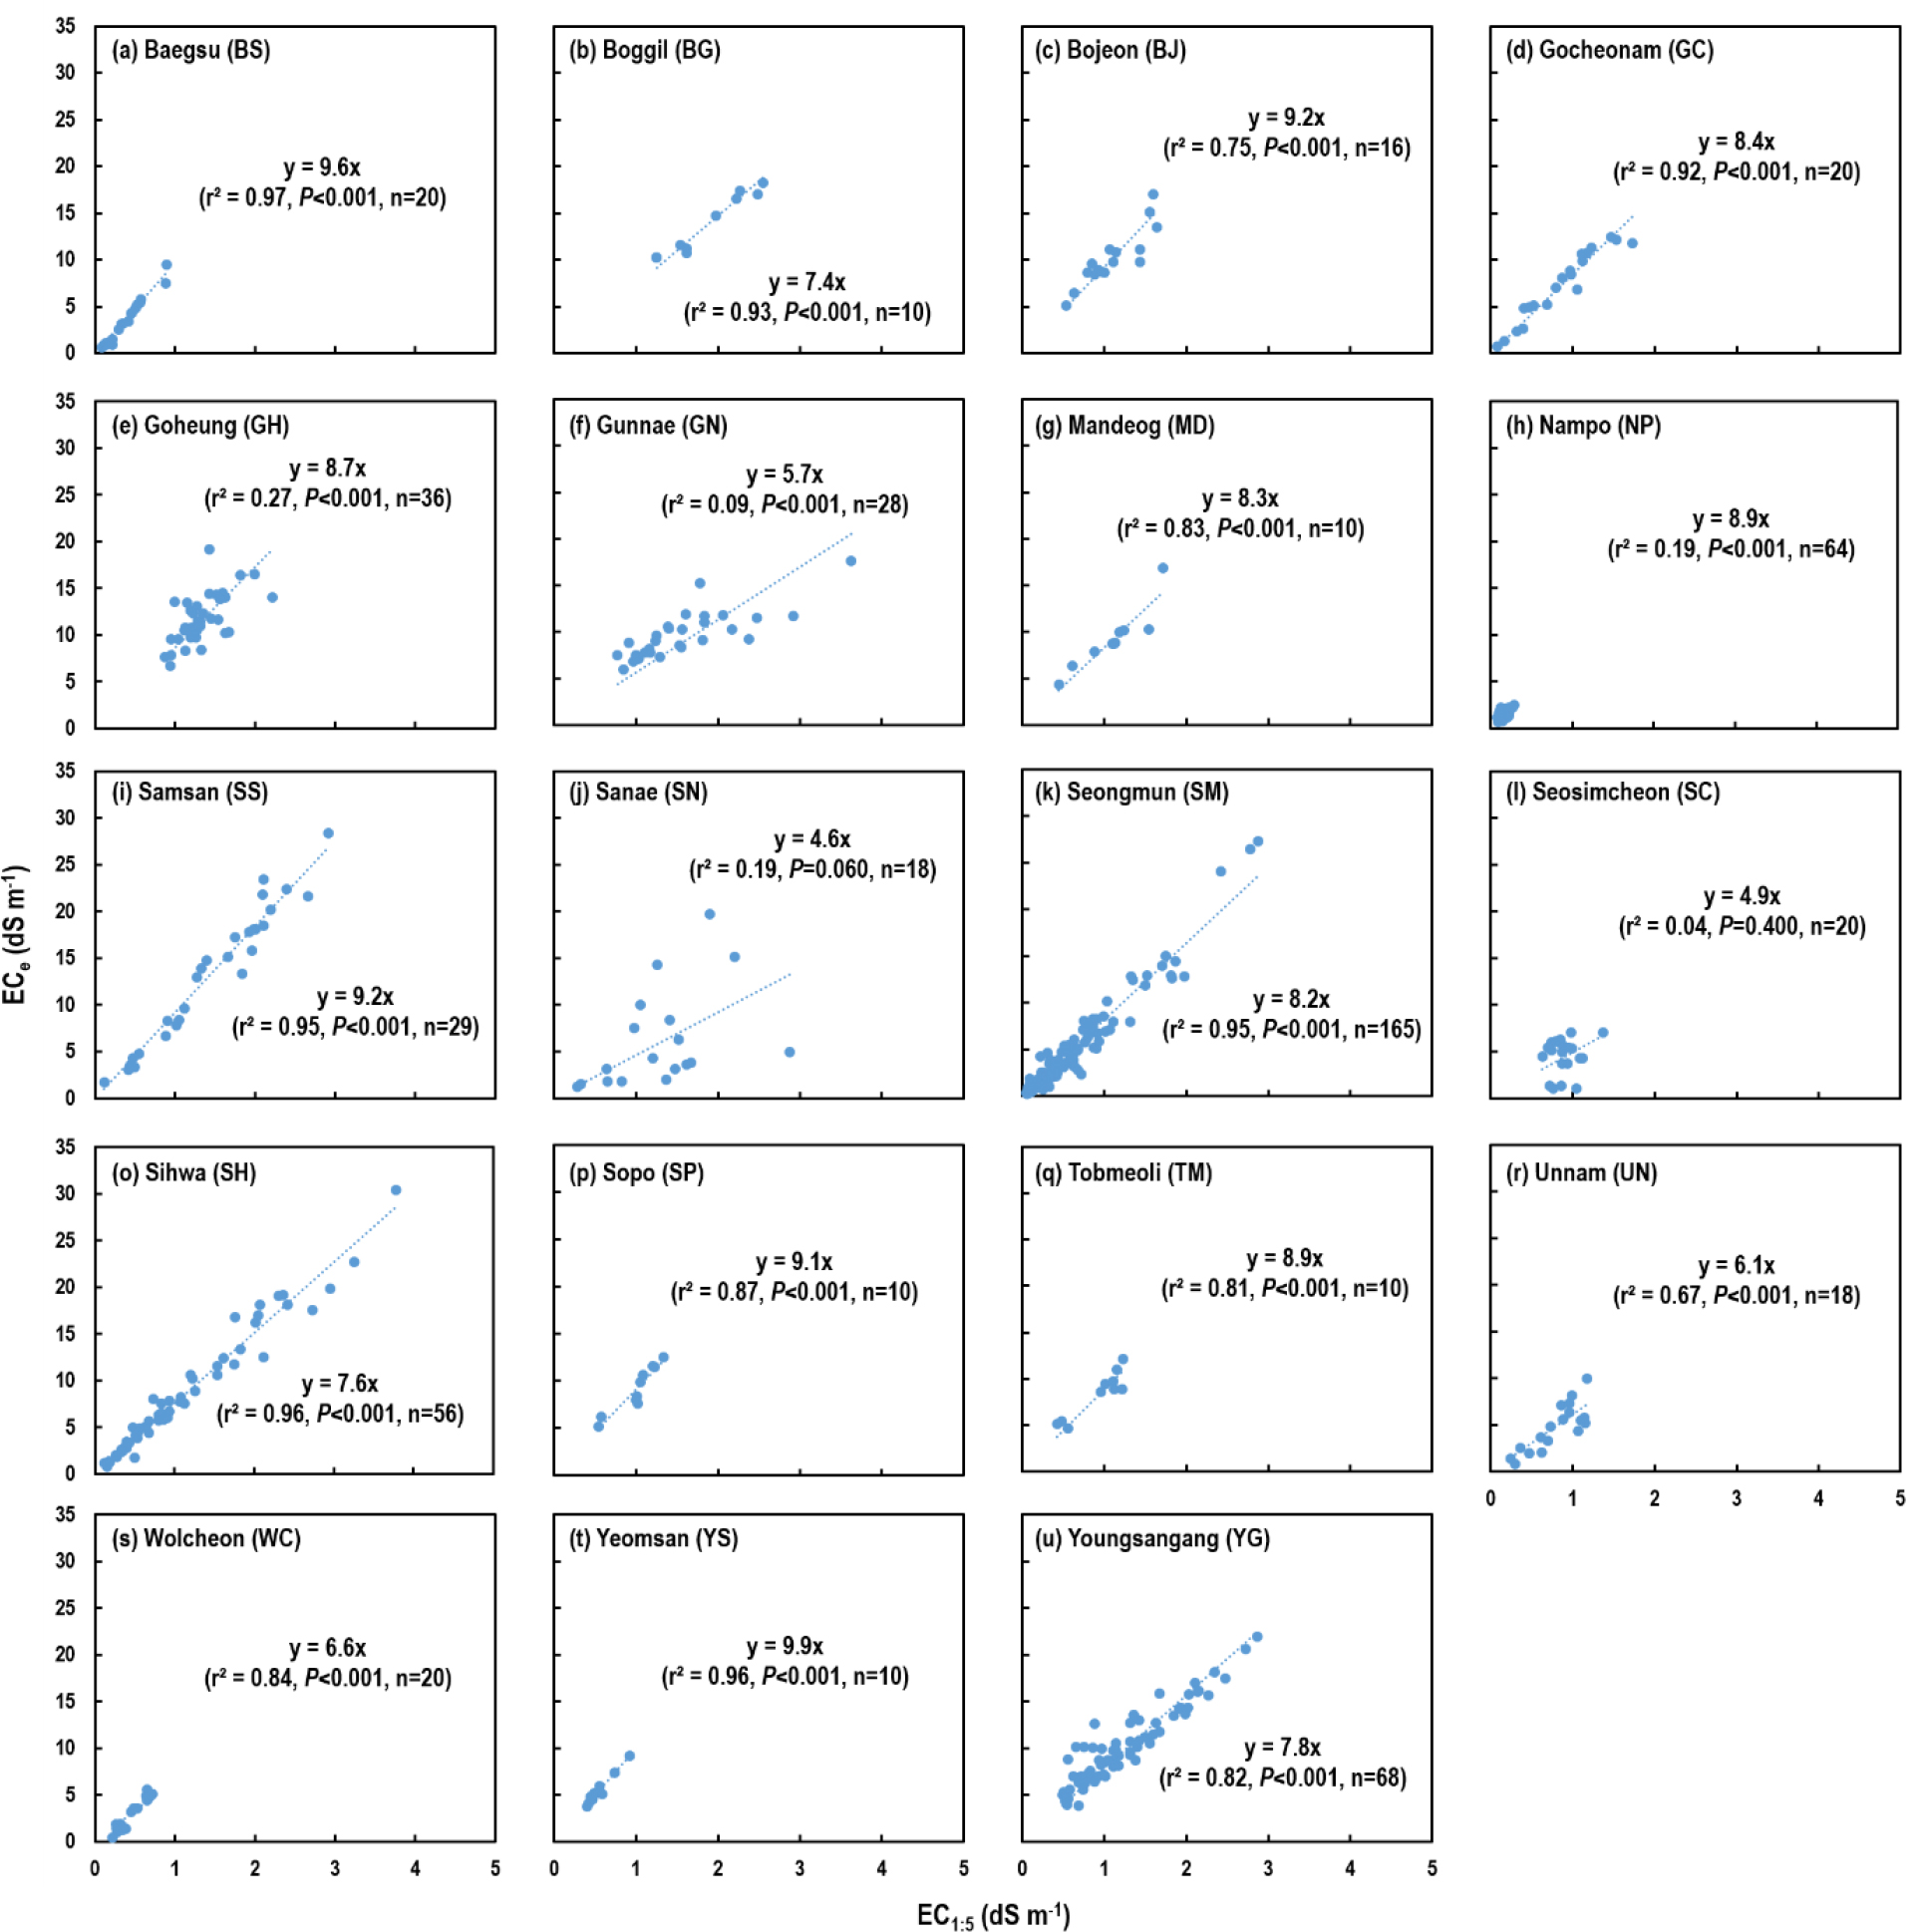
Fig. 3
Relationship between electrical conductivity (EC) of 1:5 soil-water extracts (EC1:5) and EC of saturated soil paste (ECe) of soils of each reclaimed tidelands.
Table 2.
Conversion factors for electrical conductivity (EC) of 1:5 soil-water extracts (EC1:5) to EC of saturated soil paste (ECe) for each studied reclaimed tideland (RTL) soil.
|
RTL† |
Conversion factor
|
|
Baegsu (BS)
|
9.6
|
|
Boggil (BG)
|
7.4
|
|
Bojeon (BJ)
|
9.2
|
|
Gocheonam (GC)
|
8.4
|
|
Goheung (GH)
|
8.7
|
|
Gunnae (GN)
|
5.7
|
|
Mandeog (MD)
|
8.3
|
|
Nampo (NP)
|
8.9
|
|
Samsan (SS)
|
9.2
|
|
Sanae (SN)
|
4.6
|
|
Seongmun (SG)
|
8.2
|
|
Seosimcheon (SC)
|
4.9
|
|
Sihwa (SH)
|
7.6
|
|
Sopo (SP)
|
9.1
|
|
Tobmeoli (TM)
|
8.9
|
|
Unnam (UN)
|
6.1
|
|
Wolchoen (WC)
|
6.6
|
|
Yeomsan (YS)
|
9.9
|
|
Youngsangang (YG)
|
7.8
|
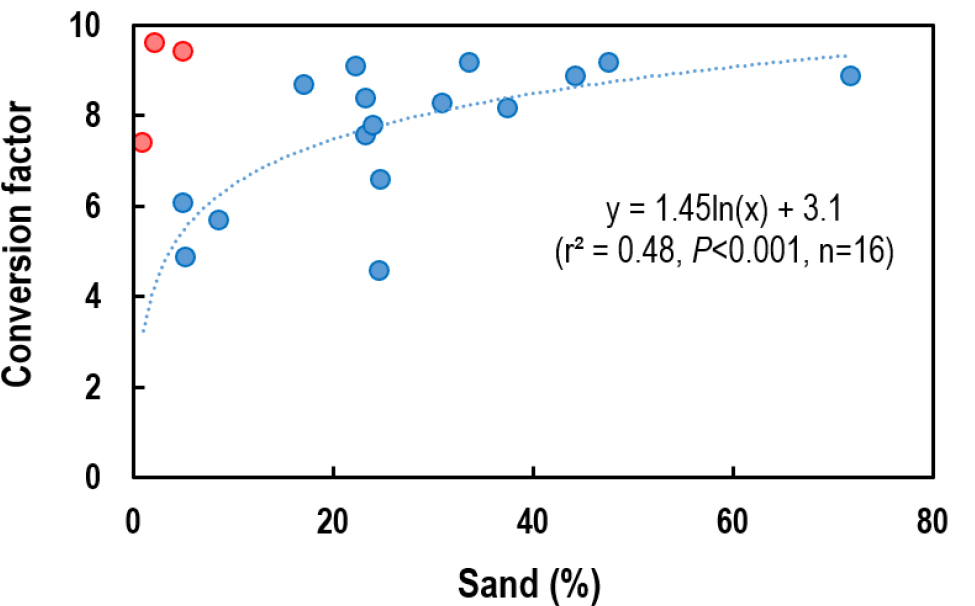
Fig. 4
Correlation of conversion factor of electrical conductivity (EC) of 1:5 soil-water extracts (EC1:5) to EC of saturated soil paste (ECe) with soil sand contents. When data from three reclaimed tidelands including Baegsu, Boggil, Yeomsan, which are indicated by red circle symbols, with relatively low sand content were excluded, the correlation was statistically significant at α = 0.05.
본 연구에서는 일부 시료의 경우 모래함량에 따른 환산계수 변화가 뚜렷하지 않았는데 (Fig. 4), 이는 EC1:5-ECe 환산계수는 토양의 모래 함량 뿐만 아니라 염의 종류와 토양의 양이온교환용량 등 다양한 요인에 의해서도 영향을 받기 때문으로 판단된다 (Park et al., 2019). 이러한 다양한 변수에도 불구하고, 본 연구 결과는 EC1:5-ECe 환산계수에서 모래함량의 중요성을 제시하며, 간척지별 환산계수 다양성을 평가하고 해석하는데 유용하게 활용될 수 있을 것으로 기대된다.
Conclusions
간척지에서 작물의 생산성을 확대하기 위해서는 지속적인 토양 ECe 모니터링이 필요하지만, 분석법의 어려움으로 인해 EC1:5-ECe 환산법이 널리 사용되고 있다. EC1:5-ECe 환산계수는 토성 등 토양의 물리화학적 특성에 따라 상이하며, 간척지 토양의 물리화학성은 간척연수 및 토양 관리 방안 등에 달라질 수 있음에도 불구하고, 간척지별 EC1:5-ECe 환산계수 평가는 여전히 미흡하다. 본 연구에서는 우리나라 경기, 충남, 전남에 위치한 19개 간척지의 EC1:5-ECe 환산계수가 4.6 - 9.9의 범위로 평가되었다. 또한, 모래 함량이 많은 토양일수록 EC1:5-ECe 환산계수가 높아졌다. 따라서, 본 연구에서 평가한 간척지별 EC1:5-ECe 환산계수와 모래함량에 따른 환산계수 변화 결과는 간척지 토양의 염농도를 모니터링 및 평가에 활용될 수 있을 것으로 기대된다.
Acknowledgements
This work was carried out with the support of the “Cooperative Research Program of Agriculture Science and Technology Development (Project No. PJ0318732022)”, Rural Development Administration, Republic of Korea.
References
Aboukila, E.F. and E.F. Abdelaty. 2017. Assessment of saturated soil paste salinity from 1:2.5 and 1:5 soil-water extracts for coarse textured soils. Alexandria Sci. Exch. J. 38:722-732.
10.21608/asejaiqjsae.2017.4181Aboukila, E.F. and J.B. Norton. 2017. Estimation of saturated soil paste salinity from soil-water extracts. Soil Sci. 182:107-113.
10.1097/SS.0000000000000197Al-Busaidi, A., T. Yamamoto, C. Bakheit, and P. Cookson. 2006. Soil salinity assessment by some destructive and non destructive methods in calcareous soils. J. Jpn. Soc. Soil Phys. 104:27-40.
Castillo, E.G., T.P. Tuong, A.M. Ismail, and K. Inubushi. 2007. Response to salinity in rice: Comparative effects of osmotic and ionic stresses. Plant Prod. Sci. 10:159-170.
10.1626/pps.10.159Chi, C.M. and Z.C. Wang. 2010. Characterizing salt-affected soils of Songnen Plain using saturated paste and 1:5 soil-to-water extraction methods. Arid Land Res. Manage. 24:1-11.
10.1080/15324980903439362Gee, G.W. and J.W. Bauder. 1986. Particle size analysis. p. 383-412. In G.S. Campbell et al. (ed.) Methods of soil analysis, Part 1: Physical and mineralogical methods. American Society of Agronomy and Soil Science Society of America, Madison, WI, USA.
10.2136/sssabookser5.1.2ed.c15Gharaibeh, M.A., A.A. Albalasmeh, and A. El Hanandeh. 2021. Estimation of saturated paste electrical conductivity using three modelling approaches: Traditional dilution extracts; saturation percentage and artificial neural networks. Catena 200:105141.
10.1016/j.catena.2020.105141Gibbs, S. 2000. How to texture soils & test for salinity, Salinity Notes No. 8. NSW Agriculture, New South Wales, Australia.
He, Y., T. DeSutter, L. Prunty, D. Hopkins, X. Jia, and D.A. Wysocki. 2012. Evaluation of 1:5 soil to water extract electrical conductivity methods. Geoderma 185:12-17.
10.1016/j.geoderma.2012.03.022Hogg, T. and J. Henry. 1984. Comparison of 1:1 and 1:2 suspensions and extracts with the saturation extract in estimating salinity in Saskatchewan soils. Can. J. Soil Sci. 64:699-704.
10.4141/cjss84-069Jeong, Y.J., S.S. Lim, H.J. Park, B.S. Seo, S.I. Park, J.H. Ryu, K.S. Lee, D.Y. Chung, H.Y. Kim, and S.H. Lee. 2020. Evaluation of crop suitability for reclaimed tideland soils using soil and water salinity and soil texture. Korean J. Soil Sci. Fert. 53:70-81.
10.7745/KJSSF.2020.53.1.070Kargas, G., I. Chatzigiakoumis, A. Kollias, D. Spiliotis, I. Massas, and P. Kerkides. 2018. Soil salinity assessment using saturated paste and mass soil:water 1:1 and 1:5 ratios extracts. Water 10:1589.
10.3390/w10111589Kargas, G., P. Londra, and A. Sgoubopoulou. 2020. Comparison of soil EC values from methods based on 1:1 and 1:5 soil to water ratios and EC
e from saturated paste extract based method. Water 12:1010.
10.3390/w12041010Khorsandi, F. and F.A. Yazdi. 2011. Estimation of saturated paste extracts' electrical conductivity from 1:5 soil/water suspension and gypsum. Commun. Soil Sci. Plant Anal. 42:315-321.
10.1080/00103624.2011.538885KMA. 2021. Annual climatological reports. Korea Meteorological Administration, Seoul, Korea.
Lee, K.S., Y.Y. Oh, H.K. Ock, H.S. Lee, B.H. Kang, and K.H. Jung. 2022. Emergence rates of sesame, perilla, peanut, and sorghum under different soil moisture conditions and amendment treatments in Saemangeum reclaimed land. Korean J. Soil Sci. Fert. 55:139-147.
10.7745/KJSSF.2022.55.2.139Lee, S.H., B.D. Hong, Y. An, and H.M. Ro. 2003. Estimation of conversion factors for electrical conductivities measured by saturation-paste and 1:5 water extraction. Korean J. Soil Sci. Fert. 36:193-199.
Lim, S.S., H.I. Yang, H.J. Park, S.I. Park, B.S. Seo, K.S. Lee, S.H. Lee, S.M. Lee, H.Y. Kim, and J.H. Ryu. 2020. Land-use management for sustainable rice production and carbon sequestration in reclaimed coastal tideland soils of South Korea: A review. Soil Sci. Plant Nutr. 66:60-75.
10.1080/00380768.2019.1674121Liu, G.M., J.S. Yang, and R.J. Yao. 2006. Electrical conductivity in soil extracts: Chemical factors and their intensity. Pedosphere 16:100-107.
10.1016/S1002-0160(06)60031-3Monteleone, M., G. Lacolla, G. Caranfa, and G. Cucci. 2016. Indirect measurement of electrical conductivity and exchangeable cations on soil water extracts: Assessing the precision of the estimates. Soil Sci. 181:465-471.
10.1097/SS.0000000000000181Park, H.J., H.I. Yang, S.I. Park, B.S. Seo, D.H. Lee, H.Y. Kim, and W.J. Choi. 2019. Assessment of electrical conductivity of saturated soil paste from 1:5 soil-water extracts for reclaimed tideland soils in south-western coastal area of Korea. Korean J. Environ. Agric. 38:69-75.
Pitman, M.G. and A. Läuchli. 2002. Global impact of salinity and agricultural ecosystems. p. 3-51. In A. Läuchli and U. Lüttge (ed.) Salinity: Environment-plants-molecules, Kluwer Academic Publishers, Netherlands.
10.1007/0-306-48155-3_1Rhoades, J., N.A. Manteghi, P. Shouse, and W. Alves. 1989. Estimating soil salinity from saturated soil-paste electrical conductivity. Soil Sci. Soc. Am. J. 53:428-433.
10.2136/sssaj1989.03615995005300020019xRichard, M. and P. Gouny. 1965. Soil salinity test. Ann. Sci. Agron. Fr. Etrang. 16:625-635.
Ryu, J.H., S.H. Lee, Y.Y. Oh, and B.H. Kang. 2021. Effect of gypsum application and subsoiling on soil physico-chemical property of Saemangeum reclaimed tide land. Korean J. Soil Sci. Fert. 54:48-57.
10.7745/KJSSF.2021.54.1.048Seo, B.S., Y.J. Jeong, K.S. Lee, and W.J. Choi. 2021. Effects of equilibrium time on electrical conductivity measurements using soil-water extracts and soil saturated paste. Korean J. Soil Sci. Fert. 54:257-263.
10.7745/KJSSF.2021.54.2.257Seo, B.S., Y.J. Jeong, N. Baek, H.J. Park, H.I. Yang, S.I. Park, and W.J. Choi. 2022. Soil texture affects the conversion factor of electrical conductivity from 1:5 soil-water to saturated paste extracts. Pedosphere (published online).
10.1016/j.pedsph.2022.06.023Smith, J.L. and J.W. Doran. 1997. Measurement and use of pH and electrical conductivity for soil quality analysis. p. 169-186. In J.W. Doran and A.J. Jones (ed.) Methods for assessing soil quality, SSSA Special Publications No. 49. Soil Science Society of America, Madison, WI, USA.
10.2136/sssaspecpub49.c10Sonmez, S., D. Buyuktas, F. Okturen, and S. Citak. 2008. Assessment of different soil to water ratios (1:1, 1:2.5, 1:5) in soil salinity studies. Geoderma 144:361-369.
10.1016/j.geoderma.2007.12.005US Salinity Laboratory Staff. 1954. Determination of the properties of saline and alkali soils. p. 7-33. In L.A. Richards (ed.) Diagnosis and improvement of saline and alkali soils, Agriculture Handbook No. 60. United States Department of Agriculture, Washington D.C., USA.
Yun, S.I., J.H. Kwak, B.R. Choi, and G.Y. Kim. 2021. Salt removal from soil by winter and spring cultivation of tall fescue and italian ryegrass in Saemangeum reclaimed tidal land. Korean J. Soil Sci. Fert. 54:514-524.
10.7745/KJSSF.2021.54.4.514