

Introduction
Soil properties can have a big influence on the quality of wine that is produced (Lanyon et al., 2004; White 2003). In the book “Understanding Vineyard Soils”, the author Prof. Robert White emphasizes the importance of soils with good physical and chemical quality for viticulture. Soil physical properties such as structure, soil depth, temperature, drainage and soil moisture can directly affect vine root growth. Soil chemical properties such as pH and nutrient concentration affect the vine’s nutrient absorption. It is now known that soil types can significantly affect the composition of wine grapes and the final wine product (Bramley et al., 2011; Wang et al., 2015). Hence, growers should study their soil so that they can manage the vineyards more efficiently and sustainably. By obtaining soil information, growers can determine whether remediation strategies are required to alleviate soil constraints for vine growth, and conversely examine if their farming practices caused negative impacts to soil and environmental conditions. The conventional method for studying soils is to excavate a soil pit to expose the soil profile (White 2003). Soil morphology of the soil is then characterised using field descriptions (such as field texture, structure, colour, pH), horizons are assigned, and finally a soil type can be described. In addition, soil samples are collected from soil horizons or depth increments for chemical analysis (such as K, Ca, Mg) to be conducted in the laboratory. Such characterisation is very comprehensive, however, and can be time consuming and expensive. In addition, profile descriptions can be qualitative and subjective. The collection of geochemical information of the soil can be supported now using new in-field technologies, namely portable X-Ray fluorescence spectrometers (pXRF). These instruments can be used directly in the field, require no soil sample preparation, and can simultaneously measure a wide range of elements that are useful for pedological and edaphological studies. Their use is time and cost effective when compared to traditional laboratory methods. This study will collect both areal and vertical soil information to investigate the soil’s condition at the vineyard of interest in a 3dimension. Outcomes of this study can then be used to support future management decisions. This study has the following objectives:
1.To test the applicability of the pXRF to conduct a 3 dimensional pedological soil survey.
2.To study the chemical composition of the soil across Tallavera Grove vineyard, specifically Ca, Fe, Ti and Zr content, using pXRF.
3.To analyse the elemental concentration of the soil using pXRF to assist with future decisions for vineyard management.
4.To calculate weathering index using the elemental concentrations to explore the pedological history of the soil.
Materials and Methods
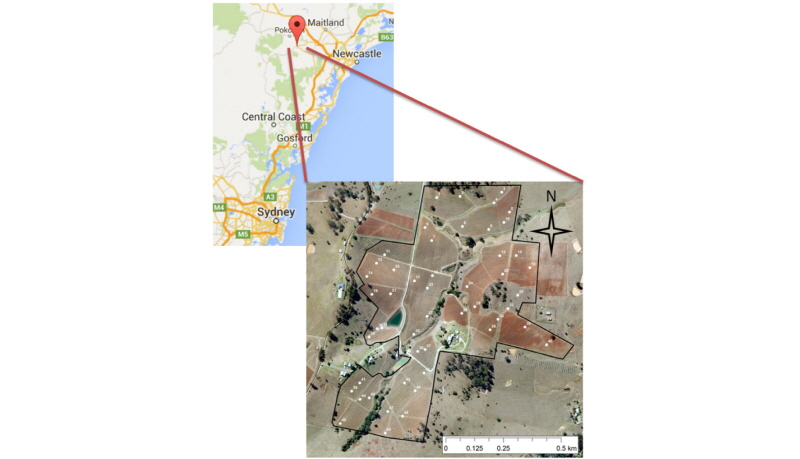
Description of the study site This study was conducted at Tallavera Grove vineyard, which is located in the region of Pokolbin in the lower Hunter Valley in New South Wales, Australia, covering an area of about 30 ha (Fig. 1). The Hunter valley experiences a temperate climate with warm humid summers and relatively cool and humid winters. In the Hunter Valley, the average maximum temperature is 24.1°C, whereas the average minimum temperature is approximately 10.4°C (Bureau of Meteorology 2016). The Annual rainfall is approximately 750 mm. There are two types of soil across the vineyard. The most dominant is a duplex soil referred to as Terra Rossa soil that is observed over pockets of Marl (a form of limestone). The Australian Soil Classification (ASC) soil orders on this property are Calcarosols (Calcisols), Chromosol (Luvisols or Alfisols) and Dermosol (Ultisol or Alfisol). Parent materials of the study area are variable and consist of mudstone, sandstone and limestone. The elevation of this site ranges from 130 m to 190 m. Tallavera Grove vineyard was first established in 1994. It produces signature styles white wines including Semillon, Verdelho and Chardonnay and red wines including Shiraz, Merlot and Cabernet (Tallavera Grove 2015).
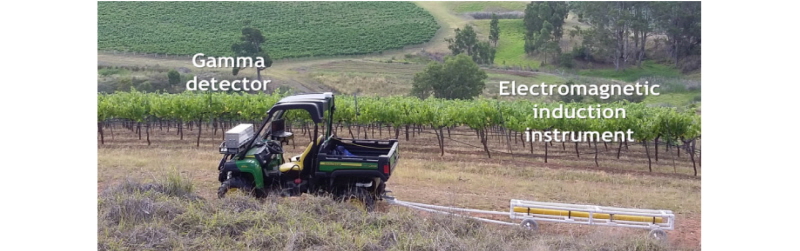
Proximal soil sensing survey To understand the soil’s spatial variation at Tallavera Grove vineyard, a proximal soil sensing survey was conducted using a RSX-1 gamma spectrometer (Radiation Solutions Inc, Mississauga, Ontario, Canada) and an electromagnetic induction instrument (DUALEM- 21; Dualem Inc, Milton, Ontario, Canada) mounted on a John Deere four wheel drive field vehicle (Fig. 2).
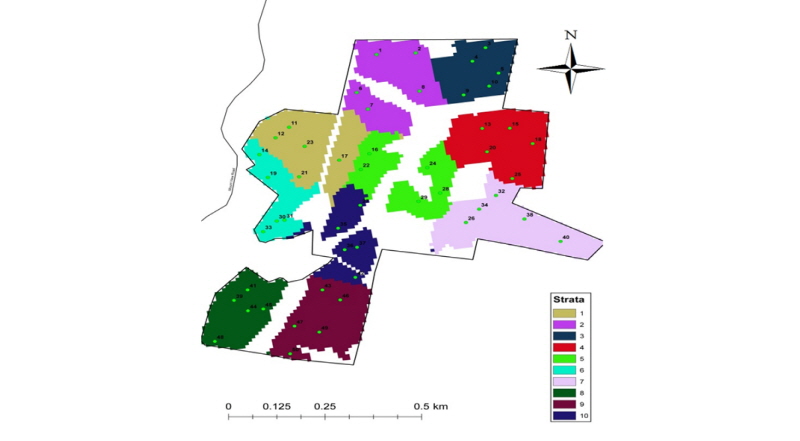
Sampling design The proximal soil sensing survey produced maps of elevation, gamma radiometrics (Regions of interest (ROI’s) of K, Th, U and Total Counts) and apparent electrical conductivity. Based on this ancillary soil information, the location of 50 soil cores was chosen employing the stratified random sampling method. Strata of similar soil responses were determined using the proximal soil sensing survey data. The vineyard (Fig. 3) was stratified into 10 strata and 5 sampling locations were selected randomly within each stratum.
Sample collection Samples were collected with a drill rig extracting soil cores to 1 meter soil dep/th. All soil cores were wrapped tightly and sealed with plastic sleeves to keep the soil cores in field condition, to ensure scanning of the cores in field condition in the laboratory. Most samples were collected just beside the grapevine. Some were beside the road or taken from bare ground.
XRF scanning All samples were scanned in field condition. The cores were halved to establish a fresh, flat surface for pXRF scanning. The 1 m soil cores were divided into five soil depths (0-5, 5-15, 15-30, 30-60, 60-100 cm). Before scanning the halved cores, their photos were taken in order to compare data and real soil features. The cores were scanned using a pXRF (Olympus Innov-X Delta TA Premium pXRF analyser; Olympus, Center Valley, PA, USA). The pXRF measures the total concentration of about 40 elements in the soil. Elements of Ti and Zr were used to calculate the elemental ratio of elements resistant to weathering (Ti/Zr index) (Maynard 1992) Other elements were also used to study the distributional pattern of major elements (Ca and Fe) in the soil. Two pXRF modes were employed to scan the soil cores, the Soil mode and Geochem mode configuration. Soil mode was used for low concentration elements and Geochem was used for high concentration elements and lighter elements. There were three beams (50 kV, 40 kV and 15 kV) in soil mode and there were two beams (50 kV and 10 kV) in Geochem mode. The scanning time for each beam was 30 s, so the total scanning time of soil mode was 90 s and Geochem was 60 s. Soil mode was used for Ti, Zr and Cu and Geochem mode was used for Fe. Performance of the pXRF was monitored by scanning National Institute of Standards and Technology (NIST) reference standards every 40 samples. NIST 2709 is representative of baseline trace element concentrations. NIST 2710 is represen-tative of highly elevated trace element concentrations. NIST 2711a is representative of moderately elevated trace element concentrations. The aperture of the instrument was kept clean by wiping with delicate task wipers (Kimtech Science KimWipes) to prevent soil or dust from contaminating the aperture window after each scan. The top 10 cm of the soil cores were scanned every 2.5 cm and below 10 cm, they were scanned at 5 cm intervals. However, some cores were scanned every 10 cm throughout the 1m core.
Data analysis Weathering index (Ti/Zr index) was calculated with the data from elemental concentrations (Ti and Zr). Herrmann (1998) compared two elements in scatter plots and concluded that Ti and Zr are the most reliable immobile elements and concluded that this pair of elements is very useful to identify altered zones in mineral prospecting studies. Immobile elements are useful to identify unrecognisable altered volcanic rocks where the concentration of mobile elements may have been significantly modified. They are also useful to estimate the quantity of mass changes of mobile elements. Ti and Zr are both immobile elements that remained relatively constant throughout the weathering processes. Ti/Zr values can therefore indicate the source of parent materials. When Ti/Zr ratio of soils differs significantly from that of the underlying parent materials, it can indicate the soil was transported rather than weathered in situ. Soil geochemical maps were produced using kriging and regression kriging method. The theory of kriging is that unknown neighborhood data can be predicted with known data (Odeh et al., 1995). The method of regression kriging is a combination of kriging data and linear regressions data. Covariates used in the regression kriging analysis include digital terrain attributes obtained from the digital elevation model (DEM) (elevation, slope, curvature), gamma K, Th, U, and ECa. Most data were analysed using the open source software R (R Core Team 2013), as well as JMP, Microsoft Excel and ArcGIS. Tree analysis was created by JMP. For creating this, DEM (elevation, slope, curvature), gamma K, and ECa were used.
Results and Discussion
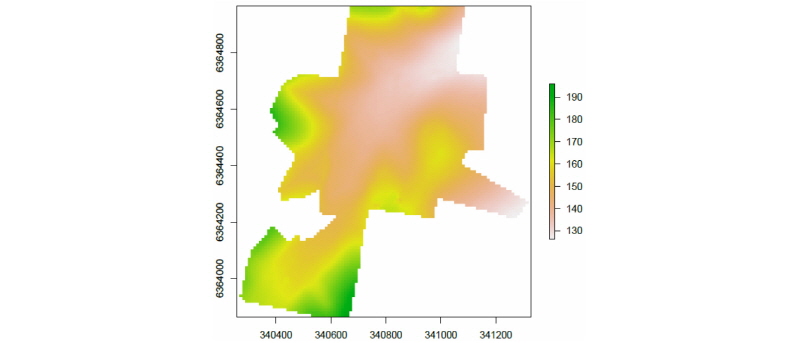
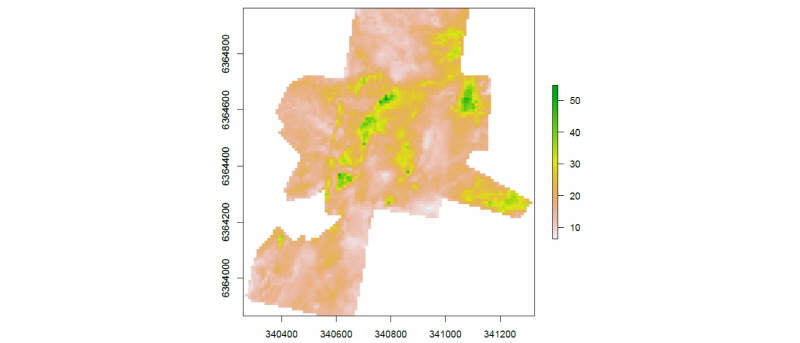
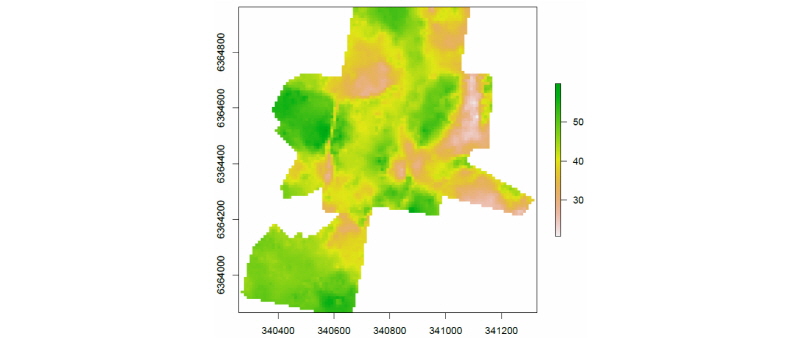
Proximal soil sensing survey The following paragraph describes maps created by the proximal soil sensing survey and used in the stratified random sampling design. Fig. 4 shows the DEM of the study area at a resolution of 10 m, produced from high resolution Differential GPS (DGPS) data. The western part of the study area is surrounded by hills and from west to east, the elevation is decreasing. The lowest elevation is 130 m and the highest elevation is 190 m. The western side of the study area is higher in slope than the eastern side. Flat areas occurred in the middle of the upper region of the vineyard. Profile curvature is the derivative of slope, areas with positive values indicate convex slopes (hill) and negative values indicate concave slopes, values near zero indicate that the surface is linear. Profile curvature depicts the acceleration or deceleration of water flow across the surface. According to the elevation and curvature maps, the main direction of water flow through the study area is from west to east. The map of the apparent electrical conductivity (ECa) obtained from the electromagnetic induction instrument (Fig. 5) shows values that are relatively low (10-20 mS m-1) and quite uniform throughout the area. Higher ECa values are observed in the middle of the vineyard. High conductivity indicates higher soil moisture or clay content. Fig. 6 shows the radiometric map of the region of interest of potassium. There are three main locations where the concentration of potassium concentration is low. The largest value is in the East. The second one is in the North-West. The lowest value is in the South-West. Areas of high gamma K usually coincide with area of high clay content (as K is a component of the crystal structure of clay minerals).
Spatial variation of major elements across Tallavera Grove vineyard In the following, the spatial variation of major element concentrations across Tallavera Grove vineyard with soil depth is presented and discussed.
Calcium The original distribution of Ca-content is heavily skewed, so log transformed data were used instead in further analysis. The variability of soil Ca concentrations across Tallavera Grove is visible in the two maps of the subsoil layers (30-60 cm and 60-100 cm depth) and aligns with the location of the Ca-rich parent material (Marl, a form of limestone) as identified by the owner of Tallavera vineyard (Fig. 7). The presence of limestone is not continuous through the vineyard, but available in pockets across the landscape. Grapes for the Shiraz variety are grown where the limestone is present (personal conversation with the wine maker at Tallavera Grove). Thus the use of pXRF measurement is useful in identifying and delineating soils derived from marl. The soil with Ca-rich parent material or marl is known as Terra Rossa. It is characterised through a red-brown colour and clay rich texture that overlies highly calcareous material. It is a desirable soil for vineyards, and also known for producing premium wines (Banks and Sharpe 2006). Some argue that Terra Rossa is formed by direct weathering of the calcareous materials, while others argue that it could also have resulted from additional materials from Aeolian processes (Mee et al., 2004). The soil is rich in soluble oxides of the elements common in rocks, namely those of Fe, Al and Ti. Because the Terra Rossa is an oxic environment, the iron oxide formed is usually hematite (Fe2O3) which has a red colour (Hancock and Huggett 2006; Mee et al., 2004). The limestone is a sedimentary rock formed by precipitation from solution or form of detrital materials such as calcium carbonate shells and skeletons. There are many benefits from limestone for growing vine (White 2003). Limestone increases the value of pH and improves soil physical properties. The high value of pH (up to 8.5) is very important for producing high quality wines because the soil quality is changed due to the pH. Furthermore, the vineyard soil should have a high infiltration rate because the roots of grapes are very sensitive to waterlogging. The maximum number of days of waterlogging that the vine can stand is limited to one day (Kobayashi et al., 1963). However, the wine requires a large quantity of water for growth and maintenance. Therefore, limestone is required because it increases water holding capacity. Moreover, limestone improves soil structure. Good soil structure can translate to optimal CEC (Cation Exchange Capacity) which is the ability of holding positively charged ions for vine nutrient (Brady and Weil 2010). Ca is a macronutrient required as a component of cell membranes and cell wall structure and for enzymatic processes. Ca also influences physiological disorders such as bunch stem necrosis and the skin strength of berries (Proffitt and Campbell-Clause 2012). Therefore, it is important to know where the limestone is located. Conventionally, HCl (Hydrochloric acid) has been used for checking the presence of limestone. However, determining the concentration of Ca using pXRF (Fig. 7), makes it possible to identify Ca-rich areas and therefore, limestone occurrence. Using quantitative data acquired with pXRF, is a better way for making decisions for future manage-ment. Moreover, the addition of lime is recommended where the soil is too acidic, soil remediation purposes.
Iron The concentration of Fe is increased with increasing depth. However, the east and south west part of the vineyard show constant low concentrations (Fig. 8). The highest concentration is about 6% and the lowest concentration is about 0.5%. The average concentration is about 4%. This concentration is similar to the Fe content of Terra Rossa soil of Coonawarra, South Australia (Mee et al., 2004). However, the concentration of Fe element in the east side is low (Fig. 8). Mee et al., (2004) found a large increase of Fe with depth, indicating transition of sandy A to clayey B horizons. We do not observe this big increase across the whole area, however there are areas with duplex texture (Fig. 8). Fe content is highly correlated with clay content (Zhu et al., 2011), with about 0.6% of total Fe in the soil equal to approximately 10% of clay. Based on this value, the duplex soil can be predicted by comparing the Fe content of the top soil (0-5 cm) and subsoil (30-60 cm) (Fig. 9). In the Australian soil classification system, the definition of a duplex or texture-contrast soil refers to a texture difference of 20% between the A and B horizon (Northcote et al., 1975). Therefore, a 1.2% difference of total Fe content between the topsoil and subsoil indicates that the soil is duplex. Areas of duplex soil are shown in Fig. 9, mainly located in the middle part of the vineyard. The total Fe content can therefore be used as an indicator for the degree of soil profile development. The red colour of the soils also indicates that Fe is primarily present in the form of hematite. Iron is also one of the micronutrients important for plant growth. If the concentration of Fe is larger than 30 ppm, the soil is suitable for growing vines (White 2003). If the concentration falls below 30 ppm, younger leaves become yellow and older leaves turn pale green to yellow, but leaf veins remain a darker green colour (Whiting et al., 2014)
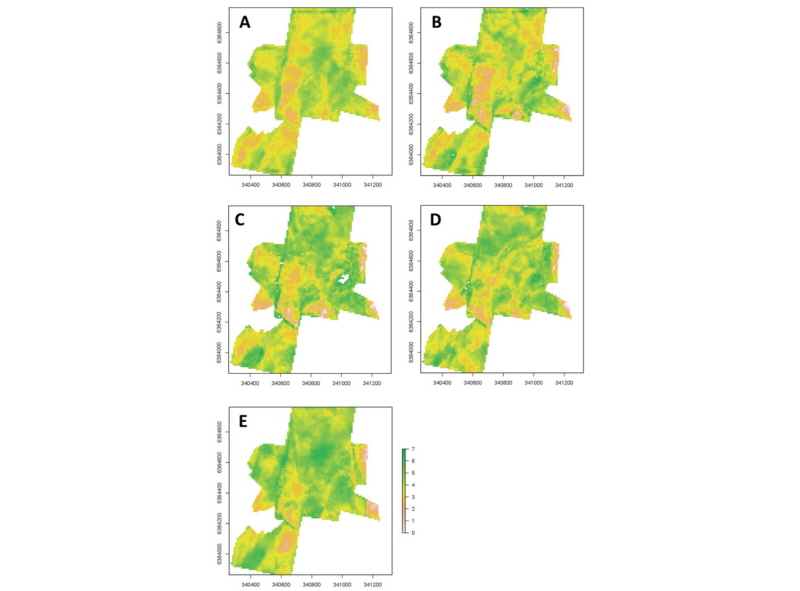
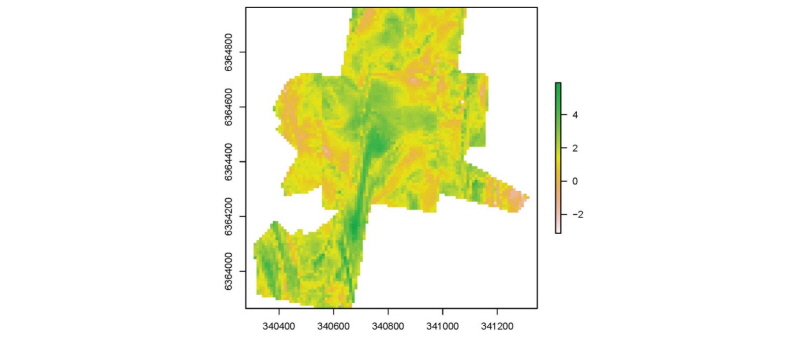
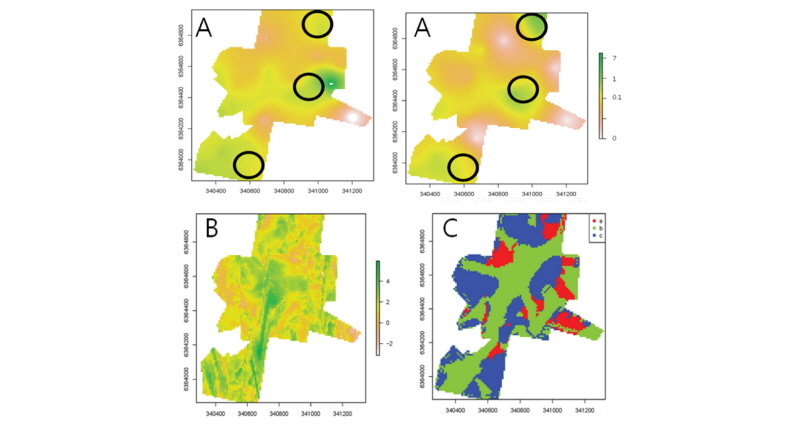
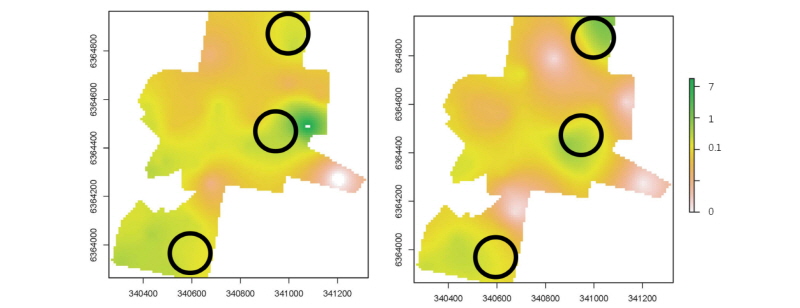
Ti/Zr index As outlined in the Materials and Methods section, the Ti/Zr index can inform on the origin of parent materials. For a soil profile weathered in-situ, it is assumed that the Ti/Zr index value is relatively similar with depth, as both elements are resistant to weathering. Our results show, however, that the Ti/Zr index value varies with depth in some parts of Tallavera Grove vineyard (Fig. 10). This can be caused by the deposition of materials from elsewhere (Aeolian or water erosion) (Dickson and Scott 1998). Three patterns of the value of the Ti/Zr ratio with depth occur at Tallavera Grove Vineyard. The first one shows that the values are constant throughout the soil profile (Fig. 11 A). The second one shows a linear increase with depth, i.e. a gradational change (Fig. 11 B). The third one shows an increase in the middle of the profile, or a duplex change (Fig. 11 C). As outlined before, we used our decision tree modelling analysis of environmental variables to investigate whereabouts the three soil profile development patterns exist in the landscape (Fig. 12). Results of this analysis show that the first split of the decision tree occurred where the slope = 0.1. When the slope is greater than 0.1, pattern C (duplex) is dominant. Following this branch curvature is the next most important covariate. A curvature threshold of less than 0.0018 effectively isolates all pattern B profiles (gradational). Meanwhile, when the curvature is greater than 0.0018, pattern C is again dominant (duplex). Gamma K and DEM (elevation) then further discriminate between the patterns. On the other hand, when the slope is less than 0.1, B (gradational) is the dominant pattern. ECa is the next most significant covariate following this branch. When the ECa is higher than 47 mS m-1, a mix of pattern B and C is isolated, but when ECa is lower than 47, a mix of patterns A and B is isolated. The decision tree model was then applied to the covariate data to predict the distribution of the three profile patterns across Tallavera Grove vineyard. Fig. 13 shows the decision three modelling outcome spatially across Tallavera Grove vineyard and informs on the change of soil development at the study site. Most locations of pattern B (gradational) are in areas of low elevation and slope which are depositional areas. In the B pattern, radiometric K is low. The C pattern (duplex) is situated in areas of high slope and elevation as well as areas of high radiometric K. The pattern of A is in between pattern B and C. Therefore it is suggested that although in situ weathering is dominating in this vineyard, transport of soil material due to water erosion occurred. Soil material is constantly deposited in the low lying areas (pattern B, gradational) and in some cases the material is mixed within the profile due to cultivation practices (pattern C, duplex). Areas with uniform Ti/Zr values (pattern A) mostly occur in erosional landscape position in high slope areas. Ashley and Driese (2000) inform that with the Ti/Zr index, it is possible to identify different parent materials. The map of Ti/Zr at depth of 60-100 cm (Fig. 10 E) shows that the area is mainly dominated by parent materials with relatively high Ti/Zr values (about 30) and some areas have low Ti/Zr values (around 10). The limestone locations coincide with areas of high Ti/Zr values.
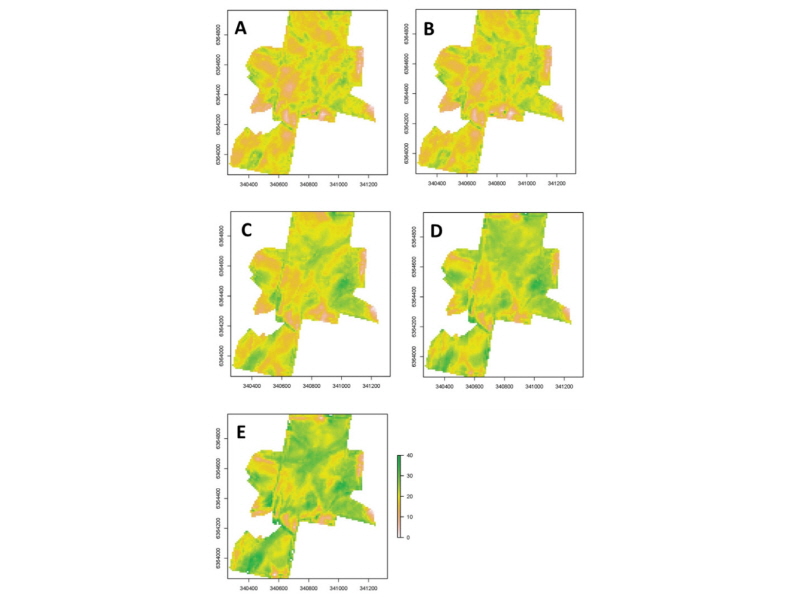
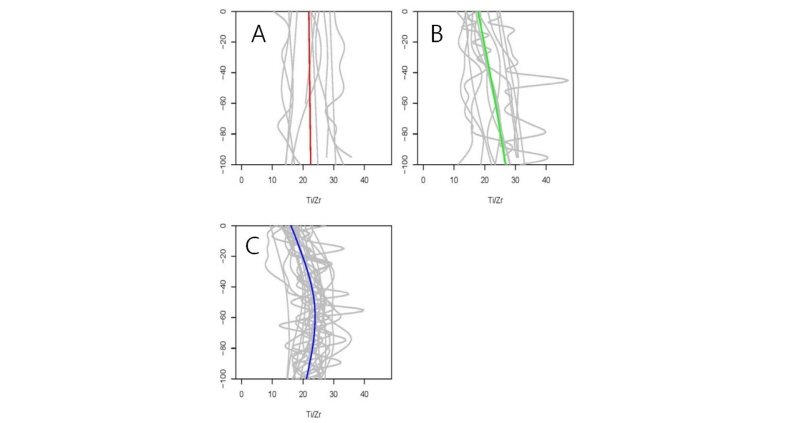
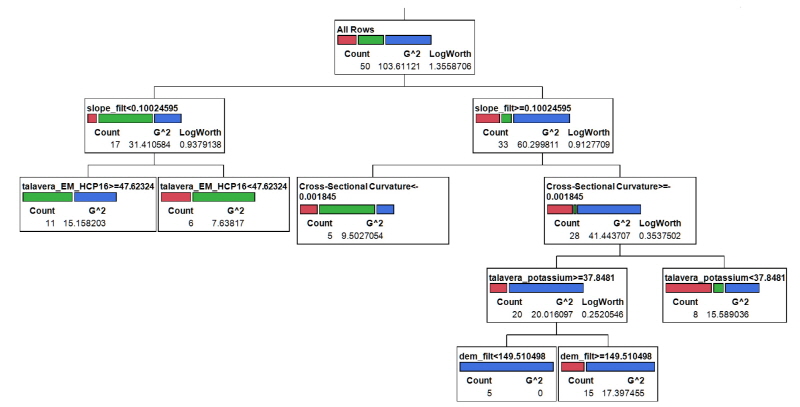
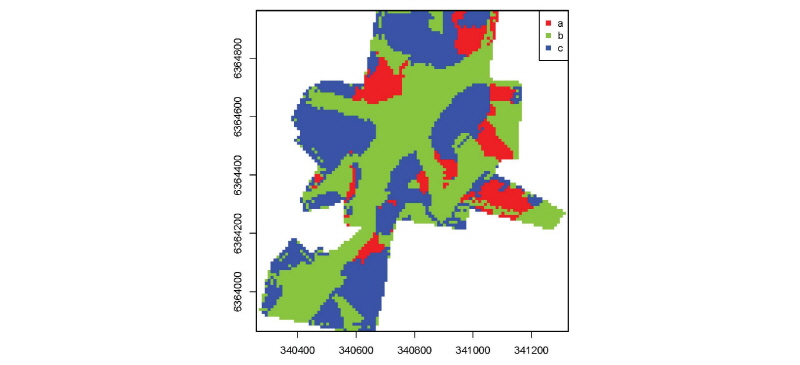
Fig. 13
Three profile pattern of Ti/Zr index from tree decision modelling (Fig. 12). Red indicates uniform, Green is gradational, and Blue is duplex.
Conclusions
In this study, pXRF was used to measure the variation of the soil’s elemental concentration across Tallavera Grove vineyard, to ultimately perform 3D geochemical mapping. Geochemical maps of Tallavera Grove vineyard, showing the spatial variation of major elements important for wine production were produced. These maps can be useful for current vineyard management and future decision-making for producing high quality wine.
Maps showing the spatial distribution of Ca were used to identify locations of Ca-rich parent materials (Marl, a form of limestone). Soils formed on limestone have optimal soil chemical (pH) and physical properties for viticulture. Hence, identifying the location of Marl using pXRF measurements of Ca is an important source for management decisions. The total Fe content across Tallavera Grove vineyard is higher than the concentration of Fe where Fe deficiency for plants occurs (30 ppm). Moreover, Fe content is highly correlated with clay content. The Fe content can therefore be used to inform on the location of duplex soils across Tallavera Grove vineyard and can thus also be employed to inform on the degree of soil profile development. A weathering index was used in this study to explore the weathering history of the soils at Tallavera Grove vineyard, the elemental ratio of Ti/Zr. The ratio of Ti/Zr was used for identifying different parent materials and possible erosional processes. Three types of soil profile development patterns were identified, ‘erosional’ where Ti/Zr is uniform, ‘depositional’, where Ti/Zr increases linearly with depth, and ‘mixed’ where Ti/Zr is the highest in the middle of the profile.
Overall, this study uses quantitative soil information to explore the pedological history of soils. This information can be utilized to inform on future management decisions. Therefore, with this current information, wine producers can identify the areas they need to focus on to maintain the production of high quality wine. With this quantitative information, wine can be produced more efficiently and sustainably. This study can be applied not only for fine wine production, but also for production of high value crops.
