Original research article

Korean Journal of Soil Science and Fertilizer. 30 November 2020. 431-445
https://doi.org/10.7745/KJSSF.2020.53.4.431

ABSTRACT


MAIN

  • Introduction

  • Materials and Methods

  •   공시 토양 및 바이오차 제조

  •   토양 및 바이오차 특성분석

  •   시험구 처리 및 항온배양시험

  •   가스 flux 측정 및 분석

  •   통계분석

  • Results

  •   토양의 화학성 변화

  •   CO2 배출

  •   N2O 배출

  • Discussion

  •   탄소 저장

  •   아산화질소 감축

  • Conclusions

Introduction

농경지에서 작물 재배 후 발생하는 부산물 바이오매스는 연간 1,000만 톤 이상으로 추정되고 있다 (Park et al., 2011). 볏짚 등의 부산물은 토양에 환원되거나 가축 사료로 이용되고 있지만, 활용도가 낮은 부산물은 농경지 주변에 버려지는 실정이다. 더욱이 이런 부산물을 소각할 경우 각종 유해가스와 온실가스가 발생하게 된다 (Zhang et al., 2008). 따라서 활용도가 낮아 소각되는 부산물을 바이오차로 변환하여 농경지에 활용하면 바이오매스 자원의 재활용 및 환경적 측면에서 장점이 있다.

바이오차 (Biocahr)는 바이오매스 (Biomass)와 숯 (Charcoal)의 합성어로, 바이오매스를 산소가 없는 환경에서 열분해하여 만든 탄소 함량이 높은 고형물이다. 바이오매스 내 탄소는 열분해를 거치면서 안정된 형태의 방향족 구조로 재배열돼 토양 미생물에 의해 쉽게 분해되지 않기 때문에 바이오차를 토양에 투입하면 탄소를 반영구적으로 토양에 격리한다 (Lehmann, 2007; Lehmann and Joseph, 2009). 또한, 바이오차는 일반적으로 높은 pH (Park et al., 2015; Rajapaksha et al., 2015), 양이온 교환 용량 (CEC, Cation exchange capacity) 그리고 넓은 비표면적을 갖는다 (Singh et al., 2010; Spokas, 2010). 따라서, 수분과 양분 보유능이 큰 바이오차를 밭 농경지에 투입하면 토양 개량 효과에 의해 작물 생산성이 증진되는 것으로 보고되고 있다 (Li et al., 2017; Kang et al., 2018; Wacal et al., 2019). 바이오차의 농경지 활용은 탄소격리 등 기후변화 완화 뿐만 아니라 농업환경을 개선하는 방안이 되고 있다.

전 지구적으로 대기 중의 온실가스 농도는 인간의 활동으로 급격히 증가하였다. 대표온실가스로써 이산화탄소 (CO2), 메탄 (CH4) 그리고 아산화질소 (N2O)의 농도는 각각 산업화 이전의 농도에서 146%, 257% 그리고 122%로 증가하였다 (WMO, 2018). 그중 농경지에서 배출되는 CO2는 주로 토양 내 미생물의 호흡을 통해 배출되고, CH4은 논에서 담수과정 중 유기물의 혐기적인 분해를 통해 주로 배출되며, N2O는 질소가 포함된 비료를 투입하였을 때 토양 내 질소순환 과정을 통해 배출된다 (Singh et al., 2010). 따라서, 밭에서 배출되는 주요 온실 가스는 CO2와 N2O 이다. 특히, N2O는 대기 오존층을 파괴하는 주요 물질이며, 100년 기준 지구온난화잠재력 (GWP, Global warming potential)이 CO2의 298에 달한다 (IPCC, 2007). 산업화 이전의 대기 평균 N2O 농도는 270 ppb이었지만, 2017년 기준 330 ppb에 달하며, 지구온난화 기여율은 6% 이상인 것으로 알려져 있다 (WMO, 2018). 따라서, 밭에서 배출되는 N2O를 효율적으로 저감할 수 있는 저탄소 농업기술이 필요하다 (KREI, 2016).

저탄소 농업기술로써 바이오차의 효과가 주목을 받고 있으며, 바이오차의 양분 보유능에 의해 질소 손실이 감소하여 질소시비량을 감축시킬 수 있다면 N2O 배출 감축도 기대할 수 있다 (Lehmann and Joseph, 2009). 또한, 토양 조건에 따라 다르지만 대체적으로 토양 통기성을 개선, 토양 pH 증진, 질소 부동화를 통해 농경지 토양에서 배출되는 N2O를 저감하거나 (Clough et al., 2010, 2013; Taghizadeh-Toosi et al., 2011; Hale et al., 2012), 질산화와 영향을 주는 미생물을 촉진하여 질산화 과정 중 중간생성물로 배출되는 N2O를 저감할 수 있다고 보고된 바 있다 (Sanchez-Garcia et al., 2014). 또한 우리나라에서도 농경지에 바이오차를 투입하여 토양탄소량을 증가시키고, N2O 배출량을 12.6 - 48.1% 감소하였다는 연구결과도 발표되었다 (Lee et al., 2017). 이와 같은 바이오차 투입에 따른 온실가스 감축 효과는 다수의 실험연구와 리뷰연구에서 정립되었으나, 감축 효율성은 바이오차 원료와 바이오차 제조 방법에 따른 바이오차의 물리화학적 특성 (Gaskin et al., 2008; Amonette and Joseph, 2012)은 물론 기후여건에 따라서도 달라진다 (El-Naggar et al., 2015, 2018; Xu et al., 2018). 그리고 작물 재배를 위한 시비 관리 등의 영농방식에 따라서도 달라진다. 특히 Baggs (2011)는 농경지 토양에서 배출되는 N2O는 대부분 투입된 질소비료에 의한 것으로 평가하였다. 따라서 질소 비료 종류별 농경지에서 배출되는 N2O의 배출양상은 상이할 것이며, 이를 저감하기 위한 바이오차 투입에 따른 효과를 평가하는 연구가 필요하다고 생각된다. 따라서 본 연구의 목적은 우리나라에서 주로 농경지에 투입하는 질소비료를 종류별 (요소, 유안, 유박)로 구분하고 다양한 바이오차 (배 전정가지 바이오차, 왕겨 바이오차, 콩대 바이오차)를 혼용하였을 때 토양 탄소함량, 화학성 변화 및 CO2와 N2O 발생량을 비교 검토하였다.

Materials and Methods

공시 토양 및 바이오차 제조

본 연구는 전라북도 군산시 옥산면에 위치한 밭 토양에서 (35°56'N, 126°45'E) 채취한 토양을 풍건 후 2 mm 체를 통과하여 공시재료로 사용하였다. 시험토양의 입경분포는 모래 44.6%, 미사 40.0%, 점토 15.3%로 구성되고, 토성은 양토로 분류되었다. 토양의 화학적 특성은 토양산도 (pH)는 6.7, 총 탄소 (Total Carbon)는 12.3 g kg-1, 총 질소 (Total Nitrogen)는 0.91 g kg-1, 유효인산 (Available P2O5)은 150.7 mg kg-1, 친환성 양이온 (Exchangeable cation)으로 칼륨, 칼슘, 마그네슘 함량은 각각 0.3, 6.8, 3.3 cmolc+ kg-1 이였다.

본 연구에 사용한 바이오차는 전년도에 발생한 배 전정가지, 왕겨 그리고 콩대를 수거, 건조 과정과 파쇄 등의 전처리 과정을 거친 후 전북 고창의 왕겨숯 제조공장 탄화로를 이용하여 500°C 1시간동안 열분해하여 생산하였다. 생산된 배 전정가지 바이오차 (PB, pear branch biochar), 왕겨 바이오차 (RB, rice hull biochar) 및 콩대 바이오차 (SB, soybean stalk biochar)의 화학적 특성은 Table 1과 같다. 바이오차의 pH는 모두 10.3 이상이였고, T-C 함량은 PB, RB, SB에서 각각 722.6, 566.9, 579.6 g kg-1 이였다. H:C ratio는 PB, RB, SB에서 각각 0.43, 0.37, 0.63이였고, X-ray fluorescence (XRF) 분석을 통해 주요 구성성분을 파악할 수 있으며, 바이오차의 구성성분과 비율을 분석한 결과 바이오차의 50.7 - 70.6%는 c-matrix로 탄소가 대부분이고 나머지 무기성분은 대체로 산화물 형태를 나타내어 안정적인 탄소와 산소 결합을 나타낼 것으로 예상된다 (Table 2).

Table 1.

Physicochemical properties of different types of biochars.

Biochar type pH
(1:10)
T-C
(g kg-1)
T-N
(g kg-1)
T-H
(g kg-1)
H:C ratio Surface area
(m2 g-1)
PB 10.3 722.6 12.4 25.9 0.43 3.8
RB 10.8 566.9 5.7 17.6 0.37 159.6
SB 10.8 579.6 19.6 30.6 0.63 182.0

PB, pear branch biochar; RB, rice hull biochar; SB, soybean stalk biochar.

Table 2.

X-ray fluorescence analysis of the used biochars.

PB RB SB
Formula Concentration (%) Formula Concentration (%) Formula Concentration (%)
C-matrix62.0C-matrix58.0C-matrix56.6
CaO 15.9 SiO234.6K2O20.5
K2O 13.0 K2O 4.20 CaO 13.8
P2O5 2.88 CaO 0.92 P2O5 2.02
SiO2 1.98 Fe2O3 0.56 SiO2 1.83
Fe2O3 1.17 Cl 0.50 SO3 1.36
MgO 0.64 P2O5 0.47 MgO 1.35
Trace elements 2.43 Trace elements 0.85 Trace elements 2.60

토양 및 바이오차 특성분석

토성은 각각 비중계법으로 분석하였으며, 토성은 미국농무성법 분류기준을 따랐다 (Gee and Bauder, 1986). 토양분석은 토양 화학분석법 (NIAS, 2000)에 준하여 pH, T-C 및 T-N을 분석하였다. pH는 토양을 증류수와 1:5 (W V-1)로 혼합한 후 30분간 교반하여 pH meter (Orion 4 star, Thermo, Singapore)로 측정하였고, 총 탄소 (T-C, Total carbon)는 TOC-meter (Vario TOC cube, Elementar, Germany)로 분석하였다. 총 질소 (T-N, Total nitrogen)는 CN analyzer (Vario Max CN, Elementar, Germany)로 분석하였다. 유효인산은 Lancaster법으로 720 nm 파장에서 비색계 (AU/CARY 300, Varian, Australia)로 분석하였다. 바이오차의 pH는 토양분석 시 사용한 장비를 통하여 바이오차와 증류수를 1:10 (W V-1)로 혼합하여 교반 후 측정하였고, T-C, T-N, 총 수소 (T-H; Total hydrogen) 는 Elemental Analyzer (Vario MACRO cube, Elementar, Germany)로 분석하였고, 비표면적은 Surface area analyzer (BELSORP-max, BEL, Japan)로 분석하였다. 바이오차의 구성성분과 비율은 X선 형광분석 (X-ray fluorescence analysis, S8 TIGER, Bruker)으로 분석하였다.

시험구 처리 및 항온배양시험

시험구 처리는 투입 질소비료원에 따라 요소 (U, urea), 유안 (A, ammonium sulfate) 그리고 유박 (O, oil cake) 처리구로 구분하였다. 다음으로, 투입되는 바이오차 종류에 따라 PB, RB 그리고 SB 처리구로 구분하였고 바이오차의 투입량에 따라 ha 당 5 t, 10 t 투입한 처리구를 정하여 최종적으로 21개의 처리구를 설정하였다 (Table 3).

Table 3.

Description of experimental setup.

Treatments N Fertilizer type Biochar type Biochar input amount (tonnes ha-1)
U Urea
U-PB5 Urea Pear branch biochar 5
U-PB10 Urea Pear branch biochar 10
U-RB5 Urea Rice hull biochar 5
U-RB10 Urea Rice hull biochar 10
U-SB5 Urea Soybean stalk biochar 5
U-SB10 Urea Soybean stalk biochar 10
A Ammonium sulfate
A-PB5 Ammonium sulfate Pear branch biochar 5
A-PB10 Ammonium sulfate Pear branch biochar 10
A-RB5 Ammonium sulfate Rice hull biochar 5
A-RB10 Ammonium sulfate Rice hull biochar 10
A-SB5 Ammonium sulfate Soybean stalk biochar 5
A-SB10 Ammonium sulfate Soybean stalk biochar 10
O Oil cake
O-PB5 Oil cake Pear branch biochar 5
O-PB10 Oil cake Pear branch biochar 10
O-RB5 Oil cake Rice hull biochar 5
O-RB10 Oil cake Rice hull biochar 10
O-SB5 Oil cake Soybean stalk biochar 5
O-SB10 Oil cake Soybean stalk biochar 10

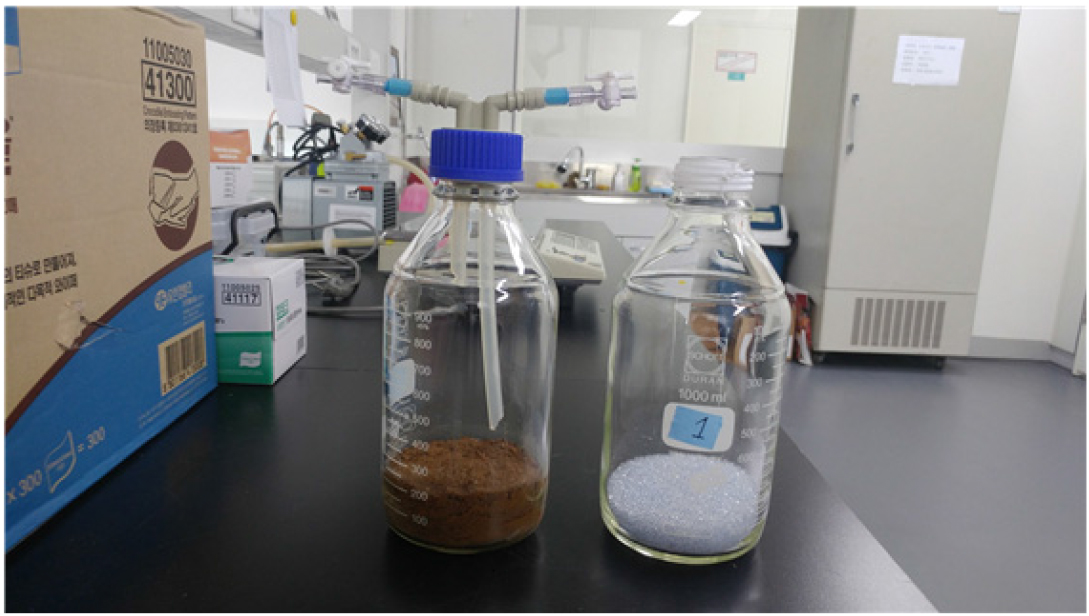
옥수수 표준시비량인 N-P2O5-K2O (17.2-13-13 kg 10a-1)와 돈분 퇴비 (440 kg 10a-1)을 토양에 투입하였다. 각 질소비료의 질소함량인 요소 (N 46.67%), 유안 (N 21.2%), 유박 (N 3.63%)을 고려하여 투입량을 선정하였고, 인산은 용성인비, 칼리는 염화가리 형태로 투입하였다. 바이오차는 각각의 처리구에 맞도록 종류와 투입량을 산정하여 투입하였다. 모든 처리구에 토양과 자재를 투입한 후 혼합하여 closed chamber (∅ 9.0 cm, H 12.5 cm)에 충진하였다 (Fig. 1). 수분은 수분보수력 (WHC, water holding capacity) 70%, 온도는 25°C로 미생물 분해 활성이 가장 활발한 조건으로 (Zeng et al., 2013) 57일간 배양하였다.

https://static.apub.kr/journalsite/sites/ksssf/2020-053-04/N0230530404/images/ksssf_53_04_04_F1.jpg
Fig. 1

Photograph of closed chamber for collection of greenhouse gases (carbon dioxide, nitrous oxide).

가스 flux 측정 및 분석

항온조건에 closed chamber 내 발생되는 CO2와 N2O 농도를 조사하였다. 시료채취 전 진공펌프를 이용하여 새로운 공기를 투입함으로써 closed bottle 내부에 잔존하는 가스를 제거한 후 시료를 채취하였다. 항온배양 초기 1주일은 2일 간격으로 기체시료를 채취하여 분석하였고, 그 후 1주일 간격으로 기체시료를 채취하였다. 기체시료를 채취하지 않은 기간에는 산소가 충분히 공급되도록 마개를 열어 두었고, 증발되는 수분량을 고려하여 매일 추가적으로 증류수를 보충하여 일정한 수분함량이 유지되도록 하였다. 기체시료의 CO2 농도는 불꽃이온화 검출기 (FID detector)로 분석하였으며, 칼럼은 Hayesep Q (80/100 mesh)를 충전한 1/8"×3.66 m의 Stainless steel tubing column, 그리고 검출기 온도는 250°C로 하였고, N2O 농도는 전자포획검출기 (ECD detector)로 분석하였으며 칼럼은 Hayesep Q (80/100 mesh)를 충전한 1/8"×1.83 m의 ultiMetal tubing column, 그리고 검출기의 온도는 350°C로 한 가스크로마토그래피 (7890A, Agilent, USA)로 각각 측정하였다. 세부조건은 Table 4와 같다. CO2, N2O efflux의 계산은 아래의 (Eq. 1)을 이용하였다.

(Eq. 1)
CO2orN2Oefflux(mgm-2day-1)=ρ×VA×Ct×273(T+273)

여기서, ρ는 기체밀도로써 CO2는 1.977 mg cm-3, N2O는 1.967 mg cm-3, V는 챔버 부피 (m3), A는 챔버 표면적 (m2), Ct는 챔버 내 단위시간당 CO2 및 N2O의 증가농도 (mg m-3 day-1), T는 항온온도를 의미한다. 그리고 누적 발생량은 Σ(R×D)을 이용하여 항온기간 동안 총 CO2 및 N2O efflux를 계산하였다. 이때 R은 CO2 및 N2O 발생량 (mg m-3 day-1)이며, D는 시료채취 공백 기간이다.

Table 4.

Analytical conditions of gas chromatographic measurement for CO2 and N2O.

Gas N2O CO2
Detector µECD FID
Column Packing material Hayesep Q Hayesep Q
Materials UltiMetal Stainless steel
O.D. × length 1/8" × 1.83 m 1/8" × 3.66 m
Carrier gas CH4 5.0 % Ar-1 N2
Flow rate Carrier 21 ml min-1 23 ml min-1
Make up 2 ml min-1 2 ml min-1
Temperature Oven 60°C 60°C
Detector 350°C 250°C
Retention time 9 min 9 min
Concentration of calibration gas 0.5 and 1.0 ppmv N2O in N2 400 and 1,000 ppmv CO2 in N2
Loop 2 ml 2 ml

통계분석

다양한 질소비료원과 바이오차 투입에 따른 토양 화학성 변화와 온실가스 배출량에 미치는 영향을 SAS 통계프로그램 (버전 9.1)을 이용하여 통계처리 하였다. 처리간의 차이를 비교하기 위하여 조사된 자료는 일반선형모형을 이용한 ANOVA 검증을 통하여 분석하였다. 또한, F-test 값이 p < 0.05의 범위에서 유의한 경우에만 Duncan`s multiple range test를 실시하였다.

Results

토양의 화학성 변화

밭토양에 상이한 질소원 비료와 바이오차 투입에 따른 토양의 화학성 변화는 Table 5와 같다. 토양 pH는 6.5 - 7.5 범위였으며, 질소원 및 바이오차 종류별, 바이오차 투입량 그리고 바이오차 종류와 투입량의 상호작용에 따라 매우 유의한 차이 (p < 0.001)가 나타났다. 질소원으로 유안을 투입한 처리구에서 pH가 상대적으로 낮았고, 콩대 바이오차를 투입하였을 때 증가하였다. 토양의 T-C 함량은 질소원 종류별, 바이오차 투입량에 따라 매우 유의한 차이 (p < 0.001)가 나타났다. 바이오차를 투입하지 않은 U, A, O 처리구에서 T-C는 각각 13.5, 14.0, 15.3 g kg-1 이였다. 그리고 콩대 바이오차를 ha 당 10 t 씩 투입한 U-SB10, A-SB10, O-SB10 처리구에서 T-C는 각각 29.2, 29.2, 30.6 g kg-1 이였다. 전체 처리구의 토양 T-N 함량은 1.52 - 1.98 g kg-1 이였고, 처리구간 통계적 유의한 차이는 나타나지 않았다. 토양의 C/N 율은 질소원 및 바이오차 종류별, 바이오차 투입량에 따라 매우 유의한 차이 (p < 0.001)가 나타났고, 그리고 바이오차 종류와 투입량의 상호작용에 따라 유의한 차이 (p < 0.01)가 나타났다. 바이오차를 투입하지 않은 U, A, O 처리구에서 C/N은 각각 7.7, 7.8, 9.8 이였다. 그리고 왕겨 바이오차를 ha 당 10 t 씩 투입한 U-RB10, A-RB10, O-RB10 처리구에서 C/N은 각각 17.2, 18.8, 18.4 이였다 (Table 5).

Table 5.

pH, TC, TN and C/N ratio in soil incorporated with different types of biochars under the closed chamber condition.

Treatment pH (1:5) T-C (g kg-1) T-N (g kg-1) C/N ratio
U 6.9hij 13.5g 1.76abc 7.7j
U-PB5 7.1cde 21.2f 1.87abc 11.4h
U-PB10 7.2c 27.9abc 1.90ab 14.7ef
U-RB5 7.0fgh 22.3f 1.69abc 13.2fg
U-RB10 7.1cdefg 27.2bcd 1.59bc 17.2bc
U-SB5 7.4b 21.4f 1.69abc 12.7gh
U-SB10 7.7a 29.2abc 1.98a 14.8ef
A 6.5k 14.0g 1.80abc 7.8j
A-PB5 6.8ij 21.0f 1.55bc 13.5fg
A-PB10 6.9ghi 26.0cde 1.69abc 15.4de
A-RB5 6.7j 21.9f 1.62bc 13.5fg
A-RB10 6.7j 28.4abc 1.52c 18.8a
A-SB5 7.2cde 22.2f 1.61bc 13.9efg
A-SB10 7.5b 29.2abc 1.79abc 16.4cd
O 7.1defg 15.3g 1.58bc 9.8i
O-PB5 7.1cdefg 23.6ef 1.77abc 13.3fg
O-PB10 7.2cd 29.1abc 1.71abc 17.1bc
O-RB5 7.1cdef 24.5def 1.67abc 14.6ef
O-RB10 7.0efg 31.0a 1.69abc 18.4ab
O-SB5 7.5b 23.7ef 1.69abc 14.2efg
O-SB10 7.7a 30.6ab 1.84abc 16.7cd
Effect Probability > F§
N fertilizer type (A) <0.001<0.001 0.161 <0.001
Biochar type (B) <0.001 0.096 0.059 <0.001
Biocahr input amount (C) <0.001<0.001 0.211 <0.001
(A) × (B) 0.642 0.706 0.651 0.814
(B) × (C) <0.001 0.437 0.085 <0.01
(A) × (C) 0.297 0.971 0.942 0.946
(A) × (B) × (C) 0.527 0.785 0.781 0.218

Values are the means with standard errors in parentheses (n=3), and those followed by a different letter are significantly different at α=0.05 between treatments.

Details of the treatment is provided in Table 3.

ANOVA was performed for all the treatments.

§The bold indicates that the effects are significant at α=0.05.

CO2 배출

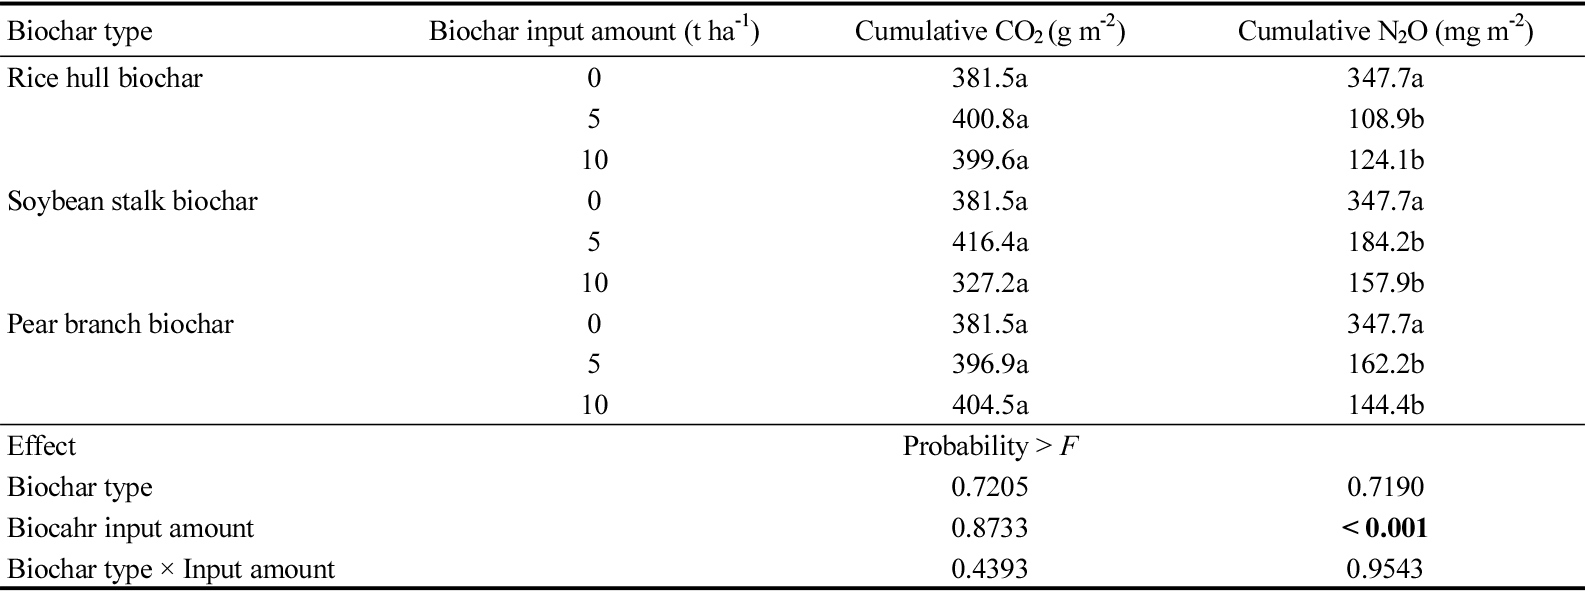
CO2 배출량은 항온배양 초기에 모든 처리구에서 높았으며, 질소비료와 바이오차를 투입하여 항온배양을 한 직후 가장 높게 배출되었다 (Fig. 2). 항온배양 2일째 CO2 배출량은 투입한 바이오차 종류별 구분하여 평가하였을 때, 전정가지 바이오차를 투입한 처리구에서는 O-PB5 처리구에서 76.4 g CO2 m-2 day-1로 가장 높았고, 왕겨 바이오차를 투입한 처리구에서는 O-RB10 처리구에서 84.0 g CO2 m-2 day-1로 가장 높았으며, 콩대 바이오차를 투입한 처리구에서는 O-SB5 처리구에서 77.1 g CO2 m-2 day-1로 가장 높았다. 전체적으로 유박을 질소비료원으로 투입한 처리구에서 배출량이 많았다. 모든 처리구에서 항온기간동안 CO2 배출형태는 초기에 급격히 배출된 이후 서서히 감소하였고 29일 이후부터 모든 처리구에서 2.64 g CO2 m-2 day-1 이하로 기저 발생 흐름을 나타냈다 (Fig. 2). 57일째 누적 CO2 배출량은 바이오차를 투입하지 않은 U, A, O 처리구에서 각각 119.4, 107.1, 381.5 g CO2 m-2 이였고, 바이오차를 5 tonnes ha-1를 투입한 요소, 유안, 유박 투입 처리구에서는 각각 138.3 - 146.3, 114.4 - 138.6, 396.9 - 416.4 g CO2 m-2 이였다. 바이오차 10 tonnes ha-1를 투입한 요소, 유안, 유박 투입 처리구에서는 각각 137.1 - 154.8, 120.8 - 161.5, 327.2 - 404.5 g CO2 m-2 이였다. CO2 배출량 바이오차 종류와 투입량에 크게 영향을 받지 않았이며, 유박을 질소비료원으로 투입한 처리구에서 높았다 (Table 6, 7, 8).
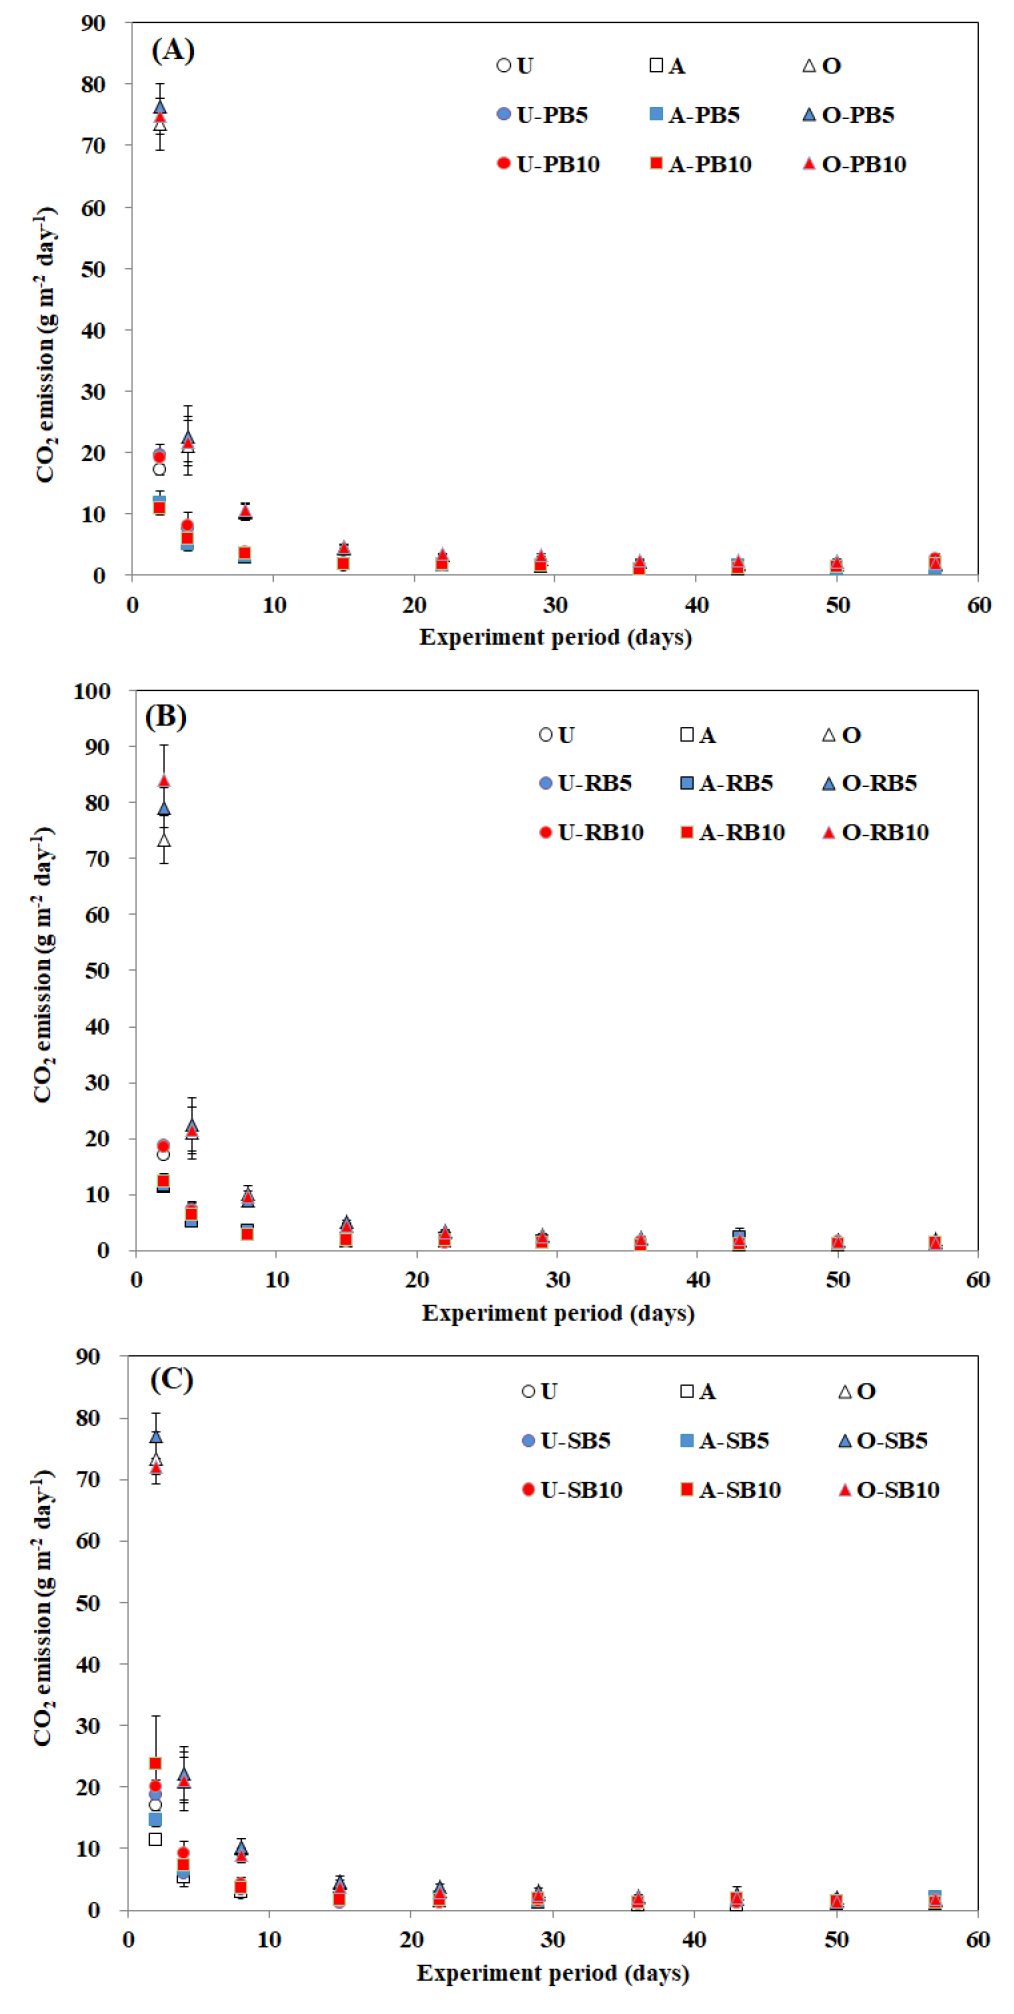
https://static.apub.kr/journalsite/sites/ksssf/2020-053-04/N0230530404/images/ksssf_53_04_04_F2.jpg
Fig. 2

Daily CO2 emission by different biochar (A: pear branch biochar, B: rice hull biochar, C: soybean stalk biochar) application under closed chamber condition during the 57-days. Values are the means of triplicate and vertical bars are standard errors of the means (n=3). Error bars are often too small to be depicted. Detailed treatments are provided in Table 3.

Table 6.

Cumulative total CO2 and N2O emissions from different biochar-amended soil with application of urea in the closed chamber.

Biochar types Biocahr input amount
(t ha-1)
Cumulative CO2
(g m-2)
Cumulative N2O
(mg m-2)
Rice hull biochar 0 119.4a 216.6a
5 138.3a 193.1ab
10 137.1a 123.7b
Soybean stalk biocar 0 119.4a 216.6a
5 146.0a 169.6ab
10 144.5a 153.4ab
Pear branch biochar 0 119.4a 216.6a
5 146.3a 208.3a
10 154.8a 169.4ab
Effect Probability > F
Biochar type 0.7067 0.5159
Biocahr input amount <0.05<0.01
Biochar type × Input amount 0.7805 0.6195

Values are the means with standard errors in parentheses (n=3), and those followed by a different letter are significantly different at α=0.05 between treatments.

ANOVA was performed for all the treatments.

The bold indicates that the effects are significant at α=0.05.

Table 7.

Cumulative total CO2 and N2O emissions from different biochar-amended soil with application of ammonium sulfate in the closed chamber. Nitrogen source : Ammonium sulfate

Biochar types Biocahr input amount
(t ha-1)
Cumulative CO2
(g m-2)
Cumulative N2O
(mg m-2)
Rice hull biochar 0 107.1b 44.2b
5 125.6ab 44.0b
10 120.8b 39.1b
Soybean stalk biocar 0 107.1b 44.2b
5 138.6ab 88.6a
10 161.5a 114.9a
Pear branch biochar 0 107.1b 44.2b
5 114.4b 45.0b
10 124.2ab 42.3b
Effect Probability > F
Biochar type 0.0824 <0.05
Biocahr input amount <0.01<0.001
Biochar type × Input amount 0.1713 <0.001

Values are the means with standard errors in parentheses (n=3), and those followed by a different letter are significantly different at α=0.05 between treatments.

ANOVA was performed for all the treatments.

The bold indicates that the effects are significant at α=0.05.

Table 8.

Cumulative total CO2 and N2O emissions from different biochar-amended soil with application of oil cake in the closed chamber. Nitrogen source : Oil cake

Biochar types Biocahr input amount
(t ha-1)
Cumulative CO2
(g m-2)
Cumulative N2O
(mg m-2)
Rice hull biochar 0 381.5a 347.7a
5 400.8a 108.9b
10 399.6a 124.1b
Soybean stalk biocar 0 381.5a 347.7a
5 416.4a 184.2b
10 327.2a 157.9b
Pear branch biochar 0 381.5a 347.7a
5 396.9a 162.2b
10 404.5a 144.4b
Effect Probability > F
Biochar type 0.7205 0.7190
Biocahr input amount 0.8733 볼<0.001
Biochar type × Input amount 0.4393 0.9543

Values are the means with standard errors in parentheses (n=3), and those followed by a different letter are significantly different at α=0.05 between treatments.

ANOVA was performed for all the treatments.

The bold indicates that the effects are significant at α=0.05.

N2O 배출

N2O 배출량은 항온배양 2일째 유박을 투입한 O 처리구에서 31.8 mg N2O m-2 day-1로 급격히 배출되었으며, 항온배양 8일째 요소 투입한 U 처리구에서 21.9 mg N2O m-2 day-1으로 높게 배출되었다. 그 후 전체적으로 N2O 배출량은 점차 줄어들었으며, 항온배양 29일 이후부터는 모든 처리구에서 1.20 mg N2O m-2 day-1 이하로 N2O는 거의 발생하지 않았다 (Fig. 3). 57일째 누적 N2O 배출량은 바이오차를 투입하지 않은 U, A, O 처리구에서 각각 216.6, 44.2, 347.7 mg N2O m-2 이였고, 바이오차 5 t ha-1를 투입한 요소, 유안, 유박 투입 처리구에서는 각각 169.6 - 208.3, 44.0 - 88.6, 108.9 - 184.2 mg N2O m-2 이였다. 바이오차 10 t ha-1를 투입한 요소, 유안, 유박 투입 처리구에서는 각각 123.7 - 169.4, 39.1 - 114.9, 124.1 - 157.9 mg N2O m-2 이였다. N2O 배출량은 질소비료원의 종류에 따라 크게 차이가 발생했으며, 요소와 유박을 투입한 처리구에서 바이오차의 투입량이 증가할수록 N2O 감축효과가 높았다 (Table 6, 7, 8).
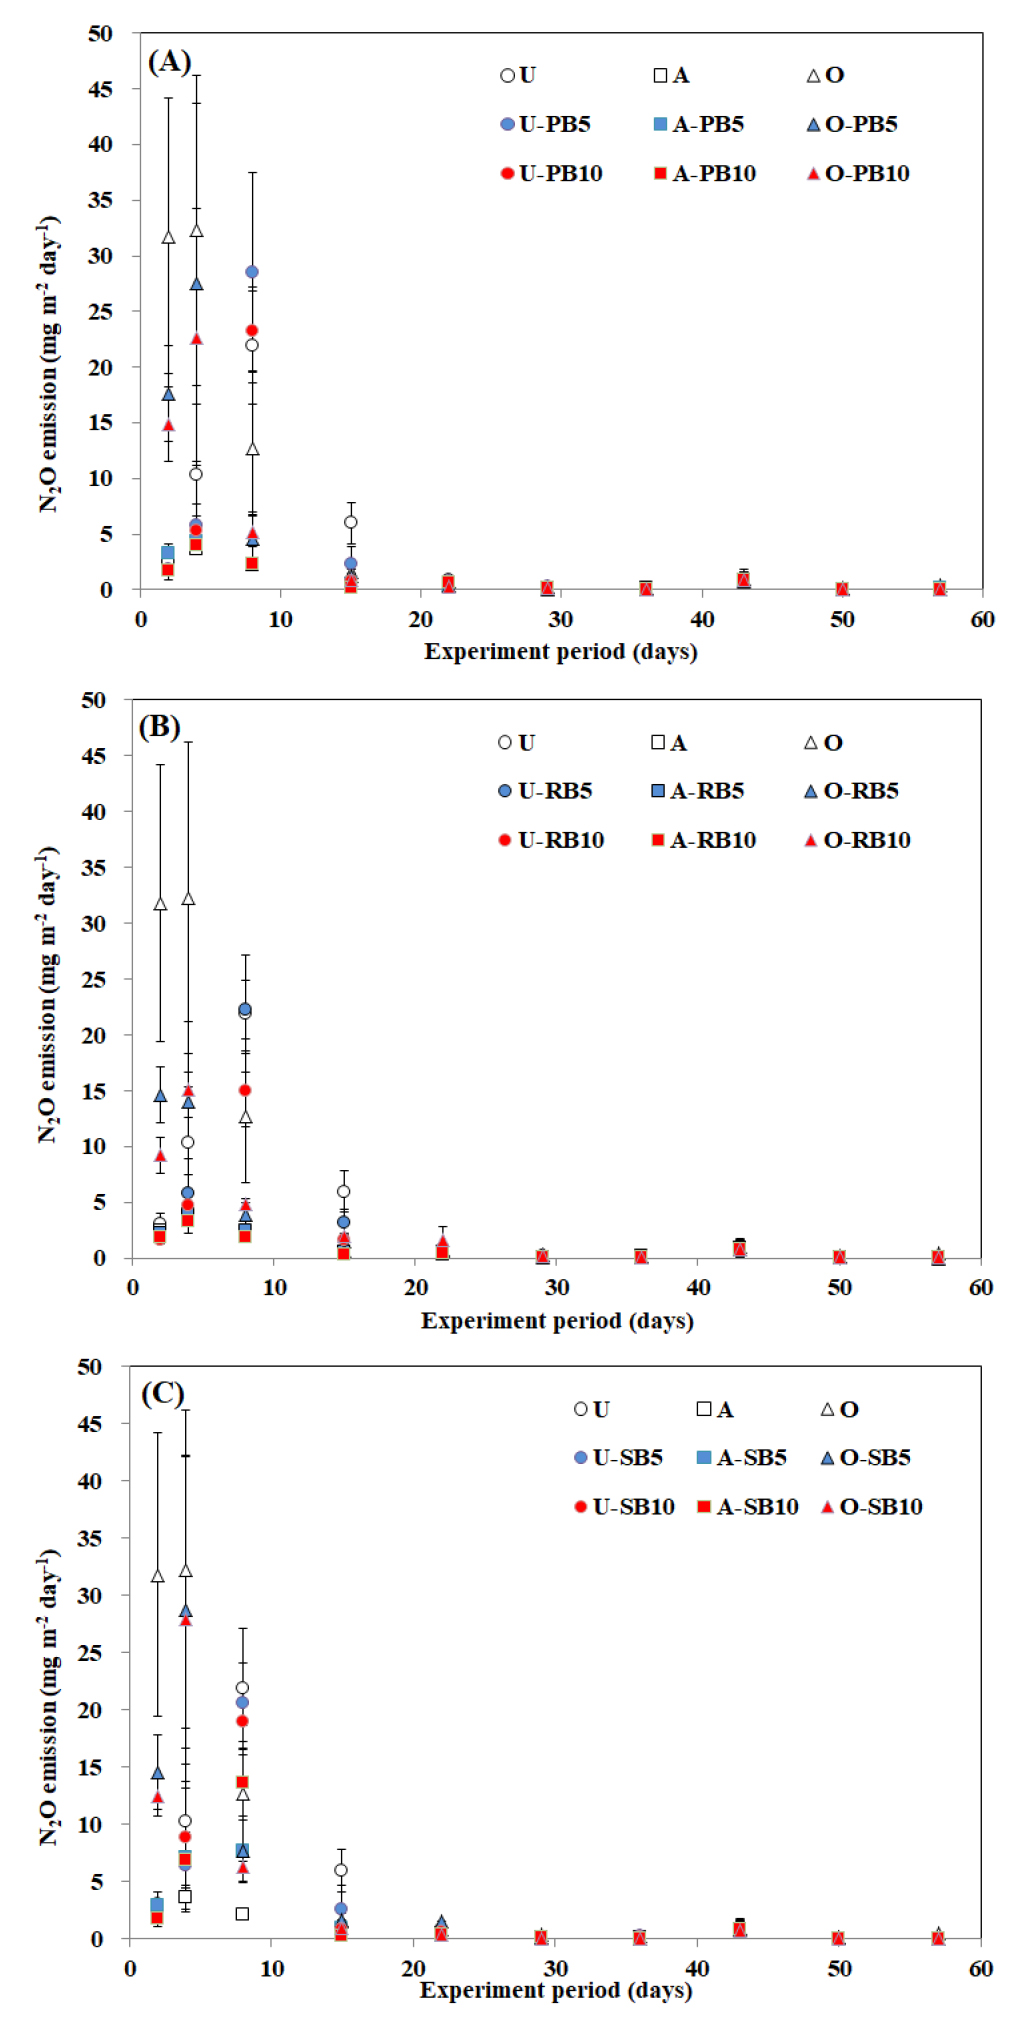
https://static.apub.kr/journalsite/sites/ksssf/2020-053-04/N0230530404/images/ksssf_53_04_04_F3.jpg
Fig. 3

Daily N2O emission by different biochar (A: pear branch biochar, B: rice hull biochar, C: soybean stalk biochar) application under closed chamber condition during the 57-days. Values are the means of triplicate and vertical bars are standard errors of the means (n=3). Error bars are often too small to be depicted. Detailed treatments are provided in Table 3.

Discussion

탄소 저장

분해에 대한 저항성이 있는 바이오차를 토양에 투입하면 토양 탄소함량이 증가하여, 토양의 물리, 화학, 생물학적 성질 회복을 유도할 수 있다고 평가되고 있다 (Liu et al., 2016; El-Naggar et al., 2018). 본 연구에서도 투입되는 질소 비료원과 바이오차 종류와 상관없이 모든 처리구에서 바이오차 투입량에 비례하여 토양 탄소 함량은 매우 유의한 차이를 (p < 0.001) 나타내며 증가하였다 (Table 5). 토양에서 발생하는 CO2는 토양 탄소함량이 높을수록 source가 증가하여 CO2발생량이 증가할 것으로 예상되지만, 본연구의 누적 CO2 배출량은 투입된 질소원과 바이오차 종류에 따라 다른 결과가 나타났다. 투입한 질소원이 요소일 경우, 누적 CO2 배출량은 119.4 - 154.8 g m-2 범위로 배출되었고, 상관관계 분석결과 바이오차의 투입량에 유의한 차이를 (p < 0.05) 나타났지만, 모든 처리구에서 분산분석한 결과 통계적 유의한 차이는 발생하지 않았다 (Table 6). 유안을 투입한 처리구에서는 누적 CO2 배출량은 107.1 - 161.5 g m-2 범위로 배출되었고, 바이오차의 투입량에 유의한 차이를 (p < 0.01) 나타내며, 증가하였다 (Table 7). 유박을 투입한 처리구에서는 누적 CO2 배출량은 381.5 - 416.4 g m-2 범위로 질소원으로 요소, 유박을 투입한 처리구보다 높게 배출되었고, 바이오차 종류와 투입량에 따른 유의한 차이는 나타나지 않았다 (Table 8). 유기질 질소비료원인 유박을 투입하였을 때 무기질 질소 비료원을 투입한 처리구에 비해 2배 이상 CO2가 배출되었는데, 이러한 연구결과는 상이한 질소 비료원을 투입하고 CO2 배출량을 비교평가 하였던 Sistani et al. (2011)에서도 유기질 질소 비료원 공급 시 유효탄소함량 증가하여 CO2 배출량이 상대적으로 크게 증가함을 확인 할 수 있었다.

바이오차 투입에 의해 모든 처리구에서는 탄소함량은 증가하였지만 (Table 5), 증가된 토양탄소함량이 CO2 배출에 직접적인 영향은 주지 않은 경향을 나타냈다. 즉 바이오차는 생물학적 분해의 영향을 받지 않는 난분해성 물질이기 때문에 (Nichols et al., 2000; Ascough et al., 2010; Liu et al., 2016), 탄소함량은 증가하였지만 분해되지 않아 직접적인 CO2 배출에 영향을 주지 않았다고 생각한다. 또한, 바이오차의 H:C 비율은 분자의 방향적 사슬구조를 파악할 수 있는 척도로 사용할 수 있으며, 국제 바이오차협회 (IBI, International Biochar Initiative)에서는 H:C 비율이 0.7이하일 경우에만 100년 이상 분해되지 않고 저장할 수 있다고 하며 (IBI, 2013), 본 연구에 사용한 바이오차의 H:C 비율은 0.37 - 0.63임으로 (Table 1) 매우 안정적인 바이오차내의 탄소는 분해과정을 통한 CO2 배출에 영향을 주지 않았음을 확인할 수 있다. 이러한 농경지 바이오차 투입에 의한 토양 탄소저장효과에 대해 국제사회는 2019 IPCC 개정판을 통해 “Method for estimating the change in mineral soil organic carbon stocks from biocahr amendments: Basis for future methodological development”를 제시하였다 (IPCC refinement, 2019). 바이오차의 탄소저장 효과와 인정 방법론 개발을 위한 기초정보를 제공하고 있기 때문에, 향후 온실가스 감축사업과 연계할 수 있도록 하는 준비가 필요할 것이다.

아산화질소 감축

바이오차에 의한 N2O 발생 저감은 바이오차 종류와 실험 환경에 따라서도 달라지는데, Cayuela et al. (2014)이 바이오차를 활용하여 N2O 배출량을 평가한 연구 261건에 대해 메타 분석한 결과, 바이오차 투입에 의해 토양 N2O 배출이 평균 54% 감소한 것으로 나타났다. 감축 원인은 바이오차의 C/N 비율이 다양하지만 대체로 C/N 비율이 높아 토양에 투입되었을 때 질소 부동화를 유발하여 토양에서 배출되는 N2O를 억제하는 것으로 평가된다 (Cayuela et al., 2013). 이외에도 바이오차는 무기태 질소 흡착 (van Zwieten et al., 2010), 질소 부동화 (Lehmann et al., 2006), 완전탈질 (Uchida et al., 2019) 등 다양한 기작의 복합적으로 작용하여 N2O 배출을 저감하는 것으로 평가되고 있다. 본 연구에서도 투입되는 질소 비료원과 바이오차 종류와 상관없이 모든 처리구에서 바이오차 투입량에 비례하여 토양 C/N 비율은 매우 유의한 차이를 (p < 0.001) 나타내며 증가하였고 (Table 5), N2O 배출량은 토양 C/N 비율과 비례하여 유안 투입 처리구 (p < 0.01)와 유박 투입 처리구 (p < 0.05)에서 유의하게 감소하였다. 투입한 질소원이 요소일 경우 바이오차 투입에 따라, 누적 N2O 배출량은 3.8 - 42.9% 범위로 저감되었고, 바이오차의 투입량에 비례하여 유의한 차이를 (p < 0.01) 나타내며 저감되었다 (Table 6). 유안을 투입한 처리구에 왕겨 바이오차와 전정가지 바이오차를 투입하였을 때 누적 N2O 배출량은 처리구간 통계적 유의한 차이가 발생하지 않았고, 콩대 바이오차를 투입하였을 때 누적 N2O 배출량이 두배 이상 증가하였다 (Table 7). 유박을 투입한 처리구에 바이오차 투입에 따라 누적 N2O 배출량은 47.0 - 68.7% 범위로 저감되었고, 바이오차의 투입량에 비례하여 매우 유의 (p < 0.001) 하게 저감되었다 (Table 8).

바이오차를 투입하지 않은 U, A, O 처리구의 누적 N2O 배출량은 각각 216.6, 44.2, 347.7 mg N2O m-2 이였다. 즉 유기질 질소원 공급에 따라 미생물 활성이 증진되어 이에따라 CO2 뿐만 아니라 N2O 배출량도 무기질 질소원 공급에 비해 크게 증가하였는데 (Hayakawa et al., 2009; Chantigny et al., 2010), 바이오차 투입에 따른 N2O 배출량 저감효과는 상대적으로 배출량이 많았던 유박 투입처리구에서 효과가 컸다. 반대로 유안을 공급한 처리구에서는 바이오차 투입에 따른 N2O 저감효과가 나타나지 않았는데, 이는 요소나 유박을 투입하였을 때보다 N2O 배출량이 12.7 - 20.4% 수준으로 낮아 저감기술 적용에 따른 효과가 발생하지 않았다. 또한 콩대 바이오차를 투입하였을 때 배출량이 증가하였는데, 이는 SB의 질소 함량과 비표면적이 RB, PB 보다 높아 가용성 질소함량의 증가로 상대적으로 N2O 배출이 증가하는 것으로 추정된다. 바이오차를 투입함에 따라 T-C 함량이 증가하였고, 그에 따라 토양의 C/N 율이 증가하여 (Table 5), 질소의 부동화에 의해 N2O 배출이 영향을 받았다고 판단되지만 (Cayuela et al., 2014; Oo et al., 2018), 상대적으로 N2O 배출이 낮은 유안을 투입한 처리구에서는 같은 효과가 나타나지 않았다. 본 연구는 국내에서 많이 이용하는 질소원을 선택하여 각 질소원별 바이오차 투입에 따른 N2O 배출량 변화에 대해 중점을 두고 분석하여 이에 대한 기작을 분석하고 해석하는데에 한계가 있었다. 따라서 향후 필요한 연구로써 각 질소원별 바이오차 투입에 의해 N2O 배출과 그에 영향을 미치는 요소에 대해 질소 동위원소비 분석 기법 등을 활용하여 질소순환 과정을 추적하여 해석하는 연구가 요구된다. 그리고 N2O로 대기 중으로 배출되는 질소원을 줄여 토양내 질소 이용 효율을 증대할 수 있어 작물 생산에 긍정적인 영향을 줄 수 있는지를 평가하는 연구도 앞으로 필요할 것으로 판단되어, 실내 연구결과와 더불어 작물을 재배하는 현장에 바이오차를 적용하여 종합적으로 평가하는 연구가 필요할 것으로 사료된다.

Conclusions

본 연구는 농가에서 버려지는 부산물을 지목별로 선정하여 왕겨, 콩대, 배전정가지 바이오매스를 바이오차로 변환한 후 토양에 적용하여 토양의 화학적 특성 변화와 온실가스 발생량을 비교하였다. 특히 농경지에서 배출되는 N2O는 투입되는 질소질 비료의 종류에 따라 배출양상이 상이함으로 질소 비료로써 요소, 유안, 유박을 각각 분류하여 공급하고 바이오차를 투입하였을 때 효과를 평가하였다. 토양 탄소함량은 질소 비료원과 바이오차 종류와 상관없이 모든 처리구에서 바이오차 투입량에 비례하여 매우 유의한 차이를 (p < 0.001) 나타내며 증가하였다. 그리고 증가된 토양탄소함량이 CO2 배출에 직접적인 영향은 주지 않은 경향을 나타냈다. 누적 N2O 배출량은 바이오차를 투입하지 않은 요소, 유안, 유박을 투입한 처리구에서 각각 216.6, 44.2, 347.7 mg N2O m-2 이였고, 유박을 투입한 처리구에서 바이오차 투입함에 따라 N2O 배출량은 47.0 - 68.7% 범위로 저감되어, N2O 감축효과는 상대적으로 배출량이 높았던 유박 투입 처리구에서 효과가 컸다. 따라서 농경지 토양에서 온실가스 배출 저감을 위한 바이오차 적용은 공급된 질소비료 종류에 따라 구분하여야 할 필요가 있다. 그리고 N2O로 대기 중으로 배출되는 질소원을 줄여 토양내 질소 이용 효율을 증대할 수 있어 작물 생산에 긍정적인 영향을 줄 수 있는지를 평가하는 연구도 앞으로 필요할 것으로 판단된다.

Acknowledgements

This work was carried out by the support of Cooperative Research Program for Agriculture Science & Technology Development (PJ012614032020), Rural Development Administration, Republic of Korea.

References

1
Amonette, J.E. and S. Joseph. 2012. Characteristics of biochar: microchemical properties. In Biochar for environmental management. 65-84.
2
Ascough, P.L., C.J. Sturrock, and M.I. Bird. 2010. Investigation of growth responses in saprophytic fungi to charred biomass. Isotopes in Environmental and Health Studies. 46:64-77. 10.1080/1025601090338843620229385
3
Baggs, E.M. 2011. Soil microbial sources of nitrous oxide: recent advances in knowledge, emerging challenges and future direction. Current Opinion in Environmental Sustainability. 3:321-327. 10.1016/j.cosust.2011.08.011
4
Cayuela, M.L., M.A. Sanchez-Monedero, A. Roig, K. Hanley, A. Enders, and J. Lehmann. 2013. Biochar and denitrification in soils: when, how much and why does biochar reduce N2O emissions?. Scientific Reports. 3:1732. 10.1038/srep0173223615819PMC3635057
5
Cayuela, M.L., L. van Zwieten, B.P. Singh, S. Jeffery, A. Roig, and M.A. Sánchez-Monedero. 2014. Biochar's role in mitigating soil nitrous oxide emissions: A review and meta-analysis. Agriculture. Ecosystems & Environment. 191:5-16. 10.1016/j.agee.2013.10.009
6
Chantigny, M.H., P. Rochette, D.A. Angers, S. Bittman, K. Buckley, D. Masse, and M.O. Gasser. 2010. Soil nitrous oxide emissions following band-incorporation of fertilizer nitrogen and swine manure. Journal of Environmental Quality. 39(5):1545-1553. 10.2134/jeq2009.048221043260
7
Clough, T., J. Bertram, J. Ray, L. Condron, M. O'callaghan, R. Sherlock, and N. Wells. 2010. Unweathered wood biochar impact on nitrous oxide emissions from a bovine-urine-amended pasture soil. Soil Science Society of America Journal. 74:852. 10.2136/sssaj2009.0185
8
Clough, T., L. Condron, C. Kammann, and C. Muller. 2013. A review of biochar and soil nitrogen dynamics. Agronomy. 3:275-293. 10.3390/agronomy3020275
9
El-Naggar, A., Y.M. Awad, X.Y. Tang, C. Liu, N.K. Niazi, S.H. Jien, and S.S. Lee. 2018. Biochar influences soil carbon pools and facilitates interactions with soil: A field investigation. Land degradation & development. 29:2162-2171. 10.1002/ldr.2896
10
El-Naggar, A., A.R. Usman, A. Al-Omran, Y.S. Ok, M. Ahmad, and M.I. Al-Wabel. 2015. Carbon mineralization and nutrient availability in calcareous sandy soils amended with woody waste biochar. Chemosphere. 138:67-73. 10.1016/j.chemosphere.2015.05.05226037818
11
Gaskin, J.W., C. Steiner, K. Harris, K.C. Das, and B. Bibens. 2008. Effect of low-temperature pyrolysis conditions on biochar for agricultural use. Transactions of the ASABE. 51:2061-2069. 10.13031/2013.25409
12
Gee, G.W. and J.W. Bauder. 1986. Particle size analysis. Physical and mineralogical methods. American Society of Agronomy and Soil Science Society of America. 383-412. 10.2136/sssabookser5.1.2ed.c15
13
Hale, S.E., J. Lehmann, and D. Rutherford. 2012. Quantifying the total and bioavailable polycyclic aromatic hydrocarbons and dioxins in biochars. Environmental Science & Technology. 46:2830-2838. 10.1021/es203984k22321025
14
Hayakawa, A., H. Akiyama, S. Sudo, and K. Yagi. 2009. N2O and NO emissions from an Andisol field as influenced by pelleted poultry manure. Soil Biology and Biochemistry. 41(3):521-529. 10.1016/j.soilbio.2008.12.011
15
IBI. 2013. Standard test method for estimating biochar carbon stability.
16
IPCC refinement 2019. STOCK, ANNUAL CHANGE IN BIOCHAR CARBON. Appendix 4 Method for estimating the change in mineral soil organic carbon stocks from biochar amendments: Basis for future methodological development.
17
IPCC. 2007. Climate change. In: Solomon S (ed) The scientific basis. Contribution of working group I to the fourth assessment report of the intergovernmental panel on climate change. Cambridge university press, NY. USA.
18
Kang, S.W., S.H. Kim, J.H. Park, D.C. Seo, Y.S. Ok, and J.S. Cho. 2018. Effect of biochar derived from barley straw on soil physicochemical properties, crop growth, and nitrous oxide emission in an upland field in South Korea. Environmental Science and Pollution Research. 25:25813-25821. 10.1007/s11356-018-1888-329654461
19
KREI. 2016. Current status of climate-smart agriculture and policy directions. Korean Rural Economic institute.
20
Lee, S.I., G.Y. Kim E.J. Choi, J.S. Lee, and H.C. Jung. 2017. Decreases nitrous oxide emission and increase soil carbon via carbonized biomass application of orchard soil. Korean Journal of Environmental Agriculture. 36:73-79. 10.5338/KJEA.2017.36.2.13
21
Lehmann, J. 2007. A handful of carbon. Nature. 447:143-144. 10.1038/447143a17495905
22
Lehmann, J. and S. Joseph. 2009. Biochar for environmental management: an introduction. In: Lehmann J, Joseph S (eds) Biochar for environmental management: science and technology. Earthscan, London. 1-12.
23
Lehmann, J., J. Gaunt, and M. Rondon. 2006. Bio-char sequestration in terrestrial ecosystems: a review. Mitigation and Adaptation Strategies for Global Change. 11:403-427. 10.1007/s11027-005-9006-5
24
Li, B., Z. Bi, and Z. Xiong. 2017. Dynamic responses of nitrous oxide emission and nitrogen use efficiency to nitrogen and biochar amendment in an intensified vegetable field in southeastern China. Gcb Bioenergy. 9:400-413. 10.1111/gcbb.12356
25
Liu, X., J. Zheng, D. Zhang, K. Cheng, H. Zhou, A. Zhang, and Y. Kuzyakov. 2016. Biochar has no effect on soil respiration across Chinese agricultural soils. Science of the Total Environment. 554:259-265. 10.1016/j.scitotenv.2016.02.17926950640
26
NIAS. 2000. Methods of soil and plant analysis:, National Institute of Agricultural Sciences, RDA.
27
Nichols, G.J., J.A. Cripps, M.E. Collinson, and A.D. Scott. 2000. Experiments in waterlogging and sedimentology of charcoal: Results and implications. Paleogeography, Paleoclimatology, Paleoecology. 164:43-56. 10.1016/S0031-0182(00)00174-7
28
Oo, A.Z., S. Sudo, H. Akiyama, K.T. Win, A. Shibata, A. Yamamoto, and Y. Hirono. 2018. Effect of dolomite and biochar addition on N2O and CO2 emissions from acidic tea field soil. PloS one 13:2. 10.1371/journal.pone.019223529394272PMC5796709
29
Park, J.H., Y.S. Ok, S.H. Kim, S.W. Kang, J.S. Cho, J.S. Heo, and D.C. Seo. 2015. Characteristics of biochars derived from fruit tree pruning wastes and their effects on lead adsorption. Journal of the Korean Society for Applied Biological Chemistry. 58:751-760. 10.1007/s13765-015-0103-1
30
Park, W.K., N.B. Park, J.D. Shin, S.G. Hong, and S.I. Kwon. 2011. Estimation of biomass resource conversion factor and potential production in agricultural sector. Korean Journal of Environmental Agriculture. 30:252-260. 10.5338/KJEA.2011.30.3.252
31
Rajapaksha, A.U., M. Ahmad, M. Vithanage, K.R. Kim, J.Y. Chang, S.S. Lee, and Y.S. Ok. 2015. The role of biochar, natural iron oxides, and nanomaterials as soil amendments for immobilizing metals in shooting range soil. Environmental geochemistry and health. 37:931-942. 10.1007/s10653-015-9694-z25794596
32
Sanchez-Garcia, M., A. Roig, M.A. Sanchez-Monedero, and M.L. Cayuela. 2014. Biochar increases soil N2O emissions produced by nitrification-mediated pathways. Frontiers in Environmental Science. 2:25. 10.3389/fenvs.2014.00025
33
Singh, B.P., B.J. Hatton, S. Balwant, A.L. Cowie, and A. Kathuria. 2010. Influence of biochars on nitrous oxide emission and nitrogen leaching from two contrasting soils. Journal of Environmental Quality. 39:1224-1235. 10.2134/jeq2009.013820830910
34
Sistani, K.R., M. Jn-Baptiste, N. Lovanh, and K.L. Cook, 2011. Atmospheric emissions of nitrous oxide, methane, and carbon dioxide from different nitrogen fertilizers. Journal of Environmental Quality. 40:1797-1805. 10.2134/jeq2011.019722031562
35
Spokas, K.A., 2010. Review of the stability of biochar in soils: predictability of O: C molar ratios. Carbon Management. 1:289-303. 10.4155/cmt.10.32
36
Taghizadeh-Toosi, A., T.J. Clough, L.M. Condron, R.R. Sherlock, C.R. Anderson, and R.A. Craigie. 2011. Biochar incorporation into pasture soil suppresses in situ nitrous oxide emissions from ruminant urine patches. Journal of Environmental Quality. 40:468-476. 10.2134/jeq2010.041921520754
37
Uchida, Y., M. Moriizumi, and M. Shimotsuma. 2019. Effects of rice husk biochar and soil moisture on the accumulation of organic and inorganic nitrogen and nitrous oxide emissions during the decomposition of hairy vetch (Vicia villosa) mulch. Soil Science and Plant Nutrition. 65:409-418. 10.1080/00380768.2019.1624139
38
van Zwieten, L., S. Kimber, A. Downie, S. Morris, S. Petty, J. Rust, and K.Y. Chan. 2010. A glasshouse study on the interaction of low mineral ash biochar with nitrogen in a sandy soil. Soil Research. 48:569-576. 10.1071/SR10003
39
Wacal, C., N. Ogata, D. Basalirwa, T. Handa, D. Sasagawa, R. Acidri, and E. Nishihara. 2019. Growth, seed yield, mineral nutrients and soil properties of sesame (Sesamum indicum L.) as influenced by biochar addition on upland field converted from paddy. Agronomy. 9:55. 10.3390/agronomy9020055
40
WMO. 2018. The state of greenhouse gases in the atmosphere based on global observations through 2017. Greenhouse Gas Bulletin.
41
Xu, Y., B. Seshadri, B. Sarkar, C. Rumpel, D.S. Sparks, and N. Bolan. 2018. Chapter 6 - microbial control of soil carbon turnover A2 - Garcia, carlos. In: Nannipieri, P., Hernandez, T. (Eds.), The Future of Soil Carbon. Academic Press, p.165-194. 10.1016/B978-0-12-811687-6.00006-7
42
Zeng, W., C. Xu, J. Wu, J. Huang, and T. Ma. 2013. Effect of salinity on soil respiration and nitrogen dynamics. Ecological Chemistry and Engineering. 20:519-530. 10.2478/eces-2013-0039
43
Zhang, X., S. Kondragunta, C. Schmidt, and F. Kogan. 2008. Near real time monitoring of biomass burning particulate emissions (PM 2.5) across contiguous United States using multiple satellite instruments. Atmospheric Environment. 42:6959-6972.
페이지 상단으로 이동하기