Introduction
Materials and Methods
Plant material and growth condition
Fertilization treatment
Sampling and total N analysis
Soluble carbohydrate analysis
RNA extraction and quantitative real-time PCR (qRT-PCR)
Statistical analysis
Results and Discussion
Growth and N uptake
Soluble carbohydrates
Nitrogen metabolism
Conclusions
Introduction
According to the world soil map, more than 900 million ha of global soils is faced to salt-alkaline conditions, accounting for 20% of global cultivated land (Li et al., 2020). Saline-alkali stress is one of the big concerns to adversely affect the growth and development of crop plants which are caused by not only osmotic stress and/or disrupted ion homeostasis, especially excessive Na+ accumulation, but also high pH-created ion precipitation and limited nutrient availability (Abdullah et al., 2001; Nemati et al., 2011). Nitrogen (N) availability in alkali soil was strongly influenced by the nature of fertilizers, degree of salinity, soil texture and soil organic matter (Cheng et al., 2019; Singh et al., 2016). Additionally, alkali stress plays as a limiting factor inhibiting the absorption of inorganic anions such as NO3- and H2PO4-, strongly affects the selectivity of K+ - Na+, and breaks ion balance in plant tissues (Yang et al., 2007; Yang et al., 2008).
Plant survival, growth and development, in saline environments is a result of adaptive processes homeostatic regulation of ions and compatible solutes. N is a crucial and the greatest quantity mineral nutrient required for plant growth and development, and thus play as a key determinant producing compatible solutes such as amino acids, amides and betaines, which alleviate environmental impacts including alkali stress (Läuchli and Luttge, 2002). Saline-alkali stress markedly perturbs nitrogen metabolism in rice, especially older leaves (Wang et al., 2012), and leads to an abundance in amino acids as the compatible solutes to cope with unfavorable conditions (Xu et al., 2016). High pH environment in rhizosphere may restrict uptake and/or assimilation of nitrogen (Yang et al., 2009; Wang et al., 2012). Nitrate (NO3-) uptake is precisely mediated by an H+/NO3- symport mechanism, which depends on the transmembrane H+ gradient (Crawford and Glass, 1998), and thus is limited by the lack of external H+ caused by alkali stress (Wang et al., 2015). Genes responsible for nitrogen metabolisms, absorption by nitrate (NRT)/ammonium (AMT) transporters, reduction by nitrate (NR)/nitrite (NiR) reductases and assimilation into amino acids by glutamine synthetase (GS)/glutamine-2-oxoglutrate amino transferase (GOGAT), in rice are well documented (Huang et al., 2018), and much of these genes were significantly perturbed under alkali stress (Wang et al., 2015).
Rice (Oryza sativa) is one of the most important cereal corps worldwide. Despite relatively greater tolerance in high pH, soil alkalinity frequently limits rice productivity (Zeng et al., 2002; Lv et al., 2013; Li et al., 2018c). In the reclaimed area, soil alkalinity (high pH) is a damaging factor that limits rice productivity. In this study, we examined the expression of nitrogen metabolism-involved genes and soluble carbohydrates in the leaves and roots of rice (Oryza sativa L.) cultivar ‘Asemi, saline-alkali resistant’ in response to different levels of nitrogen fertilization under alkali soil condition. We aimed to investigate the differences in absorption, transport and assimilation of nitrogen and abundance in soluble carbohydrates.
Materials and Methods
Plant material and growth condition
This work was performed at the experimental greenhouse in National Institute of Crop Science (NICS), RDA in 2021. Seeds of rice (Oryza sativa cv. Asemi, saline-alkali resistant) were firstly sterilized in seed disinfectant (500 mg kg-1) (Kiman, Farm Hannong, Korea) for 2 days, and germinated in an incubator (28°C, darkness) for 5 days. In order to promote uniform seedling growth, the germinated seeds were transferred into a growth chamber (VS-91G09M-2600, Vision Scientific, Korea) setting up with a 12/12 h photoperiod, 60% (w/v) relative humidity (RH) and 24/20°C day/night temperature. Uniformly grown rice seedlings (third leaf stage) were transplanted into plastic pots (15 kg soil pot-1), and each treatment was completely randomly assigned with three replicates (3 plants pot-1). Experimental soils were selected with high pH (9.2 ± 0.18, Table 1) to develop alkali condition. Chemical properties of soil were analyzed with NAAS method (NAAS, 2010). Soil texture was analyzed with USDA method, and limited infiltration rate (LIR, mm day-1) was determined with hydraulic conductivity by a mini disk infiltrometer (METER, USA) (Reynolds and Elrick, 1991; Zhang, 1997). The pH and EC were measured with pH/EC meter (sampled soil : ddH2O = 1:5). Total soil carbon (dried soil) was measured with a C/N analyzer (Primacs SNC 100, SKALAR, Netherland), and transformed to organic matter with multiplying by 1.724. An available phosphate extracted with Lancaster method was measured with UV-Spectrometer (720 nm, UV 1900i, Shimadzu, Japan). The exchangeable cations of soil (5 g) were extracted with 25 mL of 1 N CH2COONH4 (pH 7.0) and analyzed with ICP-OES equipment (INTEGRA XMP, GBC, Australia).
Table 1.
Soil properties used in this study.
| Properties | Unit | Recommended2 | Measured |
| Soil texture | USDA | - | Loamy sand |
| Sand | % | - | 85.9 |
| Silt | % | - | 8.8 |
| Clay | % | - | 5.3 |
| LIR1 | mm day-1 | - | 32 |
| pH | 1:5 | 5.5 - 6.5 | 9.2 |
| EC | dS m-1, 1:5 | - | 0.86 |
| Organic matter | g kg-1 | 20 - 30 | 3 |
| Available P2O5 | mg kg-1 | 80 - 120 | 99 |
| Exchangeable K | cmolc kg-1 | 0.2 - 0.3 | 0.20 |
| Exchangeable Ca | 5.0 - 6.0 | 8.18 | |
| Exchangeable Mg | 1.5 - 2.0 | 0.68 | |
| Exchangeable Na | - | 0.58 |
Fertilization treatment
Standard fertilization was 75 kg N, 30 kg P2O5 and 100 kg K2O ha-1, which was suggested by NICS. Dose of N (Urea) was divided into 0 (0 N), 75 (75 N) and 150 kg ha-1 (150 N), and split with three times as a rate of 50 (basal), 30 (15 days after transplanting, DAT) and 20% (50 DAT). Total requirement of P2O5 (fused phosphate) and K2O (potassium sulfate) were applied as a basal fertilization. Water was irrigated with NICS guideline; flooding (transplanting to productive tillering) - midseason drainage (unproductive tillering) - flooding (panicle differentiation to ripening).
Sampling and total N analysis
The leaves of rice were taken at tillering and heading stages, immediately washed with deionized-distilled water, and dried at 72°C for 48 hrs. After measuring dry weight, total N concentration from powdered leaves (500 mg, dry weight) was measured with a C/N analyzer (Primacs SNC 100, SKALAR, Netherland) according to manufacturer’s introduction.
Soluble carbohydrate analysis
In order to determine carbohydrate contents, powdered leaves (0.2 g) were firstly alcohol-digested with 10 mL of 80% ethanol in boiling water. The alcoholic extracts were evaporated under boiling water bath, and the residues were re-dissolved with distilled water. Water extracts were mixed with 2 mL of 0.2% anthrone in a concentrated H2SO4 followed by estimation of carbohydrate as described by Roe (1955). Glucose was used as standard for both soluble sugars and starch.
RNA extraction and quantitative real-time PCR (qRT-PCR)
Total RNA was extracted from the leaves and roots of rice at heading stage, using TRIzol reagent (Invitrogen, Carlsbad, CA) according to the manufacturer’s instruction. The purity and concentration of the extracted RNA were estimated using NanoDrop (Thermo Fisher Scientific, Madison, WI, USA) and checked on a 1.2% agarose gel. Total RNA (1 µg) and the RT PreMix Kit with Oligo (dT) primers were used to synthesize first-strand cDNA using following PCR condition: 60 min at 45°C to cDNA synthesis and 5 min at 95°C to Rtase inactivation step.
Quantitative real-time PCR was performed by using a Real-Time PCR machine (CFX Opus 96, Bio-Rad, Hercules, CA, USA) with technical triplicates according to the manufacturer’s instructions. The reaction mixture consisted of 1 µL of cDNA template, 2 µL each of 10 mM forward and reverse primer (Table 2) and 5 µL SYBR Green Q Master mix (Labopass, Cosmo Genetech, Seoul, South Korea). The PCR conditions consisted of pre-denaturation step at 95°C for 5 min, followed by 50 cycles of denaturation 95°C for 10 s, annealing temperature of each primer for 30 s and elongation (72°C, 20 s). This step was followed by a melting curve, ranging from 65 to 95°C at a heating rate of 0.5°C/s. A quantification method (2–∆∆Ct) was used (Livak and Schmittgen, 2001) and the variation in expression was estimated using triplicate for each cDNA sample. The rice actin gene was used as a reference in the qRT-PCR. Primer sequences used for qRT-PCR were designed by Primer 3 software (Rozen and Skaletsky, 2000).
Table 2.
Sequence information of primer of selected genes for qRT-PCR.
Statistical analysis
Data were analyzed using one-way ANOVA, and, if p < 0.05, were subjected to Tukey’s HSD test to detect significant differences among the means (RStudio VER. 4.2.2).
Results and Discussion
Growth and N uptake
Soil pH was slightly reduced to 9.1 ± 0.11 (0 N), 8.8 ± 0.12 (75 N) and 8.8 ± 0.08 (150 N) after experiment compared to the initiation (9.2 ± 0.18). Plant height and tillering were not different among treatments at both time points, respectively (Table 3). Dry weight and nitrogen (N) uptake were significantly increased with increasing N fertigation, however there was not different between 75 N and 150 N. At tillering stage, dry weight (g plant-1) of above-ground in 0 N and 150 N showed 52 and 77% compared to 75 N, and N uptake (mg plant-1) was 37 and 87%, respectively. At heading stage, dry weight of above-ground in 0 N and 150 N showed 67 and 95% compared to 75 N, and N uptake was 62 and 90%, respectively. Even though increasing N application contributed to significant increase height and tillering of rice, reducing N was likely to be appropriate in terms of biomass production and yield of in alkali soils, which were evidently supported by previous studies (Meena et al., 2003; Singh et al., 2016). Furthermore, the degree of ammonia volatilization showed a positively consistent relationship with nitrogen application rates (Lin et al., 2012), and alkaline soil (pH 8.5) resulted in much more ammonia volatilization loss compared to slightly salt-affected soil (Li et al., 2017). Kang et al. (2023) suggested that blast furnace slag (BFS)-containing silicate fertilizer was effective to enhance agronomic traits and yield of rice. In present study, N uptake did not show significant difference between 75 N and 150 N at both time points. Li et al. (2017) reported that N recovery efficiency greatly depended on the degree of soil alkali rather than N application rates, and soil residual N remained low regardless of N application rates. Accordingly, increasing N fertigation in alkali soils is not likely to be a good practice as a countermeasure to enhance biomass and N uptake of rice.
Table 3.
Growth and nitrogen uptake of rice by different rates of N fertilization at tillering and heading stages.
| Stage |
NPK rate (kg ha-1) |
Plant height (cm) |
Tiller (No. plant-1) |
Dry weight (g plant-1, aboveground) |
Total N (%, aboveground) |
N uptake (mg plant-1) |
| Tillering | 75-30-1001 (75 N) | 60.0 ± 9.5 ns2 | 5.3 ± 0.6 ns | 1.42 ± 0.22 a | 0.80 ± 0.03 ns | 11.3 ± 1.5 a |
| 0-30-100 (0 N) | 54.0 ± 7.7 | 4.7 ± 0.6 | 0.54 ± 0.28 b | 0.77 ± 0.02 | 4.2 ± 2.2 b | |
| 150-30-100 (150 N) | 56.6 ± 4.3 | 4.7 ± 0.6 | 1.29 ± 0.26 a | 0.77 ± 0.02 | 9.8 ± 1.7 a | |
| F-value | 0.484 | 1.333 | 10.732(*) | 1.489 | 12.806(**) | |
| Heading | 75-30-100 (75 N) | 69.8 ± 3.2 ns | 7.3 ± 1.2 ns | 6.42 ± 0.50 a | 0.92 ± 0.01 a | 59.1 ± 5.0 a |
| 0-30-100 (0 N) | 61.2 ± 3.4 | 6.7 ± 0.6 | 4.27 ± 0.56 b | 0.85 ± 0.04 b | 36.5 ± 5.2 b | |
| 150-30-100 (75 N) | 64.8 ± 5.2 | 7.3 ± 0.6 | 6.12 ± 1.26 ab | 0.87 ± 0.02 ab | 53.4 ± 10.7 ab | |
| F-value | 3.428 | 0.667 | 5.633(*) | 5.962(*) | 7.535(*) | |
| Stage (T-test) | <0.001(***) | <0.001(***) | 0.0102(*) | <0.001(***) | <0.001(***) | |
Soluble carbohydrates
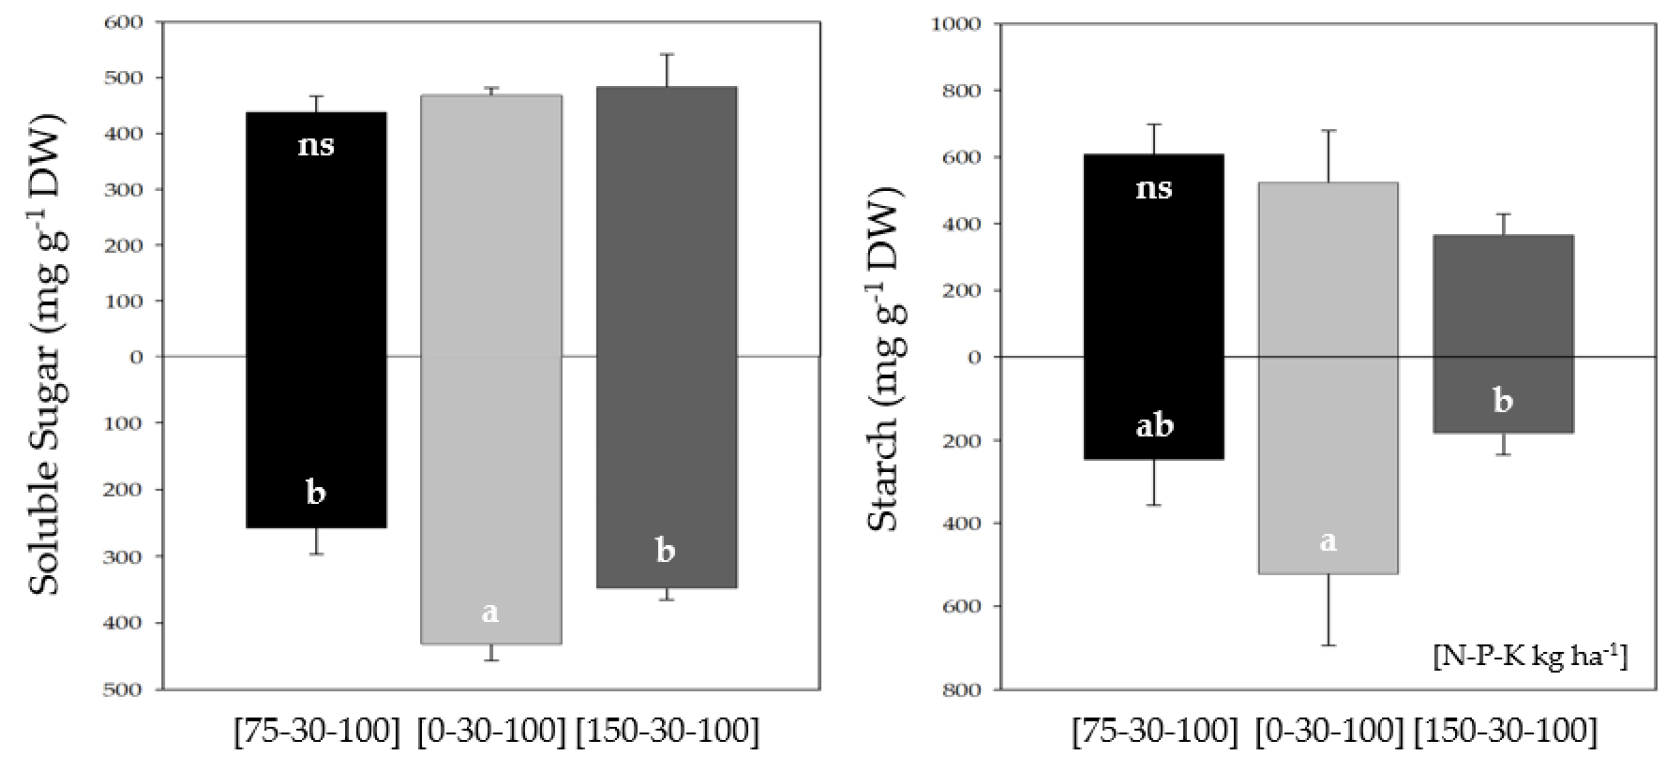
At heading stage, soluble sugar and starch were noticeably accumulated in the roots of 0 N compared to 75 N, however was not significant in 150 N (Fig. 1). In contrast, an abundance of both soluble carbohydrates was not significant in the leaves of all N treatments. Soluble sugar in the roots of 0 N and 150 N was 1.67 and 1.35 times greater compared to 75 N, and starch represented 2.10 and 0.75 times. Alkali stress results in huge accumulation of soluble sugar and sucrose, which play as an osmotic protectant (Yildiztugay et al., 2014; Guo et al., 2018). In this study, soluble sugar and starch were significantly concentrated in the roots of 0 N, and consistent findings were studied (Ghoulam et al., 2002; Guo et al., 2021).
Conclusively, a decreasing N fertilization in alkali soil prominently accumulated soluble sugar and starch in the roots, being assumed to be utilized as a metabolic energy to promote deeper root development. On the contrary, excessive N fertilization led to a decreasing tendency of starch in both leaves and roots.
Nitrogen metabolism
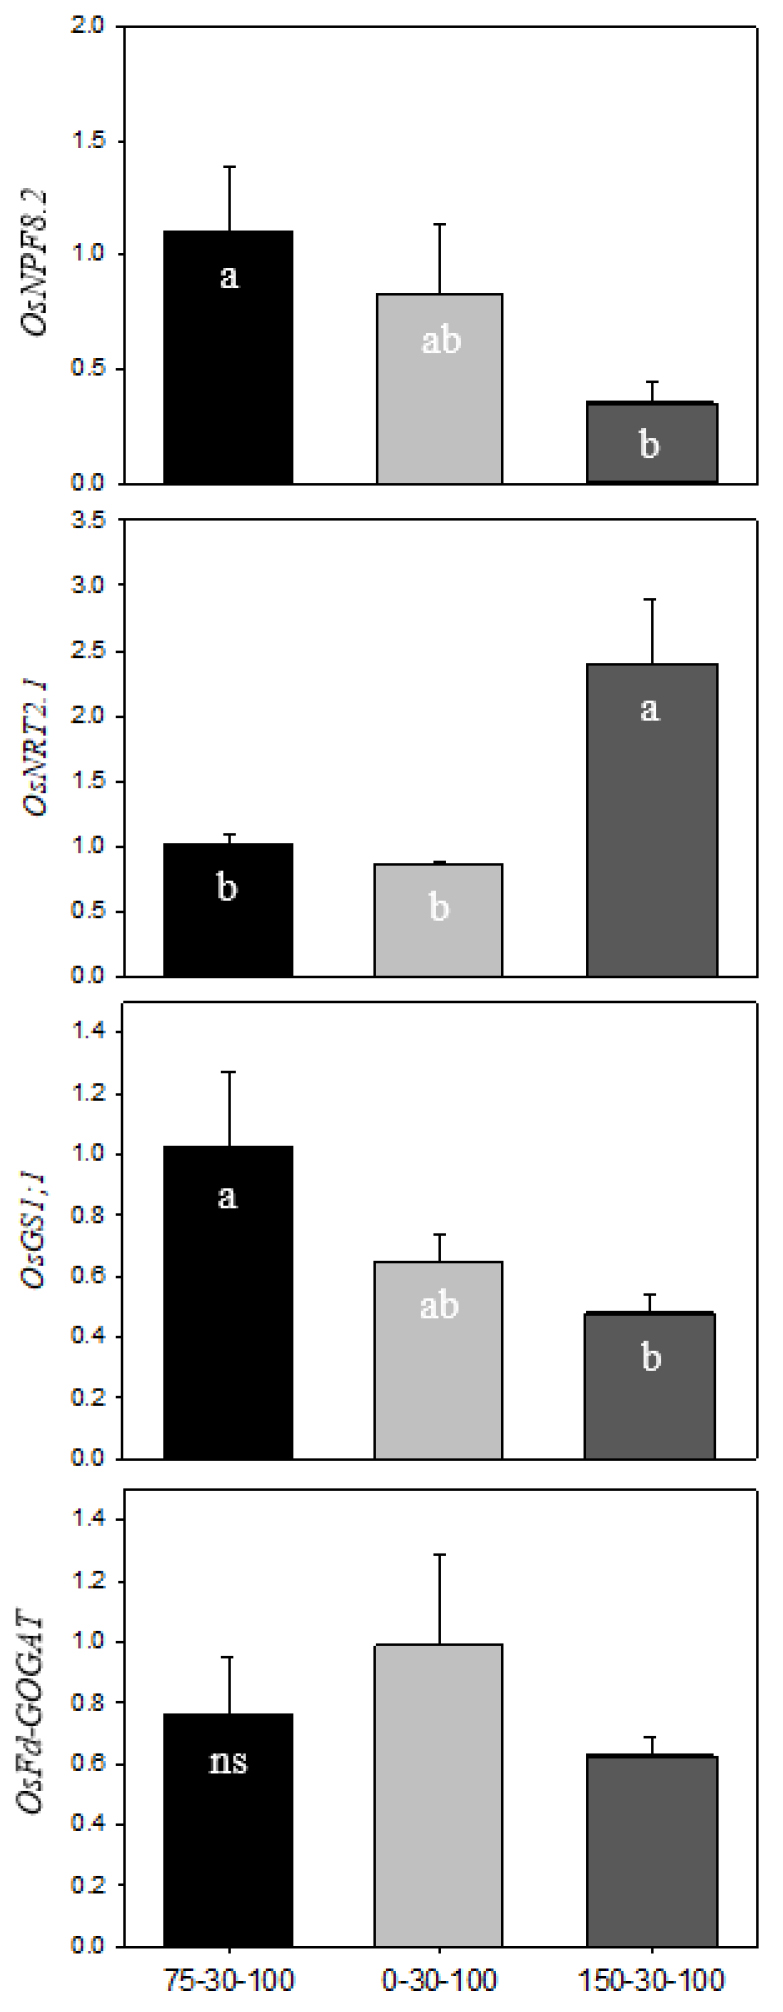
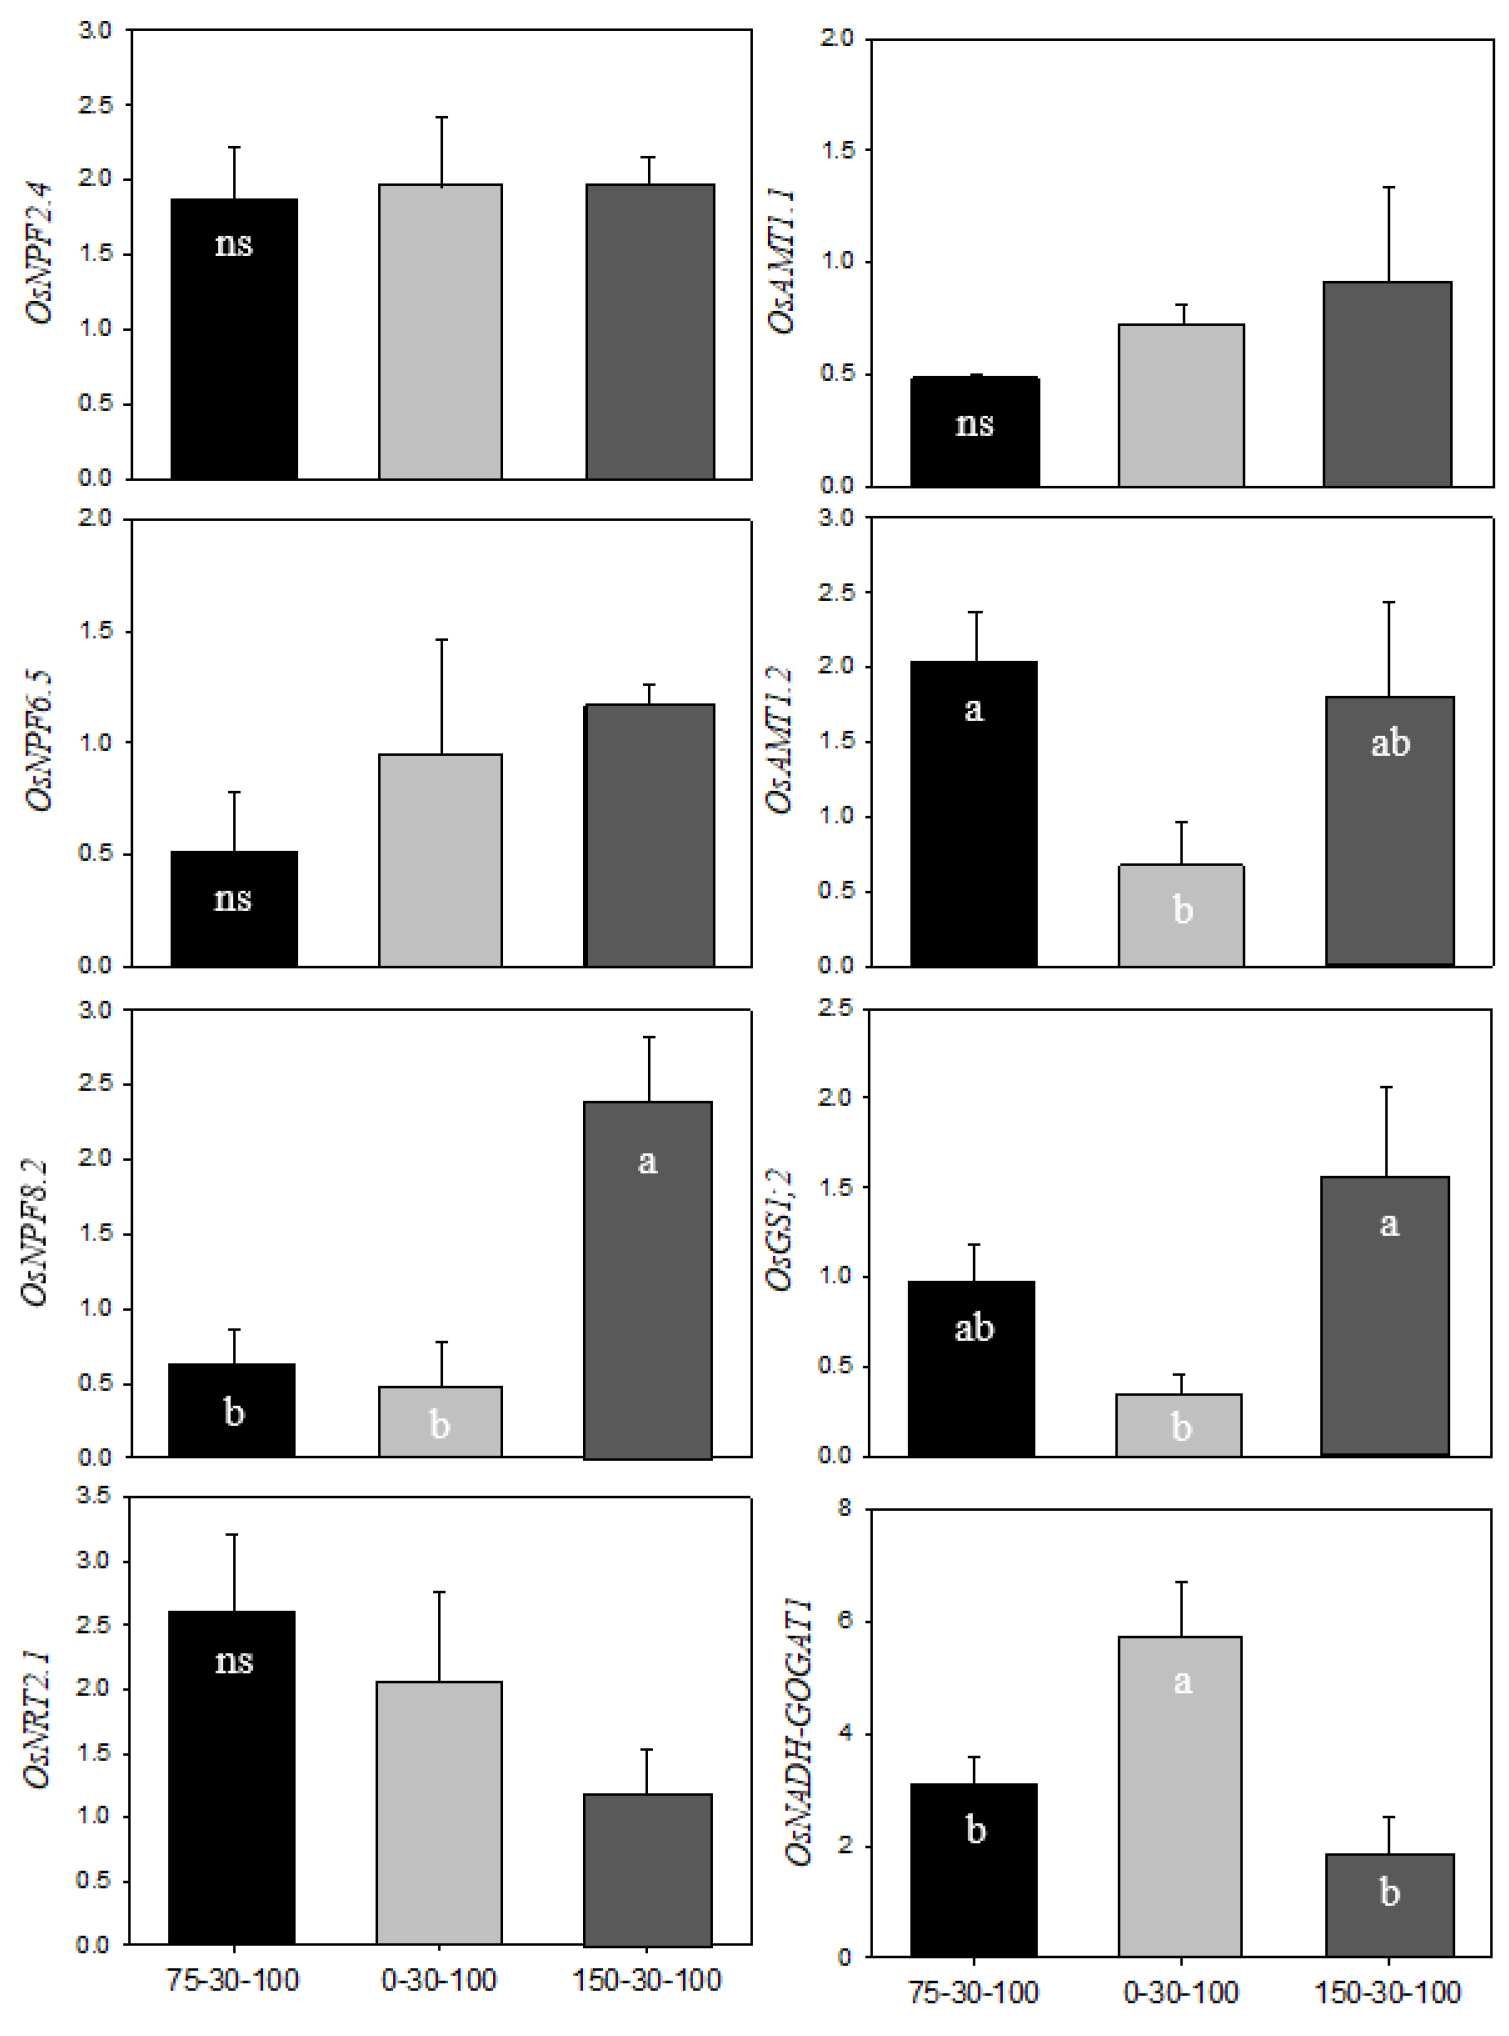
The relative expression of genes involved directly in acquisition, mobilization and assimilation of nitrogen in the leaves and roots was measured by qRT-PCR at heading stage (Fig. 2 and 3). Overall, gene expression was strongly affected by N fertilization rates. In the leaves, OsNPF8.2 (nitrate peptide transporter family), ammonium transporter, was down-regulated under higher N condition (150 N), meanwhile, OsNRT2.1, nitrate transporter, was significantly up-regulated. OsGS1;1 in higher N condition was down-regulated up to 40% compared to the control (75 N), however, the expression of OsFd-GOGAT, encoding glutamate synthase, was not different from N fertilization rates. In the roots, the expression of ammonium-acquiring transporters, OsNPF8.2 and OsAMT1.2, was noticeable, whereas nitrate-responsive genes were not significantly different from N fertilization rates. N assimilation-involved genes, OsGS1;2 and OsNADH-GOGAT, differently responded to N fertilization rates; up-regulation of OsGS1;2 under higher N and up-regulation of OsNADH-GOGAT under lower N condition. Salt-affected alkaline could interfere with N availability, causing low N utilization (Debouba et al., 2006). N uptake, NO3- and NH4+, was depended on the affinity of enzymes; up-regulation in high-affinity and down-regulation in low-affinity (Wang et al., 2012). Most of free ammonium taken into roots is incorporated into GS/GOGAT cycle and transported to the shoot via xylem mainly in glutamine form. Alkali stress markedly restricted the expression of OsGS1;2 and OsNADH-GOGAT1 in rice roots (Wang et al., 2012; Wang et al., 2015). In this study, high N fertilization in alkali stress strongly stimulated glutamine biosynthesis in the roots rather than in the leaves, which was coupled with soluble sugar level. Meanwhile, N deficit (0 N) stimulated the expression of OsNADH-GOGAT1, which was directly involved in resupply of NH3. This indicates that N deprivation in the roots regulates the carbon cycle (2-oxoglutarate) to facilitate sugar transport from shoot to root. Consequently, it has been proposed that an increase in N application in high soil pH condition preferentially acquired ammonium-N and promoted an abundance in glutamine in the root, on the contrary, N deficit condition led to a regeneration of glutamate by up-regulation of OsNADH-GOGAT1. Additionally, OsGS1;1 was negatively correlated with soluble carbohydrates in the leaves and roots, which could be assumed that the accumulation of soluble sugar and starch was attributed to reduced glutamine synthesis.

Fig. 2.
Relative expression levels of N metabolism-encoding genes in the leaves of rice by different levels of N fertilization (75 N, 0 N and 150 N) at heading stage. Gene expression was validated by qRT-PCR, and relatively quantified with 2-△△ct method. Each letter indicates a statistical difference by Tukey’s HSD test (p < 0.05, n = 3). X axis indicates N-P2O5-K2O level.

Fig. 3.
Relative expression levels of N metabolism-encoding genes in the roots of rice by different levels of N fertilization (75 N, 0 N and 150 N) at heading stage. Gene expression was validated by qRT-PCR, and relatively quantified with 2-△△ct method. Each letter indicates a statistical difference by Tukey’s HSD test (p < 0.05, n = 3). X axis indicates N-P2O5-K2O level.
Conclusions
Most previous works on crop responses against an alkali stress have been simulated with chemical agents. In this study, an alkaline soil was used to investigate an effect of various levels of N fertilization on carbon and nitrogen metabolisms of rice. Our results show that supplemental N supply did not promote growth and N uptake of rice. Variables of N fertilization greatly affected the status of soluble carbohydrates in the roots rather than in the leaves. Under alkali stress, high N fertilization significantly up-regulated the expression of gene encoding glutamine synthesis in the roots, while N deficit catalyzed glutamate regeneration. It means soluble carbohydrates were negatively interacted with glutamine synthesis in alkali stress. Accordingly, an increase in N fertilization did not show the effect in terms of rice growth and N utilization. and further study is required to investigate the effect of N fertilization on rice growth and nitrogen metabolism with diverse soil conditions, especially different pH and nutrient status.


