

Introduction
Materials and Methods
Plant materials and treatments
Sampling: Soil and plant
Chemical analysis: Soil and plant
Nitrogen use efficiencies (NUEs)
Statistics
Results and Discussion
Soil inorganic nitrogen (N)
Growth and yield of pepper
Mineral (N, P and K) uptake of pepper and nitrogen use efficiencies (NUEs)
Conclusions
Introduction
Smart technologies which are limited in environmentally controlled systems such as greenhouse are rapidly and widely replacing conventional practices in agricultural sector. In particular, upland crops which are occupying approximately 23% of agricultural land are being a target to apply smart technologies as a measure of favorable crop production and labor-saving (KOSIS, 2021).
The precision agriculture (PA) is defined that an approach to farm management that uses information technology (IT) to ensure that crops and soil receive exactly what they need for optimum health and productivity, farm-customized decision support system (DSS). The goal of PA is to ensure profitability, sustainability and protection of the environment (Wikipedia, 2022). Of various techniques supporting PA, the customized nutrient management is one of essential considerations, and the 4R nutrient principle (right source, right rate, right time and right place) (Arnall and Phillips, 2015) has been proposed to optimize nutrient management in vegetable production. Crop growth rates-based nutrient management using a fertigation technique is an easy measure to implement a 4R nutrient stewardship.
The national scale using a fertigation, a drip irrigation, is continuously increasing year by year (25,245/52,444 ha (48.1%), MAFRA, 2020), and this technique is widening the use to upland crops including horticultural crops (Kang et al., 2010, 2011; Lee et al., 2022). The effect of the application of a fertigation has demonstrated from many studies implemented with greenhouse crops (Kumar and Singh, 2002; Lee et al., 2007, 2019, 2021; Jung et al., 2010; Ebrahimian and Playán, 2014; Ha et al., 2015; Sung et al., 2016; Chauhdary et al., 2017), and the comprehensive benefits are not only favorable crop growth and yield but also nutrients-saving (Salo et al., 2000; Hagin et al., 2002; Kumar and Singh, 2002; Ebrahimian and Playán, 2014; Chauhdary et al., 2017; Incrocci et al., 2017) and reduced environmental loading (Zinkernagel et al., 2020). Despite of the expansion of a fertigation technique, the guide for crop nutrient management greatly depends on the standard fertilization and/or soil diagnosis-based fertilization which are provided by NIAS (2019). Currently, the recommended fertigation guide provides some greenhouse crops such as oriental melon (Jung et al., 2010), zucchini (Ha et al., 2015), watermelon (Sung et al., 2016), spring Chinese cabbage (Lee et al., 2019), strawberry (Lee et al., 2021) and green onion (Lee et al., 2022), and this suggests the requirement to expand other crops including upland crops.
The crop plants greatly depend on essential mineral nutrients including nitrogen, phosphorus and potassium to not only maintain and/or increase their growth and yield but also to produce protective compounds against biotic- and abiotic-stresses. In terms of effective nutrient utilization, evaluating the nutrient use efficiency (NUE) is considered as an important index to understand how nutrients are partitioned into crop uptake, immobilization, runoff, and emission during crop production (Dobermann, 2007). Of those, the NUE has been handled due to its importance in crop functionality: from cellular to crop yield (Good et al., 2004; Xu et al., 2012; Badr et al., 2016; Miao et al., 2021; Ma et al., 2022).
Pepper (Capsicum annuum L.) is one of most important crops consumed as an edible and seasoned vegetable in Korea, and the cultivation scale reaches at 31,146 ha at open-field and 4,387 ha at greenhouse (MAFRA, 2020). However, there is a limitation to advance our knowledge for the effect of growth, yield, and nutrient uptake and utilization of open-field pepper employed with a fertigation system. Therefore, this study was conducted to evaluate a comprehensive effect on pepper performance growing with different types of a basal fertilizer and different rates of basal application and fertilization. The results will assist in the improvement of nutrient management strategy to achieve favorable pepper production in open-field.
Materials and Methods
Plant materials and treatments
Field experiment was performed at farmer’s field which is located in Goesan-gun, Chungcheongbuk-do, South Korea (36°8'N, 127°7'E) in 2021. Nine treatments were employed with 23 m2 of plot size, and arranged with the completely planned design (6 samples per treatment). The five-weeks-old pepper seedling (Capsicum annuum L. cv. Acestan, The Kiban Co., Ltd., South Korea) were transplanted with the density of 0.4 (plant) × 1.0 (row) m (approximately 25,000 plants ha-1) at May 10, 2021. Before two weeks of transplanting, the agricultural work process for the experiment including an installment of the fertigation system was performed and tested. Chemical fertilizer (CF, urea for N, superphosphate for P and potassium chloride for K), slow release fertilizer (SRF, N:P:K = 12:5:5%) and 50% of livestock compost (LC, 3.5% N) + 50% of chemical fertilizer were used as a basal fertilizer, and applied at two weeks before transplanting. The application rates of each basal fertilizer were 100, 50 and 30% of soil diagnosis fertilization, and the LC was adjusted based on the requirement of nitrogen. The fertigation was initiated with an equal amount at every 10 days (total 15 times) at 15 days after transplanting (DAT); fertigation 0% (only irrigation), 50 and 70% (an amount to be fertigated was equally divided for 15 times application). The initial irrigation point was set at -33 kPa according to water management guide for upland crops (NIAS, 2017).
Sampling: Soil and plant
In order to check the overall soil physico-chemical properties, soil samples (0 - 20 cm) were taken before (prior to the application of basal fertilizers) and after the experiment, and the result showed in Table 1. The soil samples (n = 6) from each treatment were obtained to measure soil inorganic nitrogen (N, nitrate + ammonium) at every 4 days from transplanting to 36 DAT. Pepper plants (n = 6) were taken at every 30 days from 30 DAT until final harvest (mid October), divided into leaves, stems and fruit, dried at 80°C for 45 h, and grinded for further analysis. The red pepper fruits were harvested every 10 days from early August and an accumulative production was estimated.
Table 1.
Selected physicochemical properties of field soil used for this experiment.
Chemical analysis: Soil and plant
The pH and EC were measured with pH/EC meter after 30 min of shaking (sampled soil : deionized-distilled H2O : 1:5). The inorganic N was measured with automatic-nitrogen analyzer (440 nm, Auto analyzer 3, BRAN + LUEBBE, Germany) after 30 min of shaking (5 g of sampled soil + 25 mL of 2 M KCl) and filtering (Whatman No. 2). The soil total carbon (dried soil) was measured C/N analyzer (vario Max CN Element Analyzer, Elementar GmbH, Germary), and transformed to organic matter with multiplying by 1.724. For available phosphate, 5.0 g of dried soil was mixed with 20 mL of Lancaster solution (330 mM acetic acid + 1.5 N lactic acid + 30 mM of ammonium fluoride + 213 mM sodium hydroxide + 50 mM ammonium sulfate, pH 4.25), shaken for 10 min, filtered (Whatman No. 2) and measured with UV-Spectrometer (720 nm, UV 1900i, Shimadzu, Japan). The exchangeable cations (5 g of dried soil) were analyzed with ICP (GBC, Intergra XL, Australia) after a series of extraction (25 mL of 1 N CH2COONH4, pH 7.0), shaking (30 min) and filtering (Whatman No. 2). For analyzing mineral contents from leaves, stems and fruits, dried plant samples (0.5 g) were firstly mixed with 5 mL of a extraction solution (377 mM H2SO4 + 36% perchloric acid), wet digested with stepwise increasing of temperature (150 - 250°C), filtered (Whatman No. 6) after cooling at ambient temperature, and adjusted to 100 mL with ddH2O. Nitrogen was measured with automatic-nitrogen analyzer (440 nm, Auto analyzer 3, BRAN + LUEBBE, Germany), phosphorus was measured with UV-Spectrometer (720 nm, UV 1900i, Shimadzu, Japan), and cations were measured with ICP (GBC, Intergra XL, Australia).
Nitrogen use efficiencies (NUEs)
The nitrogen (N) use efficiencies, such as the uptake efficiency of N (NupE), the utilization efficiency of N (NutE), the use efficiency of N (NUE) and the biomass use efficiency of N (BNUE) were calculated using the following formulas;
Statistics
The experimental design was a completely randomized design with three replications. Data were subjected to one-way ANOVA. If the ANOVA yielded a significant F value (p < 0.05), the differences between treatments were compared using LSD. All statistical analyses were performed using SAS software (v. 9.2, SAS Institute, Cary, NC, USA), and graphs were generated using Sigma Plot (v. 14.5, SYSTAT, Palo Alto, CA, USA).
Results and Discussion
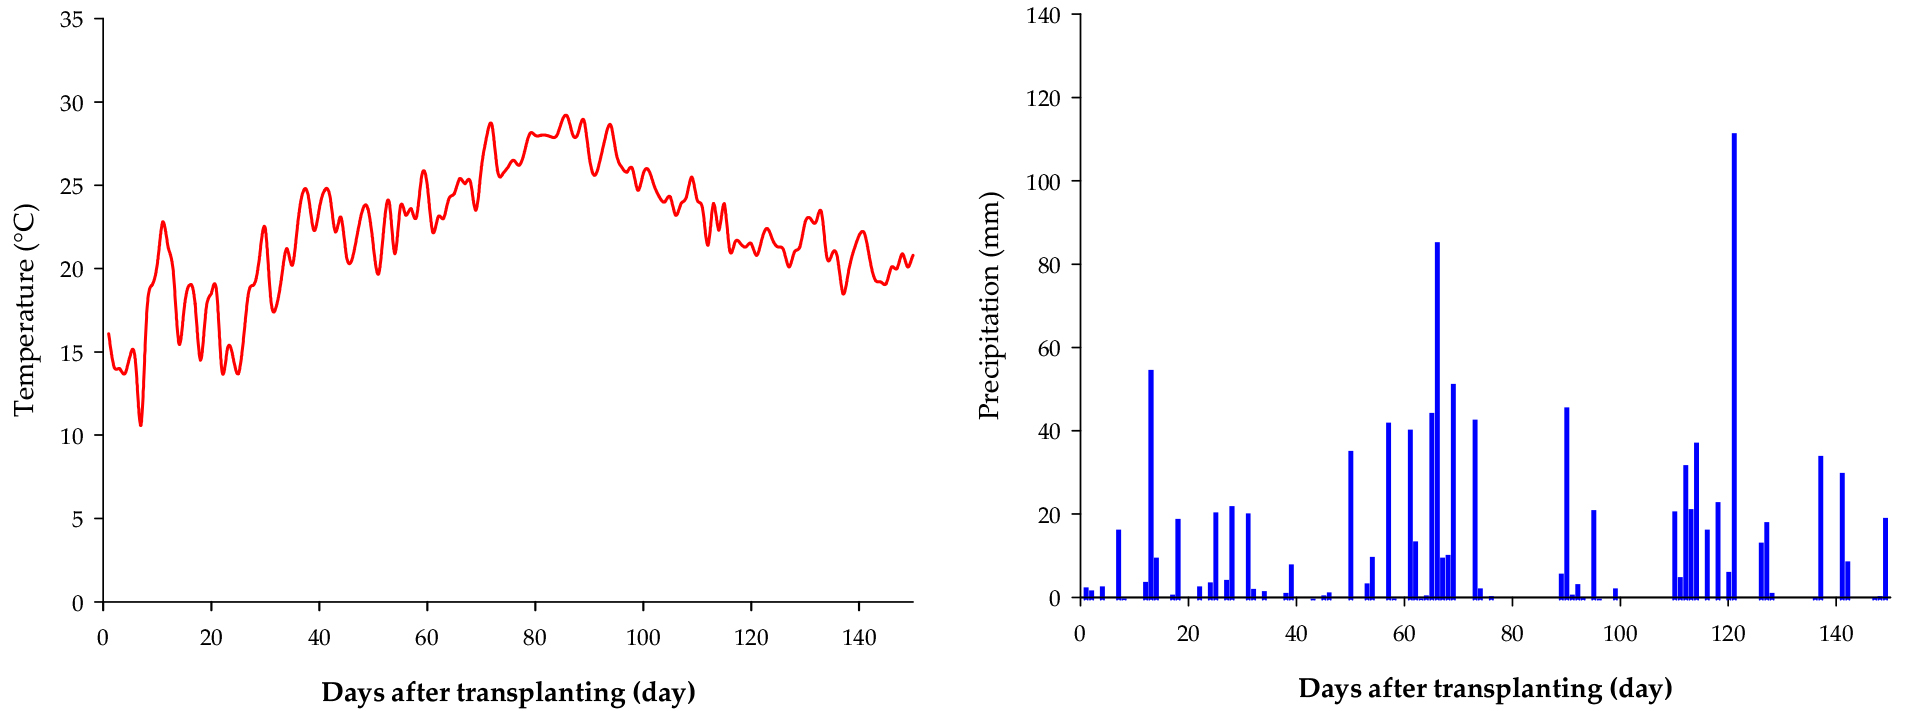
Soil physico-chemical properties of the experimental field was fitted with open-field pepper production except for the relatively higher concentration of available P2O5 compared to the recommendation (NIAS, 2019) (Table 1). Therefore, the phosphorus fertilizer was not applied in all experimental plots (Table 2). Overall, the different types of basal fertilizer and different fertigation ratio did not affect soil chemistry. The daily mean temperature and total precipitation during the whole growing season of open-field pepper was 20.9°C and 1,136.9 mm, respectively (Fig. 1).
In this study, the treatment (CF 50:50) which is widely recommended and practiced for open-field pepper production in South Korea, was used as a control group to compare the differences in inorganic nitrogen, pepper growth and yield, mineral (N, P and K) uptake and nitrogen use efficiencies, and thus we describe and discuss the results with focusing on significant variations.
Table 2.
Fertilizer application rates at different growth stages by treatments (kg ha-1).
†Fertigation was initiated from 15 days after transplanting. The amount of SRF application was firstly decided with a nitrogen requirement, and, if K is needed, K was applied as a potassium chloride (KCl) to compensate K requirement. In case of LC (3.5% N, 50%) + CF (50%), the amount of both fertilizers was supplied with the same way as for SRF.
Soil inorganic nitrogen (N)
Excess applying N fertilizer significantly increased soil inorganic nitrogen (NO3--N + NH4+-N) from 12 days after transplanting (26 days after basal fertilizer application) (Fig. 2). Inorganic N from CF 100 and SRF 100 was 72.8 ± 21.1 (40.9 - 105.1) and 82.7 ± 33.6 (49.2 - 140.1) mg kg-1, respectively, and this indicated 1.7- (CF 100) and 1.9-fold higher (SRF 100) compared to the control (CF 50:50). To know the effect of fertigation and basal fertilizer type, we classified the data (Table 3). Indeed, the variation in soil inorganic N was extremely dependent upon the fertigation (ratio of basal and fertigation) rather than the types of basal fertilizer. From 12 days after transplanting, soil inorganic N remained significantly higher in groups (fertigation 100:0), which indicated 40.9 - 99.0 mg kg-1, whereas those in both groups (fertigation 50:50 and 30:70) showed less than 50.0 mg kg-1 until 36 DAT. Organic fertilizers such as composts as a nitrogen source had a greater effect on lowering soil nitrogen content (Meng et al., 2005; Wang et al., 2015; Wu et al., 2020), which is indicating an agreement with a current result. Farneselli et al. (2018) suggested that an application of organic fertilizers could be an adequate strategy to reduce soil nitrate concentration. Our observation revealed that soil nitrate concentration in chemical fertilizer treatments including the SRF tended to remain significantly higher during monitoring. However, the higher level of soil nitrate was attributed to the fertigation ratio rather than the types of basal fertilizer. Therefore, our result suggests that an adaptation of fertigation ratio could be a strategy to achieve both the reduction in soil nitrogen loss (leaching) and the promotion of plant nitrogen utilization.
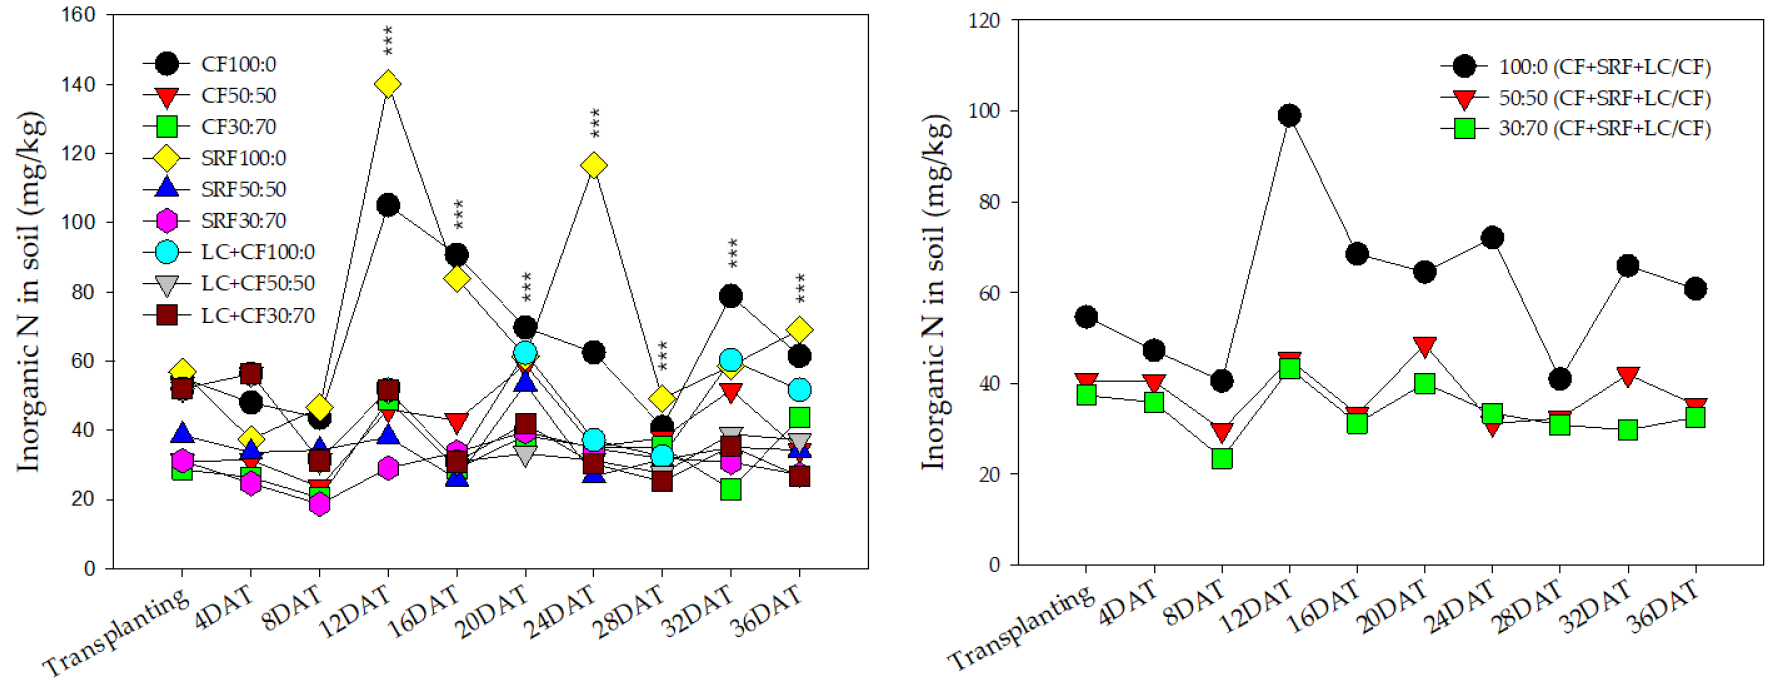
Table 3.
Time point comparison of soil inorganic nitrogen (NO3--N + NH4+-N, mg kg-1) between the ratio of basal and fertigation (top) and between types of basal fertilizer (bottom). this table is connected with Fig. 1.
Growth and yield of pepper
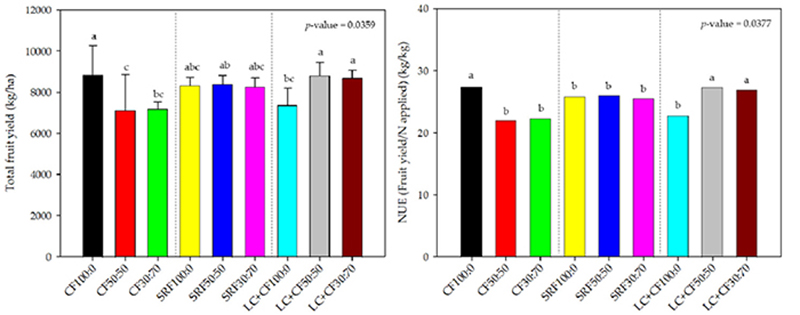
The overall shoot (leaves + stems + fruits) growth rates during the whole season showed a sigmoidal pattern regardless of fertigation ratio and types of basal fertilizer (Fig. 3a, 3c, 3e). The biggest jump in growth was observed between 60 and 90 DAT, which was the initial fruit setting period. The significant differences in shoot growth were observed at 90 and 120 DAT. The biomass production at 90 and 120 DAT was of 8,410 ± 537 and 9,908 ± 549 kg ha-1 for fertigation 50:50 and 8,059 ± 114 and 10,235 ± 745 kg ha-1 for fertigation 50:50 compared to fertigation 100:0 (6,783 ± 703 and 8,695 ± 778 kg ha-1), respectively (Fig. 3c). In contrast, different types of basal fertilizer did not affect the significant changes in shoot growth of pepper (Fig. 3e). Our finding was consistent with the previous reports, which observed that the growth pattern of vegetable crops showed a tendency of sigmoidal curve, which the rapid growth was observed during the fruit setting period (Ha et al., 2015; Sung et al., 2016; Zhou et al., 2018; Lee et al., 2021; Ma et al., 2022) (Fig. 3a, 3c, 3e). Total fruit weight (marketable) from most of the treatments ranged from 8,258 ± 432 to 8,832 ± 1,445 kg ha-1 except for CF 50:50 (7.111 ± 1,744), CF 30:70 (7,188 ± 330) and LC+CF 100:0 (7,368 ± 814 kg ha-1) (Fig. 3b). By contrast, the significance in the ratio of total fruit production to total biomass was not revealed by both fertigation ratio and types of basal fertilizer (Fig. 3d, 3f). The ratio of fruit production to total biomass since fruit setting (90 DAT) ranged from 0.54 to 0.67 by fertigation ratio and 0.55 to 0.64 by types of basal fertilizer. The main factor affecting fruit yield is total application level of nitrogen rather than the types of fertilizer (Ha et al., 2015; Sung et al., 2016; Zhou et al., 2018; Mehriya et al., 2020; Wang et al., 2015), although the difference in yield was due to depending on the types of fertilizer (Wu et al., 2020; Ma et al., 2022). The similar trend in the ratio between vegetative and reproductive organs (Fig. 3d, 3f) was observed in Ma et al. (2022), which indicating 60 - 70% of the relative distribution in fruit. Indeed, the growth and yield of open-field pepper is likely to greatly depend on fertigation ratio (between basal and topdressing), and it is also important to determine the requirement of growth rates-customized fertigation rates during crop growth.
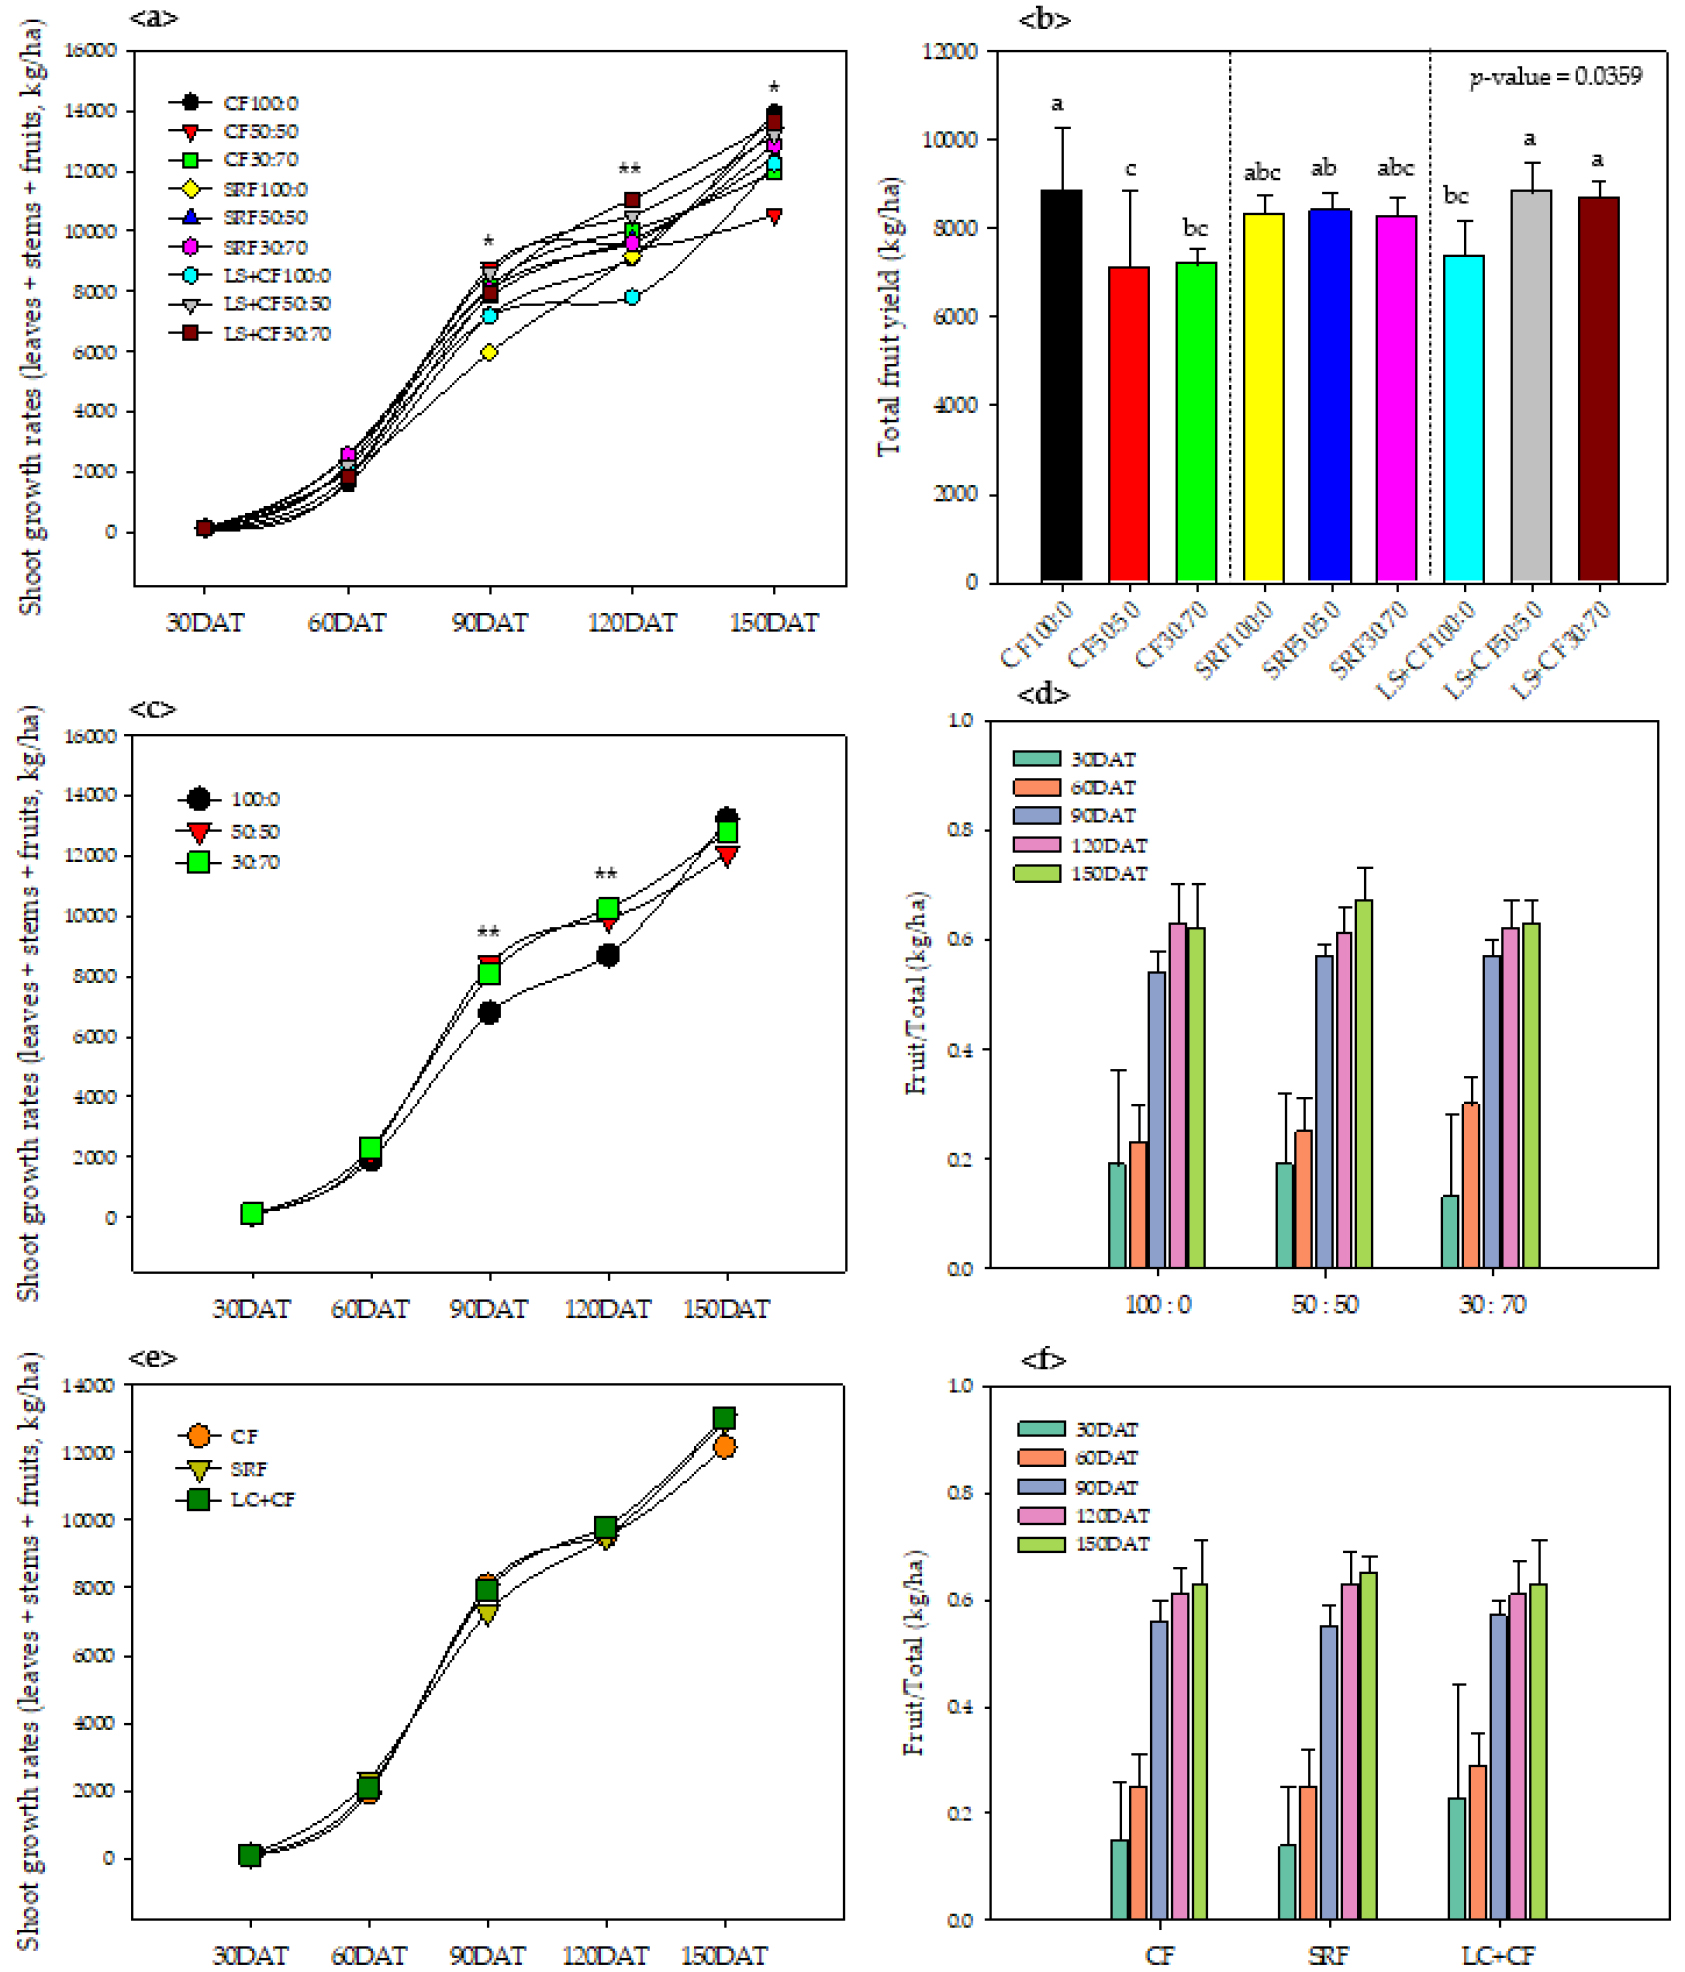
Fig. 3.
Differences in temporal growth rates (leaves + stems + fruits) between the treatments (a), fertigation ratio (c) and types of basal fertilizer (e), comparison of total fruit yield (marketable, kg ha-1) between the treatments (b), the ratio of fruits to total biomass by fertigation ratio (d) and types of basal fertilizer (f) (n = 6, p < 0.05). The star mark, * and **, indicate the significance at p < 0.05 and p < 0.001, respectively.
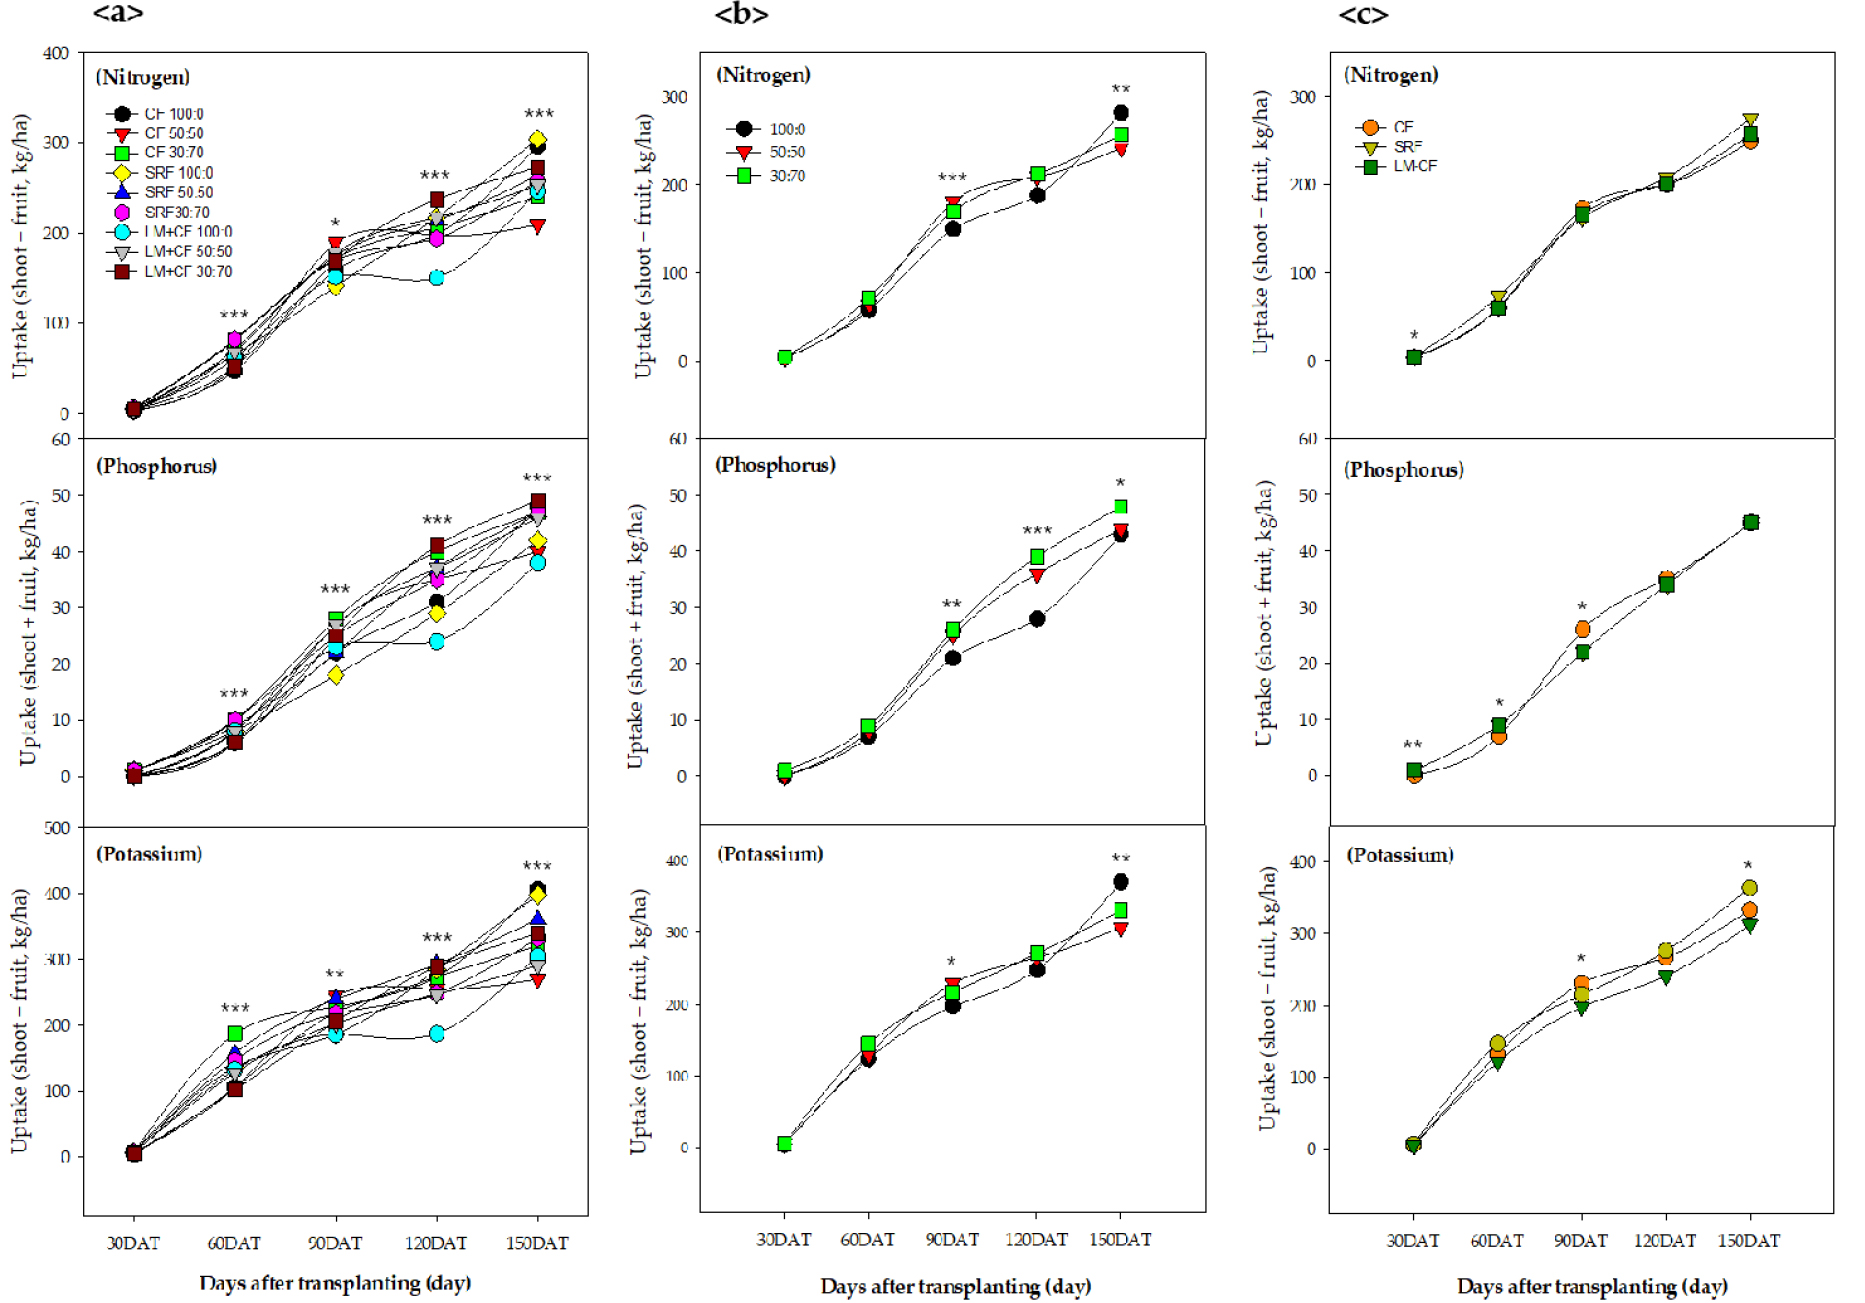
Mineral (N, P and K) uptake of pepper and nitrogen use efficiencies (NUEs)
The dynamic process of N, P and K accumulation in the shoot (leaves + stems + fruits) of pepper plants was similar to that of growth rates (sigmoidal curve) (Fig. 4a - 4c). An accumulation of N, P and K revealed significant differences between the treatments since 60 DAT (Fig. 4a). The average uptake (kg ha-1) unit period (30 days) from all treatments was 59.7 (30 - 60 DAT), 102.7 (60 - 90 DAT), 36.3 (90 - 120 DAT) and 57.0 (120 - 150 DAT) for N, 7.5 (30 - 60 DAT), 16.3 (60 - 90 DAT), 10.1 (90 - 120 DAT) and 10.4 (120 - 150 DAT) for P, 127.2 (30 - 60 DAT), 81.4 (60 - 90 DAT), 46.8 (90 - 120 DAT) and 74.5 (120 - 150 DAT) for K, respectively. Compared to CF 50:50 treatment, the average total mineral accumulation from all other treatments in the final harvest time significantly increased from 16 - 45% for N, 6 - 25% for P (except LC+FC 100:0, 4% lower) and 8 - 51% for K. The effect of fertigation ratio was also observed in all minerals (N, P and K) from 90 DAT (Fig. 4b) except for N and K at 120 DAT, whereas different types of basal fertilizer on mineral uptake significantly affected earlier growing season, 30 - 90 DAT except for K (Fig. 4c).
Selected NUEs, NupE, NutE, NUE and BNUE, were evaluated from different treatments of fertigation ratio and types of basal fertilizer (Table 4). Compared to the control (CF 50:50), all treatments except for the LC+CF 50:50 revealed significantly greater NupE, which was ranged from 1.8 - 2.3 (N uptake/N applied, kg kg-1). In contrast, the NutE (fruit yield/N uptake, kg kg-1) showed the highest in the LC+CF 50:50, meaning the relatively higher efficiency to N uptake, and that of the CF 100:0, CF 30:70 and SRF 100:0 was significantly lower compared to the control. The greatest NUE, a combination of NupE and NutE, was observed in the CF 100:0, LC+CF 50:50 and LC+CF 30:70, which were ranged from 26.9 - 27.3 (fruit yield/N applied, kg kg-1). The BNUE, as a measure of total biomass including fruit production, was markedly greater in all treatments, 37.0 - 43.2 (dry weight/N applied, kg kg-1), compared to the control. The results from fertigation ratio and/or types of basal fertilizer revealed the effect on the NupE and NutE. An adjustment of fertigation ratio, 100:0 and 50:50, was more effective on the NupE and NutE than other combination of fertigation ratio, respectively, and the LC+CF as a basal fertilizer significantly enhanced the NutE. The absorbed N from prolonged N fertigation is likely to be stored in vegetative organ such as leaves and stems rather than reproductive one (Zhou et al., 2018), and N deficiency tended to lead to increased partitioning to reproductive organ (Belanger et al., 2001). Contrary to these studies, in our experiment, the predominant N availability (NutE) revealed in the treatment, fertigation 50:50, which can be assuming that fertigated N is directly or via a leaf-to-fruit route incorporated into fruit. Moreover, the effect on NutE was preferred in LC+CF as a basal fertilizer, and this is considered as a result of consistent decomposition of N from LC during pepper growth period. A combination of inorganic N and organic sources such as green manure and crop residue could be an effective strategy to achieve both high N use efficiency and crop yield (Wu et al., 2020; Bhardwaj et al., 2021). In addition to the previous findings, we suggest that a practice of an appropriate fertigation ratio with a combined fertilizer (organic and inorganic) provides a balance of not only N availability but also pepper production.
Table 4.
Effect of different fertigation and basal fertilizer on nitrogen use efficiencies (NUEs) of open-field pepper at 150 DAT.
Conclusions
In recent years, many studies have evaluated the possibility to improve fertilizer use efficiency as a measure of achieving environmental improvement as well as crop production. An adjustment of fertigation ratio, basal and topdressing (50:50 or 30:70), could maintain and/or enhance pepper yield and NUE, with avoidance of higher soil nitrate concentration. In addition, a combination of organic and inorganic N as a basal fertilizer could be more effective in terms of achieving pepper N availability. This study provides partly to establish an optimal N fertilization strategy for an open-field pepper production system, and suggests the necessity to develop pepper growth-customized fertigation recipe as a further study.
