

Introduction
Materials and Methods
Soils and water samples
Chemical analyses
Statistical analysis
Results and Discussion
Patterns of pH1:5, ECe, ESP, and SAR of soils
Patterns of pH and SAR of inland lake water
Potential reasons of increased salinity and sodicity of the paddy soils
Conclusions
Introduction
The area of reclaimed tideland (RTL) in southwestern coastal areas of Korea is estimated to be 186,639 ha, which comprised of 12.3% of national arable land (MAFRA, 2023). The RTLs have been primarily used for rice (Oryza sativa L.) cultivation (Lim et al., 2020). Rice is not a salt-tolerant crop; rice yield is reported to decrease when the electrical conductivity of saturated soil paste (ECe) is > 3.0 dS m-1 and 50% loss of yield is expected at 6 - 7 dS m-1 (Francois and Maas, 1999). Despite that, rice is often cultivated as a pioneer crop in RTL because excessive salts are temporarily leached down by irrigation of less saline water (Lim et al., 2020). Although salts are temporarily accumulated after the harvest of rice through the capillary rise of saline water, literature indicated that salinity gradually decreases with the time of rice cultivation after completion of the reclamation (Guo et al., 2015).
Recently, Korean government encourages farmers to utilize the rice paddy in RTL for upland crop cultivation, such as miscellaneous cereals and forage due to the surplus of rice production over the rice consumption (Jeong et al., 2020; Lee et al., 2022; Seo et al., 2022). However, most upland crops are sensitive to salinity stress under limited irrigation, and thus desalinization of RTL soils is crucial for adoption of upland crops in RTL (Jeong et al., 2020). Desalinization of RTL soils is often coupled with increased soil organic carbon (SOC) and nutrient availability due to rice residue incorporation and fertilization (Lim et al., 2020). For example, in Korea, Park et al. (2022) reported that ECe decreased by 0.39 dS m-1 per year while SOC increased by 0.20 g C kg-1 per year after the reclamation when these soil variables were compared among 10 RTL districts with different reclamation history. Therefore, temporal changes in salinity are the key information of the overall changes in the soil quality of the coastal soils.
Despite that, recent trends in the changes in salinity of RTL paddies have not been investigated, limiting our understanding of the desalinization processes of the RTL paddies. The progress of desalinization of irrigated RTL paddies may differ with RTL districts due to different salinity of irrigation water and different edaphic properties including soil texture, which influences water percolation and capillary rise of saline groundwater, which eventually affect soil salinity (Park et al., 2022). High sand content may favor desalinization through enhanced downward movement of salts while preventing capillary rise of saline water and irrigation of less saline water would facilitate salt washing down (Lim et al., 2020). In this study, we investigated the changes in salinity and sodicity of five RTL districts, Bojeon (BJ), Goheung (GH), Gunnae (GN), Samsan (SS), and Youngsangang (YSG), located in the southwestern coastal areas of Korea to estimate the desalinization progress for the period between 2018 and 2023. These five RTLs are the major RTL districts under the Korean government’s management. For this study, we hypothesized that both soil salinity and sodicity may decrease with time, and these decreases may be greater for RTL districts with high sand content and with less saline inland lake water for irrigation.
Materials and Methods
Soils and water samples
Soil samples were collected from 139 paddy fields in five RTL districts between 2018 and 2023 (Table 1). In February – April each year, before rice cultivation, both top (0 - 20 cm) and subsurface (20 - 40 cm) soil samples were collected at three points in each field and composited. The soils were air-dried, passed through a 2-mm sieve, and used for chemical analyses. All soil samples were analyzed in the year when the samples were collected. According to Park et al. (2022), sand contents of the RTL districts differed, ranging from 8.5 ± 1.6 % for GN to 47.5 ± 4.9 % for BJ (Table 1).
Table 1.
Information of the coastal paddy districts and fields investigated in this study.
| Districts (code) | GPS coordinates |
Reclamation period |
Reclaimed area (ha) | Sand (%)1 |
Number of investigated fields | |||
| 2018 | 2020 | 2022 | 2023 | |||||
| Bojeon (BJ) | 34.47 - 34.48, 126.16 - 126.18 | 1987 - 1996 | 298 | 47.5 ± 4.9 | 3 | 5 | 5 | 6 |
| Goheung (GH) | 34.58 - 34.62, 127.19 - 127.23 | 1991 - 2005 | 3100 | 17.1 ± 4.4 | 8 | 9 | 9 | 9 |
| Gunnae (GN) | 34.53 - 34.56, 126.26 - 126.27 | 1990 - 2005 | 1381 | 8.5 ± 1.6 | 5 | 7 | 7 | 7 |
| Samsan (SS) | 34.52 - 34.54, 126.97 - 126.98 | 1997 - 2005 | 420 | 35.0 ± 3.4 | 5 | 8 | 8 | 8 |
| Youngsangang (YSG) | 34.60 - 34.73, 126.33 - 126.63 | 1985 - 2003 | 20,249 | 21.2 ± 6.2 | 15 | 17 | 17 | 20 |
1Data adopted from Park et al. (2022).
Irrigation water samples were collected from two points at the inland lakes of each RTL district on four times; before rice cultivation (February - April), during the rice growing season (June), after the rainy monsoon season (August), and after the harvest (October). The samples were filtered using Whatman #2 paper before analyses. Water samples were also analyzed in the sampling years.
During the study period, the total precipitation in the Chonnam province, where the five RTL districts locate, was 867.4 mm, 1479.3 mm, 1616.3 mm, 896.7 mm, and 1792.4 mm from 2017 to 2023, respectively. In this study, we also considered 2017, the previous year of this investigation, as the precipitation of the previous year of the sampling may affect the soil and water salinity. The mean annual temperature gradually increased from 14.2°C to 15.0°C for the corresponding period.
Chemical analyses
The pH of the soils was determined at a 1-to-5 of soil-to-water ratio using a pH-EC meter (Orion 3 STAR, Thermo Fisher Scientific Korea, Seoul, Korea) (Seo et al., 2021). The ECe of the soils was measured using the pH-EC meter with the saturated soil extracts obtained by extracting 200 - 300 g of saturated soil paste using a vacuum extractor (SampleTek 24VE, MAVCO INDUSTREIS, Inc., Kentucky, USA) (Rhoades et al., 1989). The extracts of the saturated soil pastes were also used for the determination of the concentrations of sodium (Na+), calcium (Ca2+), and magnesium (Mg2+) ions using an atomic absorption spectrophotometer (AAS) (Analyst 800, Perkin Elmer, Waltham, USA). The sodium adsorption ratio (SAR) was calculated using the following equation.
where, [Na+], [Ca2+], and [Mg2+] are the molar concentration (mol L-1) of the ions in the extracts.
The cation exchange capacity (CEC) of the soils was determined by an ammonium acetate method (Sumner and Miller, 1996). The extracts were analyzed for Na+ concentration using the AAS, and exchangeable sodium percentage (ESP) was calculated using the following equation.
where, [Na+] is the charge-molar concentration of Na+ in the extracts from the soils (cmolc kg-1) and CEC is the cation exchange capacity (cmolc kg-1).
Water samples were analyzed for EC and ionic concentrations (Na+, Ca2+, and Mg2+) using the instruments used for the soil analyzes, and SAR was calculated using the equation 1.
Statistical analysis
The effects of RTL districts, soil depth, year, and their interactions on the variations in pH1:5, ECe, ESP, and SAR were explored with an analysis of variance (ANOVA) using IBM SPSS Statistics 27 (IBM Crop., Amonk, New York, USA) at α = 0.05. The data were presented using a box plot to show the interquartile ranges of the data.
Results and Discussion
Patterns of pH1:5, ECe, ESP, and SAR of soils
The pH1:5, ECe, ESP, and SAR varied widely among the RTL districts, between the soil depth, and across the years (Table 2). With some exceptions, most soil samples had pH1:5 < 8.5, ECe > 4.0 dS m-1, ESP > 15, and SAR > 13, indicating that the soils are classified as saline-sodic soils (Lim et al., 2020; Seo et al., 2023). ANOVA indicated that the variations in these soil variables were significantly (P < 0.001) affected by RTL district, soil depth, and years with marginal interactions between the factors (Table 3).
Table 2.
Statistic summary of the salinity and sodicity of the paddy soils in the reclaimed tideland districts.
| Districts1 |
Soil layer | pH1:5 | ECe (dS m-1) | ESP (%) | SAR | ||||||||||||
| 2018 | 2020 | 2022 | 2023 | 2018 | 2020 | 2022 | 2023 | 2018 | 2020 | 2022 | 2023 | 2018 | 2020 | 2022 | 2023 | ||
| BJ | Top |
7.3 (1.0) |
7.3 (0.5) |
7.8 (0.2) |
8.2 (0.2) |
7.9 (2.4) |
11.3 (3.4) |
13.3 (4.1) |
9.8 (7.9) |
18.3 (1.7) |
49.7 (16.5) |
61.6 (18.0) |
55.4 (41.2) |
5.1 (1.8) |
10.1 (1.7) |
14.2 (3.7) |
36.8 (14.1) |
| Sub |
7.8 (1.4) |
7.7 (0.2) |
7.8 (0.2) |
8.3 (0.2) |
8.1 (1.3) |
11.9 (2.4) |
17.4 (6.2) |
10.7 (9.0) |
20.4 (3.9) |
56.3 (19.7) |
85.9 (28.8) |
63.3 (44.5) |
6.8 (1.7) |
15.4 (9.8) |
17.5 (5.0) |
34.5 (3.4) | |
| GH | Top |
8.2 (0.4) |
7.8 (0.1) |
7.5 (0.2) |
8.0 (0.3) |
10.7 (2.3) |
10.4 (2.0) |
12.7 (3.3) |
12.9 (1.8) |
15.3 (3.0) |
40.0 (16.1) |
44.4 (11.6) |
62.9 (22.6) |
6.2 (3.3) |
8.7 (1.8) |
13.4 (3.2) |
12.5 (10.5) |
| Sub |
8.6 (0.2) |
8.0 (0.3) |
7.5 (0.2) |
8.2 (0.3) |
12.2 (2.2) |
13.8 (2.8) |
14.7 (2.1) |
15.8 (4.0) |
15.4 (3.4) |
64.7 (26.3) |
47.8 (11.3) |
73.8 (29.3) |
5.5 (2.9) |
10.2 (2.8) |
15.0 (2.8) |
16.6 (6.3) | |
| GN | Top |
7.6 (0.8) |
7.6 (0.2) |
7.7 (0.1) |
7.6 (0.5) |
8.6 (1.6) |
8.9 (2.2) |
10.3 (2.4) |
9.0 (1.0) |
10.7 (1.8) |
29.8 (10.0) |
32.1 (10.8) |
36.8 (12.7) |
2.6 (1.4) |
8.4 (0.7) |
10.7 (2.1) |
30.0 (11.4) |
| Sub |
8.0 (0.2) |
7.5 (0.2) |
7.8 (0.1) |
8.0 (0.3) |
11.1 (0.8) |
11.5 (3.6) |
14.6 (2.3) |
11.5 (1.7) |
9.4 (1.5) |
38.5 (11.0) |
49.6 (10.8) |
40.3 (9.4) |
3.4 (2.3) |
8.3 (1.3) |
14.7 (3.1) |
39.0 (22.9) | |
| SS | Top |
8.5 (0.3) |
7.6 (0.1) |
7.3 (0.2) |
8.2 (0.2) |
8.4 (5.8) |
14.6 (5.0) |
19.8 (3.5) |
16.1 (2.1) |
22.9 (19.0) |
60.0 (24.7) |
78.6 (28.9) |
78.6 (14.7) |
3.7 (2.2) |
9.1 (0.8) |
17.3 (2.9) |
14.8 (6.3) |
| Sub |
8.7 (0.4) |
7.7 (0.2) |
7.6 (0.2) |
8.5 (0.2) |
8.1 (8.1) |
16.9 (6.5) |
18.4 (4.1) |
19.5 (3.9) |
19.8 (10.6) |
74.4 (28.3) |
84.7 (47.6) |
100.7 (22.4) |
4.3 (3.6) |
10.1 (1.1) |
18.8 (4.5) |
18.5 (4.4) | |
| YSG | Top |
7.6 (1.1) |
7.5 (0.3) |
7.4 (0.5) |
7.5 (0.7) |
8.4 (3.0) |
8.1 (2.3) |
7.1 (2.5) |
9.3 (3.3) |
14.0 (4.3) |
30.4 (9.7) |
35.4 (13.4) |
33.5 (18.5) |
9.7 (5.7) |
11.0 (2.8) |
10.3 (3.4) |
30.6 (20.1) |
| Sub |
8.1 (1.0) |
7.7 (0.4) |
7.6 (0.3) |
7.9 (0.7) |
11.9 (4.6) |
11.3 (4.0) |
9.5 (3.6) |
13.0 (5.8) |
13.4 (5.4) |
42.7 (17.0) |
45.3 (13.7) |
62.1 (26.5) |
8.7 (3.1) |
14.5 (6.3) |
13.6 (4.6) |
35.2 (17.4) | |
1Information of the districts are provided in Table 1.
The pattern of temporal changes in the soil variables differed with RTL districts as indicated by the significant interaction between district and year (Table 3). For Bojeon district (Fig. 1), pH1:5 gradually increased across the years, ECe and ESP increased between 2018 and 2022 but decreased in 2023, and SAR continuously increased with a sharp increase in 2023. The pH1:5 increment was coupled with the increased SAR, suggesting Na-induced increases in soil pH (Lim et al., 2020). However, this coupling of pH1:5 and SAR was not observed for Goheung district in which SAR (and ECe and ESP) continuously increased but pH decreased between 2018 and 2022, followed by a sharp increase in 2023 (Fig. 2). For Gunnae district, pH1:5 and ECe marginally changed with years, but ESP and SAR continuously increased particularly for the top soil (Fig. 3). Samsan district (Fig. 4) showed similar patterns of the changes in the soil variables to those of Goheung district with decreased pH1:5 between 2018 and 2022 followed by a sharp increase in 2023, which is decoupled with the increases in SAR. The soil variables of Youngsangang district changed in a similar manner to those of Gunnae district (Fig. 5).
Table 3.
Results of analysis of variance (Probability > F) on the variations in the pH1:5, ECe, ESP, and SAR of the coastal paddy soils with reclaimed tideland (RTL) districts, soil depth, and sampling year.
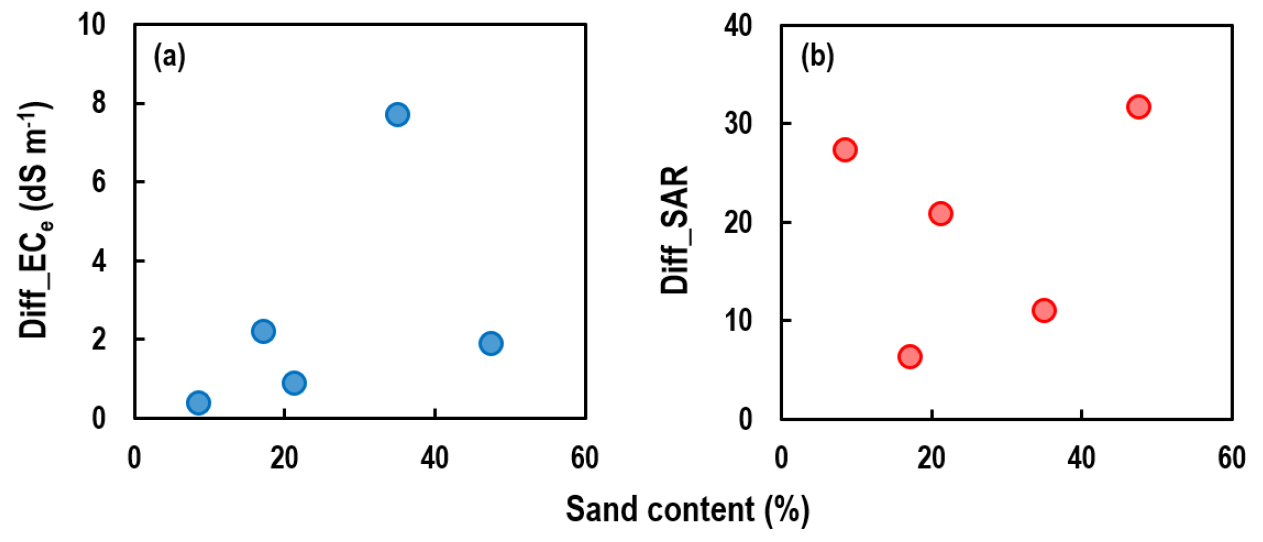
In contrast to our hypotheses based on the other previous studies (Lim et al., 2020; Park et al., 2022), our results show that there is no indication of decreased salinity and sodicity in our studied RTLs for the period between 2018 and 2022 (Figs. 1,2,3,4,5). Regarding the effects of sand contents, we could not find any indication of desalinization of soils regardless of sand content. For example, there was no correlation between sand content and the difference in ECe or that in SAR between 2018 and 2023 (Fig. 6). Nonetheless, these results indicate that SAR (and ESP) rather than ECe consistently increased across the sampling years.
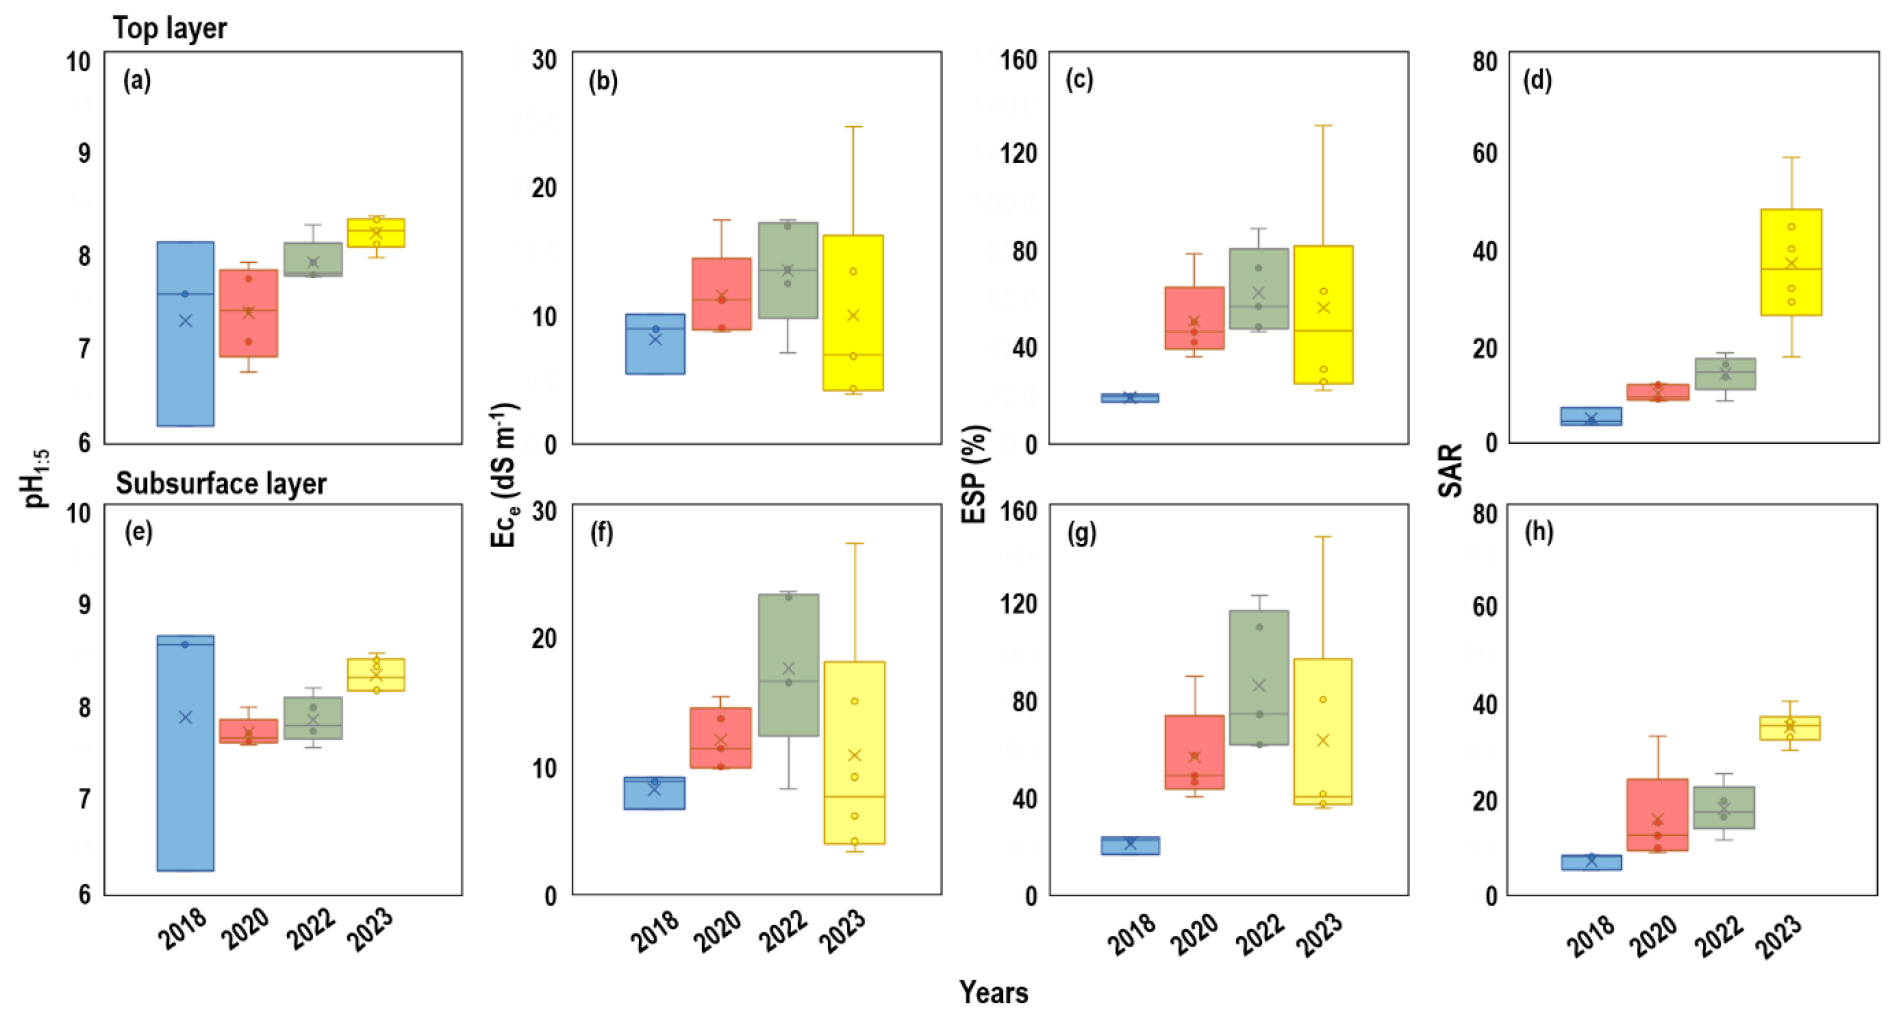
Fig. 1.
Distribution of pH measured at 1-to-5 of soil-to-water ratio (pH1:5), electrical conductivity of saturated soil paste (ECe), exchangeable sodium percentage (ESP), and sodium adsorption ratio (SAR) of paddy soils collected from Bojeon RTL district: (a–d) top and (e–h) subsurface soil. The boxes represent interquartile ranges (IQRs), horizontal lines and × marks within the boxes indicate the median and average values, respectively, and the uppermost and lowermost whiskers indicate the 75th percentile plus 1.5 IQR and the 25th percentile minus 1.5 IQR, respectively. Average values and the standard deviations are presented in Table 2.
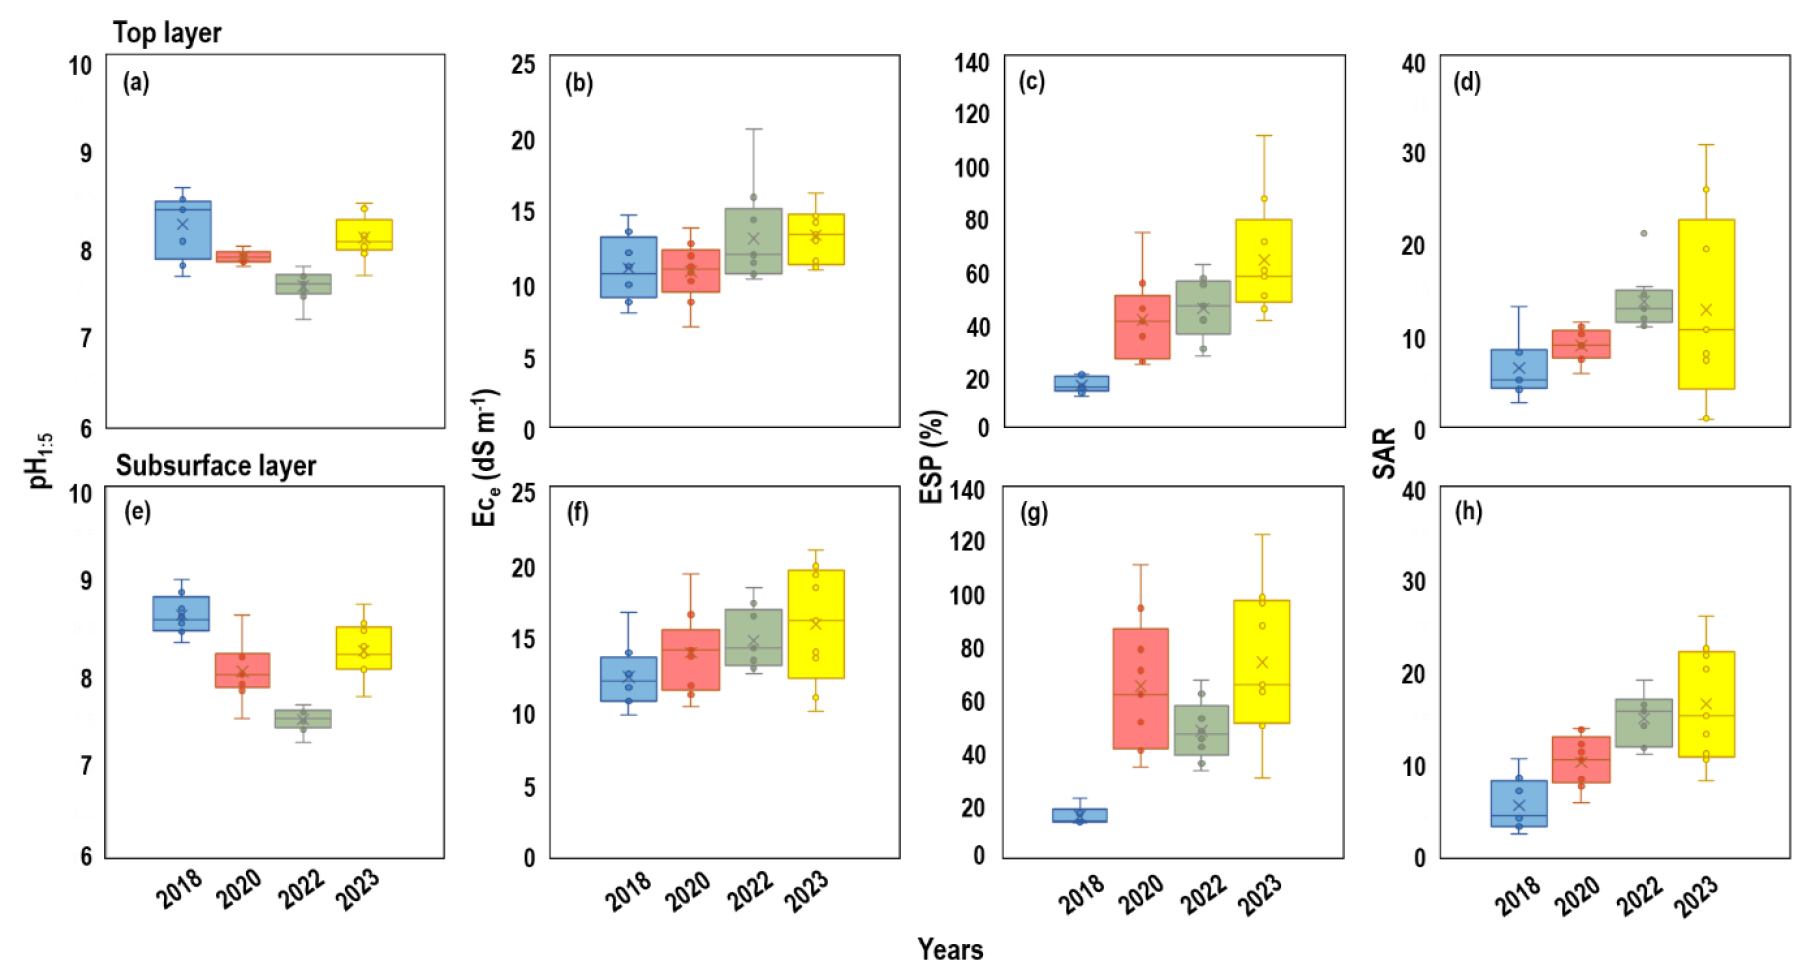
Fig. 2.
Distribution of pH measured at 1-to-5 of soil-to-water ratio (pH1:5), electrical conductivity of saturated soil paste (ECe), exchangeable sodium percentage (ESP), and sodium adsorption ratio (SAR) of paddy soils collected from Goheung RTL district: (a–d) top and (e–h) subsurface soil. The boxes represent interquartile ranges (IQRs), horizontal lines and × marks within the boxes indicate the median and average values, respectively, and the uppermost and lowermost whiskers indicate the 75th percentile plus 1.5 IQR and the 25th percentile minus 1.5 IQR, respectively. Average values and the standard deviations are presented in Table 2.
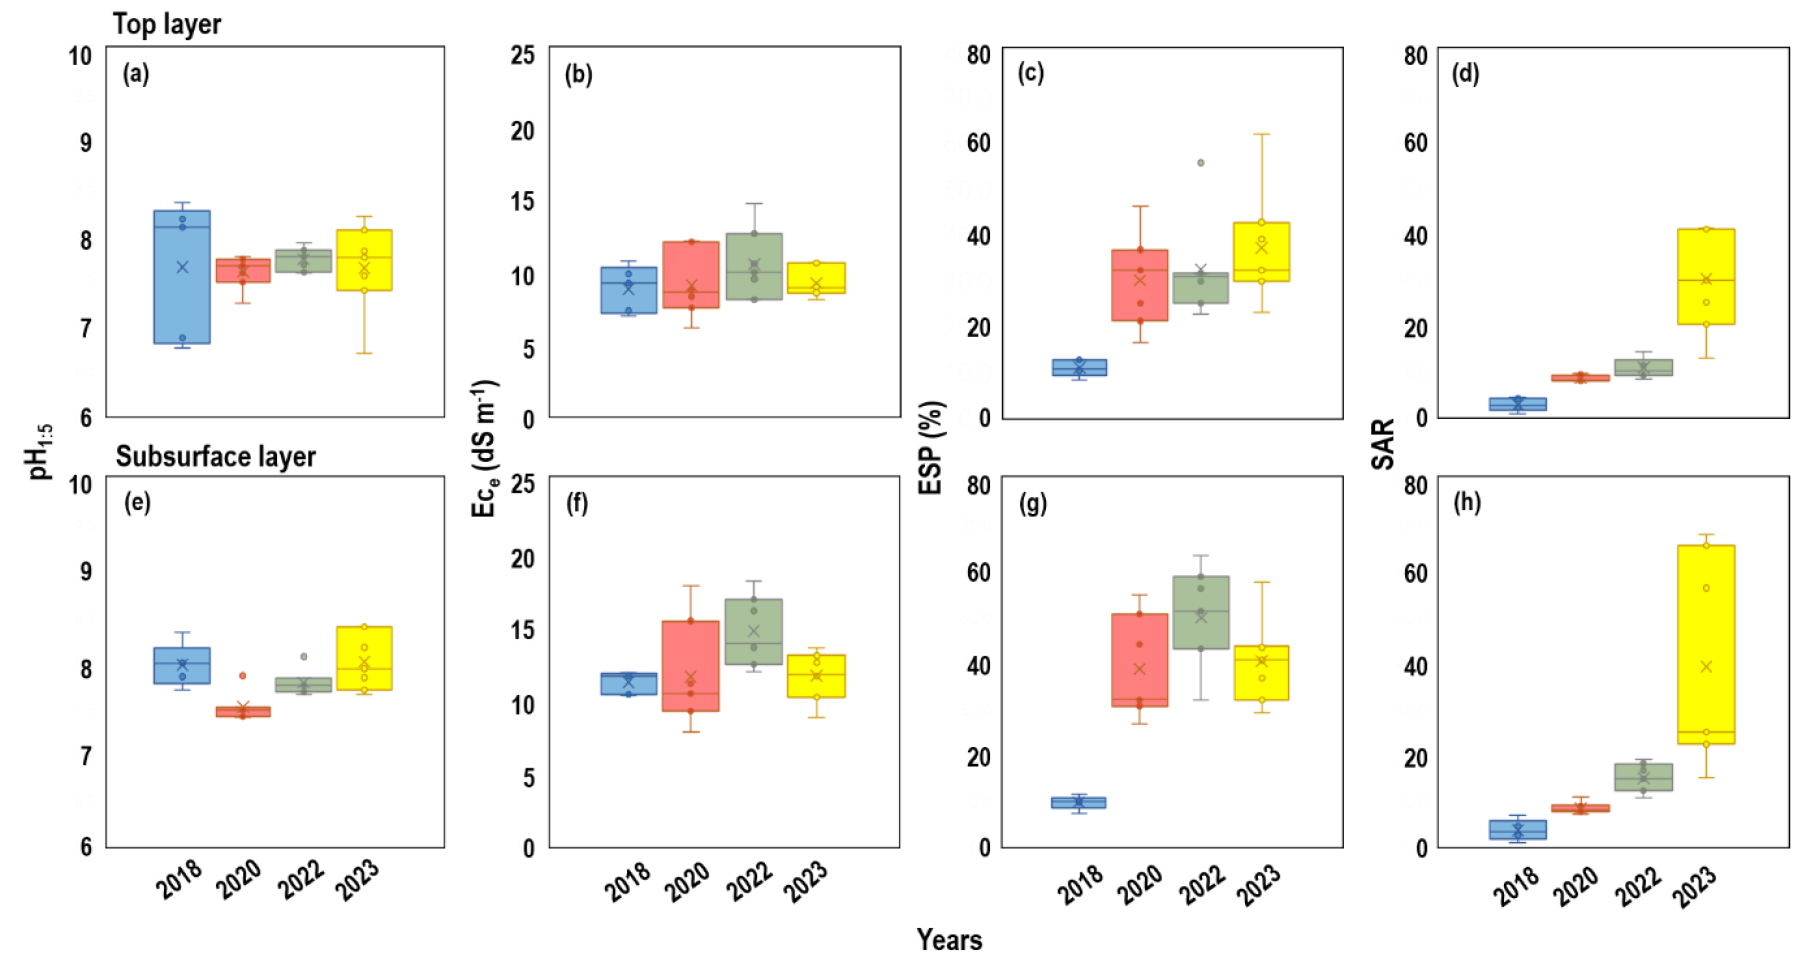
Fig. 3.
Distribution of pH measured at 1-to-5 of soil-to-water ratio (pH1:5), electrical conductivity of saturated soil paste (ECe), exchangeable sodium percentage (ESP), and sodium adsorption ratio (SAR) of paddy soils collected from Gunnae RTL district: (a–d) top and (e–h) subsurface soil. The boxes represent interquartile ranges (IQRs), horizontal lines and × marks within the boxes indicate the median and average values, respectively, and the uppermost and lowermost whiskers indicate the 75th percentile plus 1.5 IQR and the 25th percentile minus 1.5 IQR, respectively. Average values and the standard deviations are presented in Table 2.
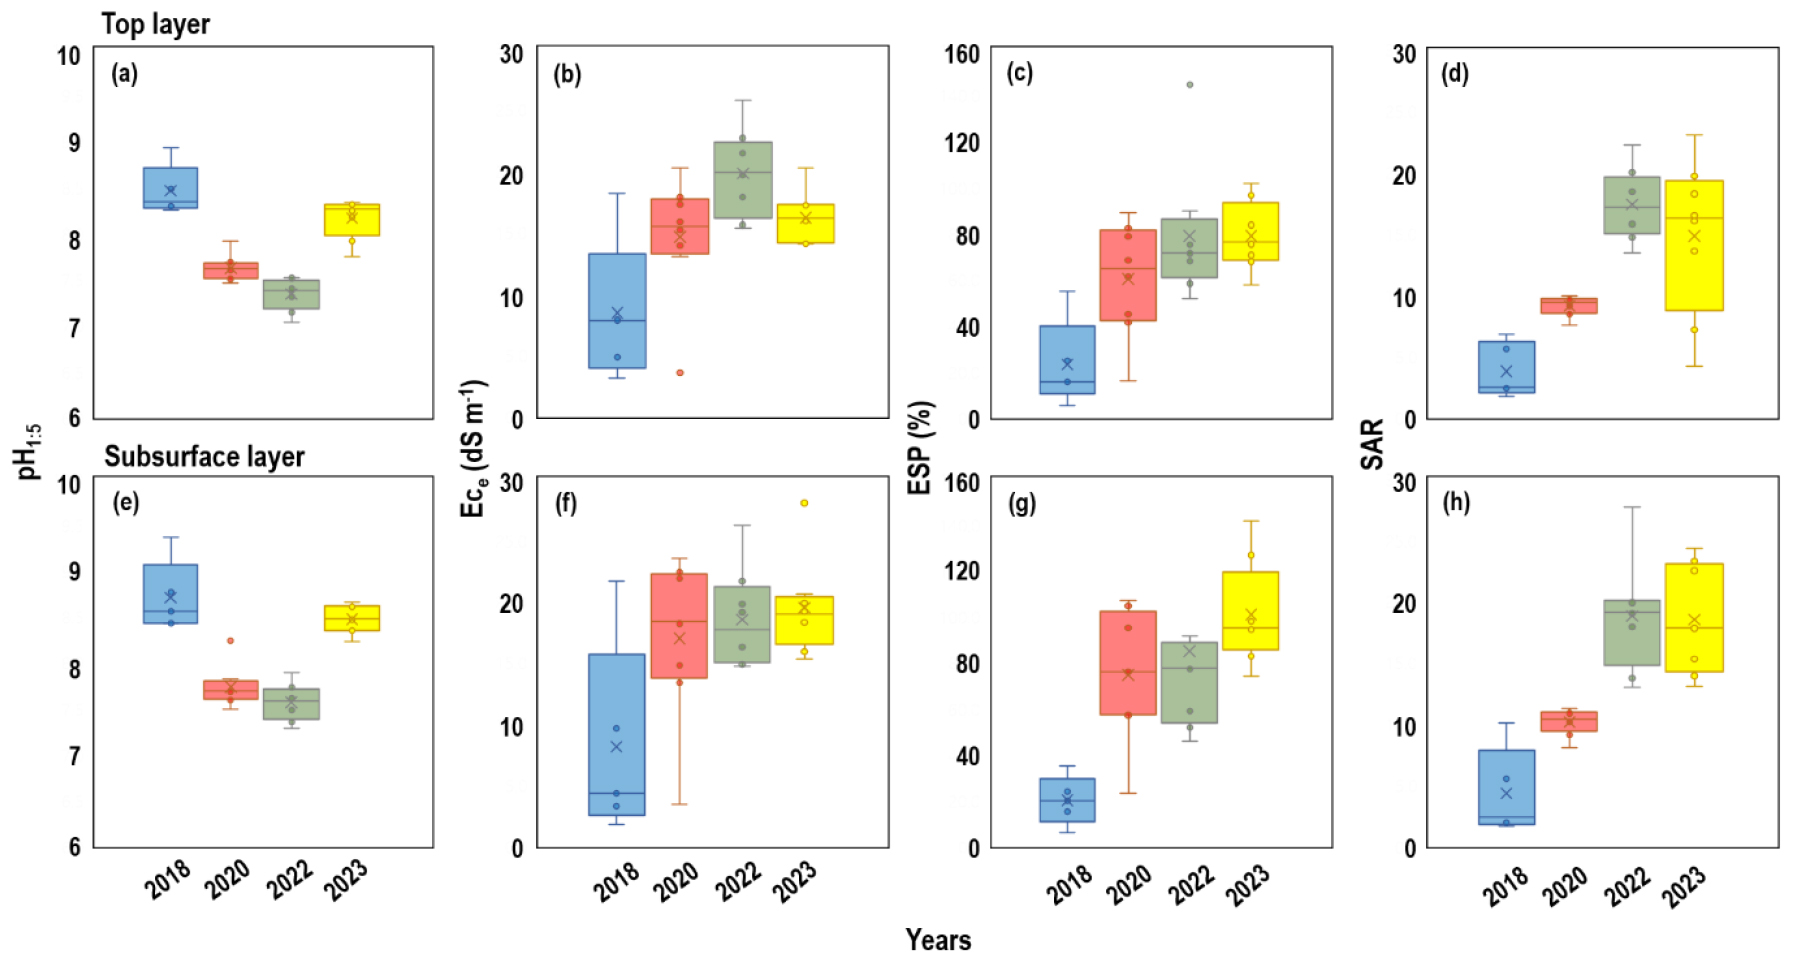
Fig. 4.
Distribution of pH measured at 1-to-5 of soil-to-water ratio (pH1:5), electrical conductivity of saturated soil paste (ECe), exchangeable sodium percentage (ESP), and sodium adsorption ratio (SAR) of paddy soils collected from Samsan RTL district: (a–d) top and (e–h) subsurface soil. The boxes represent interquartile ranges (IQRs), horizontal lines and × marks within the boxes indicate the median and average values, respectively, and the uppermost and lowermost whiskers indicate the 75th percentile plus 1.5 IQR and the 25th percentile minus 1.5 IQR, respectively. Average values and the standard deviations are presented in Table 2.
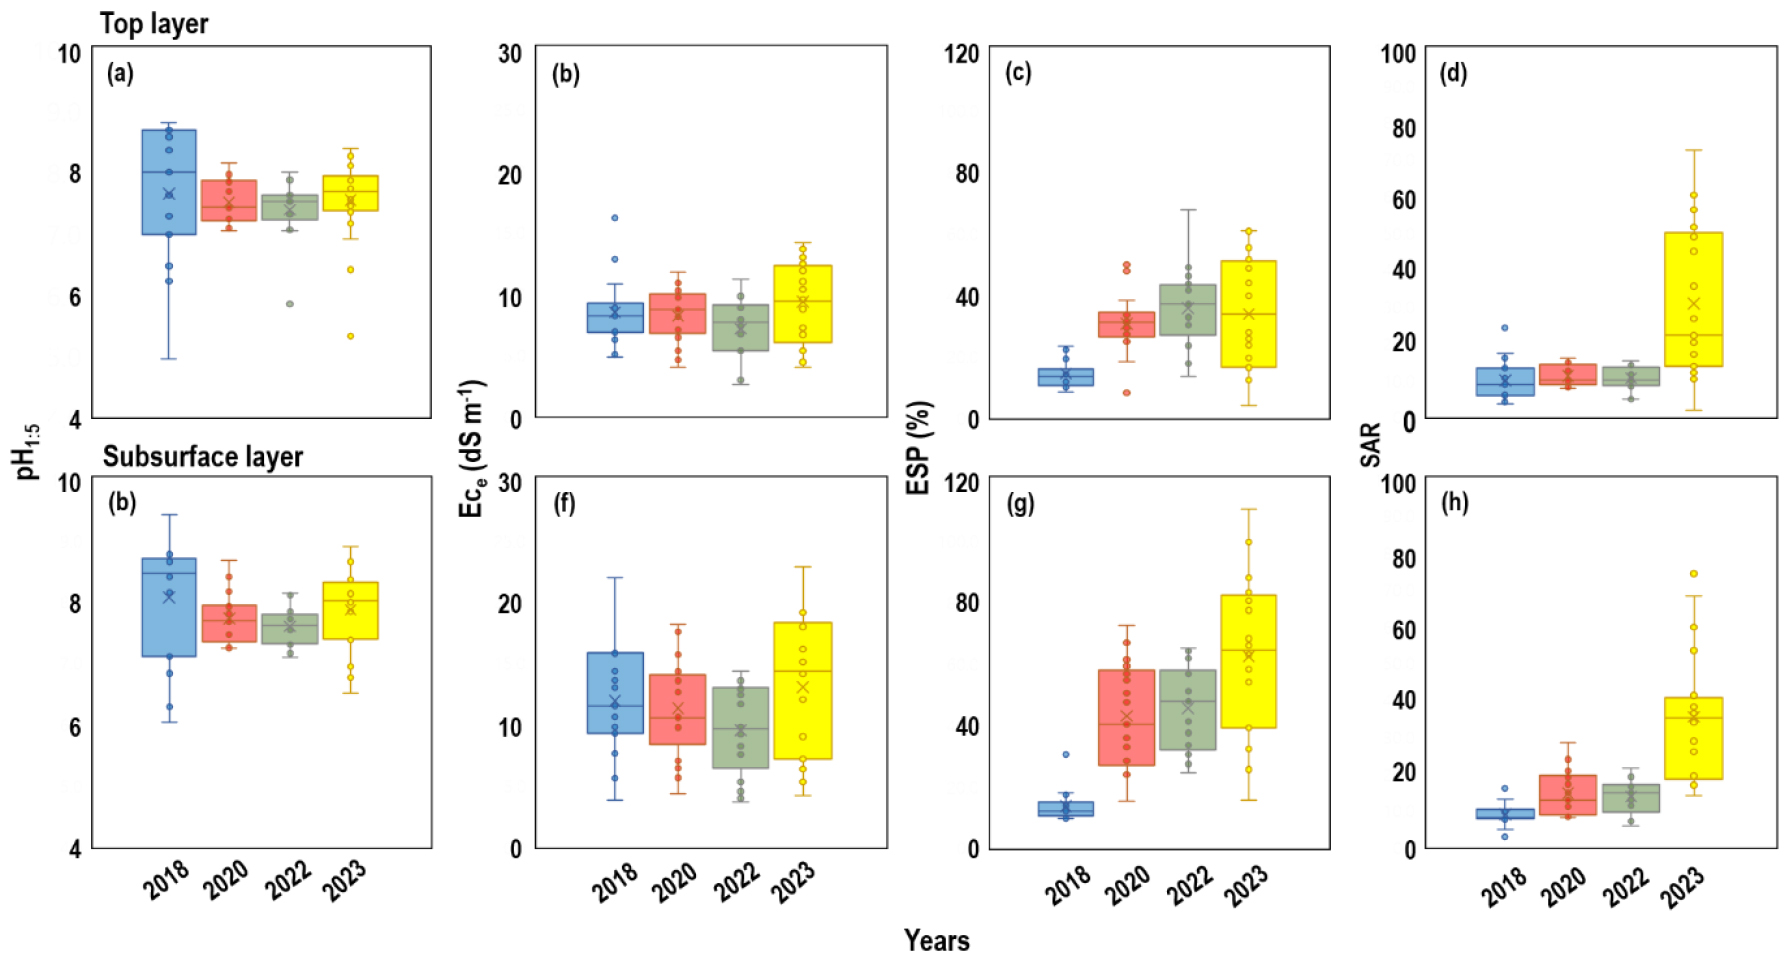
Fig. 5.
Distribution of pH measured at 1-to-5 of soil-to-water ratio (pH1:5), electrical conductivity of saturated soil paste (ECe), exchangeable sodium percentage (ESP), and sodium adsorption ratio (SAR) of paddy soils collected from Youngsangang RTL district: (a–d) top and (e–h) subsurface soil. The boxes represent interquartile ranges (IQRs), horizontal lines and × marks within the boxes indicate the median and average values, respectively, and the uppermost and lowermost whiskers indicate the 75th percentile plus 1.5 IQR and the 25th percentile minus 1.5 IQR, respectively. Average values and the standard deviations are presented in Table 2.
Patterns of pH and SAR of inland lake water
The EC of inland lake water fluctuated between 1.5 and 5.6 dS m-1 among the RTL districts and across the years with indication of temporal increases (P = 0.126) (Fig. 7a). According to the Food and Agriculture Organization, the threshold EC of irrigation water for rice cultivation is 2 dS m-1 (Maas and Hoffman, 1977; Park and Choi, 2023) and 25% yield loss is observed at EC of 3.4 dS m-1 (Maas, 1987). Therefore, inland lake water of Samsan and Youngsangang districts in 2018 and four districts except for Goheung in 2020 was suitable for rice irrigation; however, most districts in 2022 and 2023 showed EC of inland lake water at or above the threshold EC for rice irrigation. Interestingly, SAR of inland lake water of all RTL districts continuously increased from 3.5 - 6.7 to19.8 - 27.9 across the years (Fig. 7b). Salinity and sodicity of inland lake water are affected by several factors such as precipitation, evaporation, saline water intrusion, and inflow of paddy drainage water (Seong, 2014; Park and Choi, 2023). However, in the present study, the exact mechanisms of the increased EC and SAR are not clear due to lack of relevant information. Despite that, these increases in EC and SAR of the inland lake water indicate that the inland lake is under salinization.
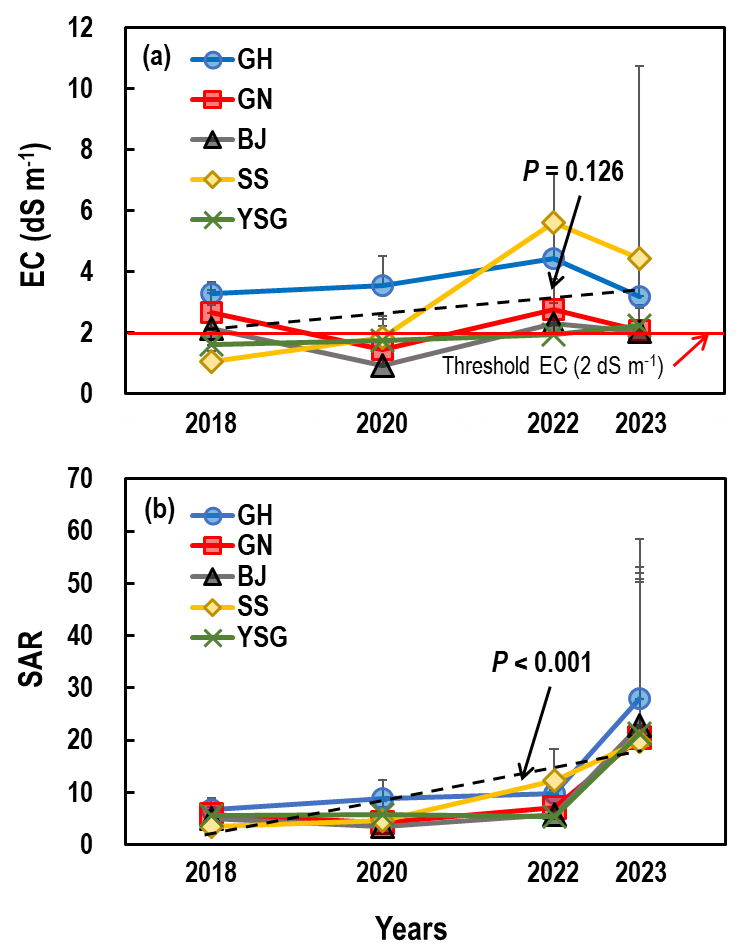
Fig. 7.
Temporal changes in electrical conductivity (EC) and sodium adsorption ratio (SAR) of irrigation water from inland lakes in reclaimed tideland districts: (a) EC and (b) SAR. Values are the means of four times sampling with the standard deviations depicted using vertical bars. The P values for the regression analysis of the changes in EC and SAR with years are provided. Information of the districts are provided in Table 1.
Potential reasons of increased salinity and sodicity of the paddy soils
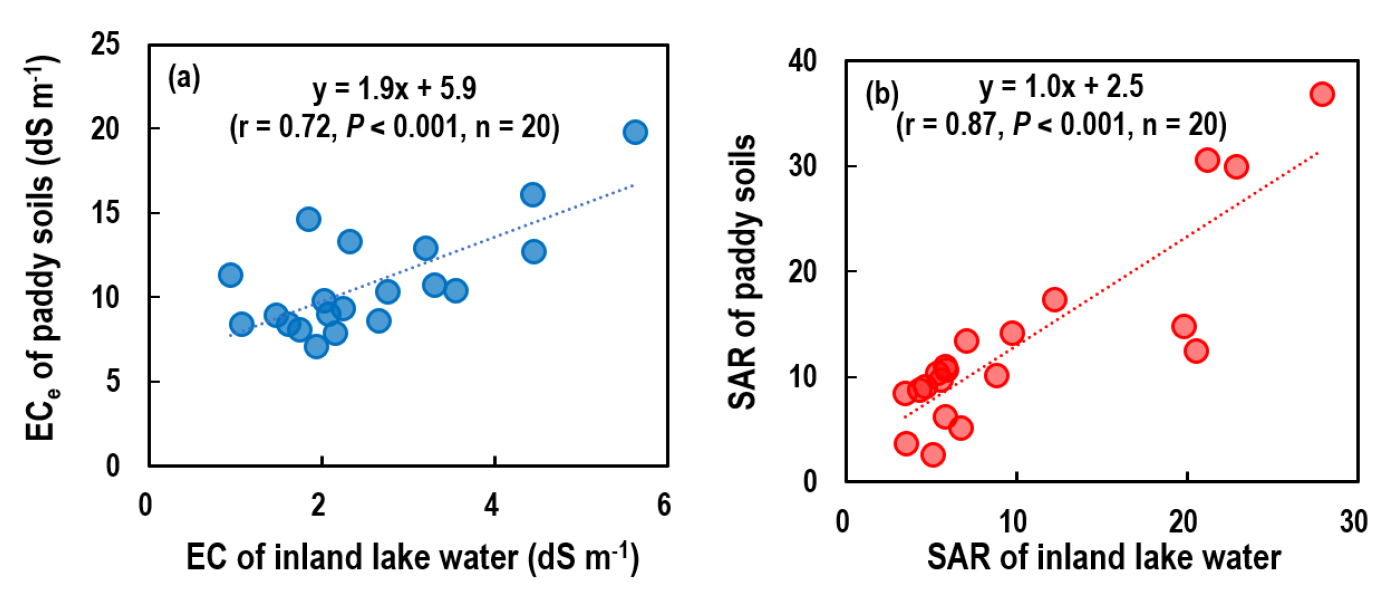
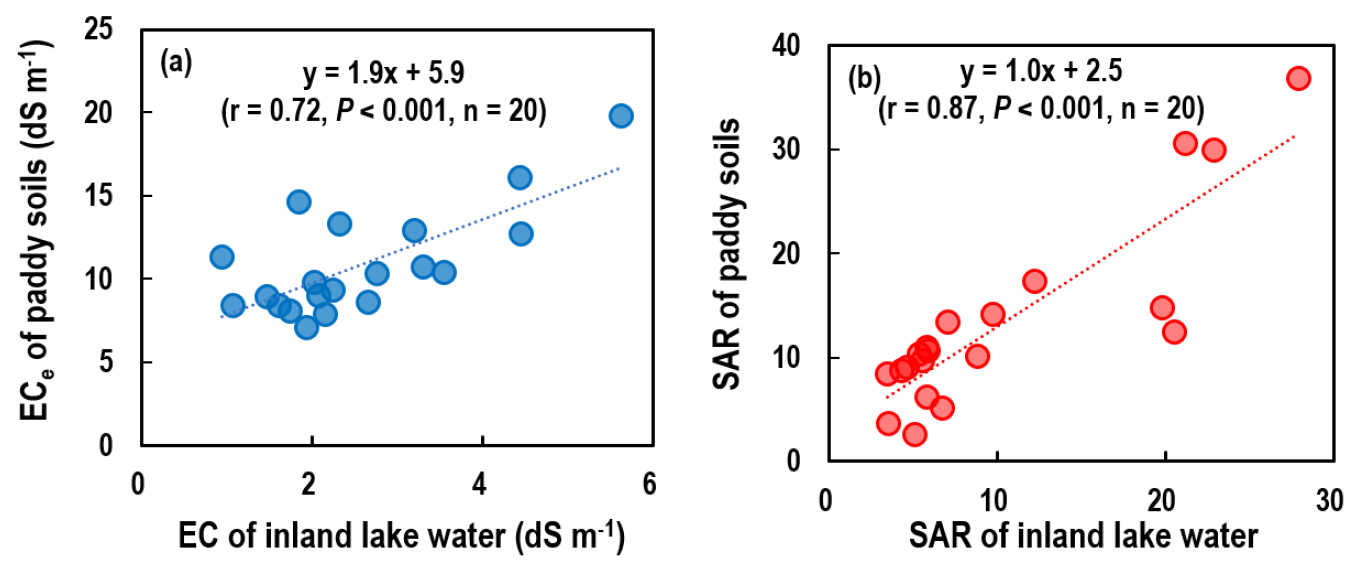
Although many studies reported that paddy soils in RTL are likely to gradually desalinize after rice cultivation with irrigation of less saline water (Lim et al., 2020; Park et al., 2022), our results showed opposite patterns (Figs. 1,2,3,4,5). The EC and SAR of the inland lake water were lower than those of paddy soils in the corresponding year (Table 2 and Fig. 7), and thus irrigation of the inland lake water may potentially help decreases in salinity and sodicity of the paddy soils. Despite that, a sharp increase in SAR of paddy soils in 2023 (Figs. 1,2,3,4,5) coupled with gradual increases in SAR of the inland lake water (Fig. 7) for all RTL districts suggests that repeated irrigation of water with a high SAR may increase sodicity as well as salinity of the paddy soils. Interestingly, there was a strong positive correlation between inland lake water and paddy soils in terms of EC (Fig. 8a) and SAR (Fig. 8b). These correlations clearly demonstrate that salinity and sodicity of paddy soils are directly affected by those of inland lake water that is used for irrigation of paddy soils.
Besides, salinity and sodicity of paddy soils might also be affected by precipitation and temperature. For example, the peak of SAR of paddy soils in 2023 might be also affected by the low precipitation (896.7 mm) in the previous year (2022) as low precipitation should retard salt washing down during the fallow season before soil sampling while allowing salt intrusion via capillary rise (Beom et al., 2023). In addition, gradual warming, which may increase the evaporation of inland lake water of the study sites, may be another reason for the increased EC and SAR of the inland lake water, which further affect the salinity and sodicity of the paddy soils via irrigation (Park et al., 2022; Seo et al., 2023).
Conclusions
Many studies suggested that coastal paddy soils are gradually desalinized with time of rice cultivation after reclamation. However, in this study, both salinity and sodicity of the study coastal paddy soils tended to increase for the period from 2018 to 2023. The changes in the soil salinity and sodicity were not correlated with sand content, suggesting that soil edaphic properties might not be critical factors for desalinization of intensively managed paddy soils with irrigation from inland lake water. Rather than, the strong correlations between inland lake water and paddy soils in terms of EC and SAR suggest that irrigation water quality is the dominant factor affecting soil salinity and sodicity under varying annual precipitation and with gradual warming.
