

Introduction
Materials and Methods
Study site description
Initial physico-chemical characteristics of the soil before experimental set-up
Experimental design and treatments
Land preparation and cropping system management
Field monitoring and data collection
Rainfall amounts and intensity received
Estimating cover management factors
Estimating the margins by which soybean and cover crops reduced total soil loss compared to bare land in the whole experimental period
Statistical analysis
Results and Discussion
Effects of soybean and cover crop cultivation and bare land, on soil loss and runoff in the three growing seasons
Cover management factor
Conclusion
Introduction
In the Highlands of Gangwon State, more than 70% of cultivated lands are on steep slope classes of over 7% slope gradient (Ryu et al., 2010). As a result, soils are subject to severe erosion and losses due to increased runoff amounts and velocities during rainfall events (Lee et al., 2010a; Jourgholami et al., 2020; Kang et al., 2021). About 80 Mg ha-1 yr-1 of soil is lost in the region annually (Kang et al., 2021). This value is greater than the critical highest risk soil loss value of 33 Mg ha-1 yr-1 determined by Organization for Economic Cooperation Development (OECD) standards (Jang et al., 2015), putting the area at a severe risk for loss of soil depth, soil fertility and agricultural productivity (Jang et al., 2015; Panagos et al., 2018; Yoon et al., 2023; Mag-Aso et al., 2024). Runoff and soil lost from agricultural fields may also cause environmental problems like eutrophication, scale formation, contamination of water bodies among others, off-site (Rekolaimen et al., 2006; Guan et al., 2021). It is therefore a major concern, to reduce runoff and soil losses in the Highlands, to sustain agricultural production and protect the environment.
Conservation tillage practices such as strip tillage, slope ridging, contour tillage and no-tillage (among others) are mechanical solutions often suggested for soil loss and runoff control (Laufer et al., 2016; Prochazkova et al., 2020; Madarasz et al., 2021; Akplo et al., 2022). However, biological measures like live vegetative cover, covering the soil with organic mulch and grassing waterways are also effective and economical methods with environmental benefits (Myers and Watts, 2015). The use of vegetation cover to control erosion has gained a lot of popularity around the world (Zuzao and Pleguezuelo, 2008; Myers and Watts, 2015; Kaye and Quemada, 2017). Below a critical vegetative cover percentage of 40%, accelerated erosion and associated soil loss is encouraged in sloping lands (Zuzao and Pleguezuelo, 2008). During vegetation cover, aboveground plant parts reduce runoff and soil transport by directly intercepting raindrops, reducing the soil detachment energy of raindrops that reach the soil surface, enhancing infiltration, transpiring water and adding organic materials to increase soil surface roughness, which creates more water catchment surface depressions on the soil (LaRose and Myers, 2019). The network of plant roots near the soil surface also serve as physical barrier to soil transport while improving soil permeability and infiltration through the holes they create in the soil profile (Gray and Sotir, 1996).
Many studies have shown variations in runoff and soil sedimentation under different vegetation types. Mohammad and Adam (2010) reported between 50 to 100% increase in runoff volumes and soil sediments with the removal of S. spinosum from forests and natural vegetation. Depending on the canopy structure of the crop used as a vegetative cover, soil loss and runoff may differ. Gao et al. (2020) observed that within a cultivation period, total soil loss and runoff under soybean cultivation in 3°, 5° and 8° slopes were significantly lower than those under maize cultivation and bare land because soybean had greater leaf area index. Thus, different crops have different protective mechanisms against soil loss and runoff. Therefore, identifying crops that serve both direct economic benefits and soil loss reduction purposes, together with proper conservation tillage practices, is important to agricultural sustainability in the Highlands.
Researchers at the Highland Agriculture Research Institute recommend a ‘cash crop-cover crop’ rotation and conservation tillage practices such as strip tillage seeding for soil loss management and promotion of sustainable cropping systems in the Highlands (Lee et al., 2010b; Ryu et al., 2010; Lee et al., 2014; Bak and Lee, 2021; Kim et al., 2023b). They calculate the cover management factors (C-factor) of crops and soil management practices to assess their effectiveness in reducing soil loss at the different phases of the growing season in the Highlands (Kim et al., 2023a). C-factor is an expression of the effect of a vegetation cover/soil management on soil loss compared to soil loss on conventionally tilled, continuous fallow conditions (Jeong et al., 2012). It is a ratio between 0 and 1, where 0 is a factor for a 100% effective soil cover or soil management that affect 0 soil loss, and 1 is a factor for soil loss on clean, conventionally tilled bare land (Panagos et al., 2015). Thus, the closer C-factor of a soil cover/ management type is to 0 (for instance 0.01), the more effective it is at controlling soil loss, compared to one with a C-factor close to 1 (for example 0.9). Its implication is that the former cover type or soil management practice (with C-factor 0.01) reduced soil loss by 99% compared to conventionally tilled bare land, while the latter cover type/ soil management option (with C-factor of 0.9) reduced soil loss by only 10% compared to bare land.
Cover management factors of major upland crops determined by lysimeter experiments by the Soil Conservation Laboratory of National Institute of Agriculture Science Technology (NIAST), Korea from 1977 to 2001 were 0.59 for Kimchi cabbage, 0.44 for maize, and 0.19 for soybean under conventional tillage practices (Jung et al., 2004). Therefore, among the above-mentioned crops, soybean is most effective for soil loss control. In this study, the objective was to evaluate the efficiencies of strip tilled soybean/cover crops rotation in reducing soil loss and runoff during rainfall events in the Highlands by quantifying soil loss and runoff in slope lysimeters and estimating C-factors of the growing periods. The hypothesis of the study is that cultivating soybean and cover crops in strip-tilled slope lysimeters would reduce soil loss and runoff volumes compared to conventionally tilled bare slope lysimeters.
Materials and Methods
Study site description
Three experiments were conducted in 2021, 2022 and 2023 in 2, 7 and 15% slope lysimeters at the Highland Agriculture Research Institute in Daegwallyeong, Pyeonchang-gun, Gangwon-do (37°40'48.0''N, 128°43'51.0''E). The slope lysimeters are built according to the standards described by the universal soil loss equation (USLE) of the U.S. Department of Agriculture (USDA). Each slope lysimeter has a slope simulation area of 2.8 m wide and 22.4 m long and is filled with saprolite (soil formed from chemically weathered rock) with sandy loam texture.
Initial physico-chemical characteristics of the soil before experimental set-up
A soil auger was used to collect six soil samples from each slope lysimeter at 15 cm depth. The top 1 cm of the sampled soil was slashed off to get rid of plant debris that could overestimate soil parameters. The samples were composited, mixed thoroughly and air-dried. It was sifted through a 2 mm sieve before analysis. Standard soil analysis methods described by the National Institute of Agricultural Sciences (NAAS, 2011) in Korea were followed. Particle size distribution (soil texture) was determined by the Hydrometer method. Soil pH and EC was determined at 1:5 soil: water ratio with a pH meter (Orion Versa Star, Thermo Scientific, USA) and EC meter (Orion Star A212, Thermo Scientific, USA). Total C concentrations were determined with an elemental analyser (Vario Max, Elementar, Germany). Available P was determined calorimetrically with the UV-VIS spectrophotometer (Lambda 365, Perkin Elmer, USA) at wavelength of 720 nm. Exchangeable cations were extracted with 1 N mono-ammonium acetate and measured with inductively coupled plasma (ICP, Optima 2100DV, Perkin Elmer, USA). Table 1 shows soil properties before the start of the experiments in 2021.
Table 1.
Initial soil properties before the experiments in 2021.
| Slope |
pH (1:5) |
TC1 (g kg-1) |
N % |
Av. P2O52 (mg kg-1) | Exch. cations (cmolc kg-1) |
EC3 (dS m-1) | ||
| K | Ca | Mg | ||||||
| 2% | 7.5 | 25.0 | 0.18 | 725.9 | 0.2 | 11.6 | 1.4 | 0.3 |
| 7% | 7.3 | 30.1 | 0.08 | 625.6 | 0.2 | 11.9 | 1.9 | 0.2 |
| 15% | 7.9 | 15.9 | 0.12 | 316.5 | 0.2 | 11.9 | 1.9 | 0.2 |
Experimental design and treatments
The experiments were conducted in the 2, 7 and 15% slope lysimeters in 2021, 2022 and 2023. The treatments were soybean (Glycine max L. var daepoong) in the growing season, cover crops in the fallow season and uncultivated bare land. Each treatment was applied to the three lysimeters. The cover crops were a mixture of Rye (Secale cereal L. var gokwoo) and hairy Vetch (Vicia villosa L. var H1) at a ratio of 5:1 dry weight, and they followed soybean in rotation.
Land preparation and cropping system management
Strip tillage was applied to the lysimeters with soybean/cover crops rotation. Bare land lysimeters were conventionally tilled and left bare throughout the three experimental years. Before soybean planting, the aboveground parts of previous cover crop stubbles were slashed to about 7 cm long without disturbing the soil. A tractor-mounted-seeder, was used to dispense soybean seeds and fertilizer in straight lines. The only soil disturbance occurred at the planting hills. Soybean was planted at a distance of 70 cm × 18 cm at 2 seeds per hill. NPK (8-8-9) fertilizer was applied at 712 kg ha-1, together with the seeds, according to the N recommendation of Rural Development Administration (RDA).
All three season experiments were conducted under rain-fed conditions. Weeds in the bare land was controlled with a herbicide throughout the study to prevent any vegetation growth. Soybean stubbles and residue were left on the land after harvest. The succeeding cover crops were sown through the residue with minimum disturbance. A mixture of rye and hairy vetch were seeded at 200 kg ha-1 and 40 kg ha-1 respectively. Cover crops were cut to about 7 cm long when rye was at about 50% grain filling stage and hairy vetch was flowering. Cover crop residue was left on the field.
Field monitoring and data collection
Soil loss and runoff data were collected on rainfall events. A rainfall event is one rainfall session (or many rainfall sessions with less than 6 hours stoppage time interval), which amounts to 12.7 mm or more rainfall volume (Modified Wischmeier and Smith, 1978). We measured rainfall amounts hourly, and did not consider rainfall lasting for 15 minutes and amounting to over 6.25 mm rainfall volume as a rainfall event (Ok et al., 2021). On rainfall events, runoff water and soil were collected in 300 L collection tanks installed in the water collection unit of the lysimeter. The runoff water mixed with eroded soil passed through the splitter, which collects water and soil in the ratio of 1 to 100. The splitter automatically rotates by gravitational force. Rainfall amounts were calculated with data from Atmos 41 weather station that has ZL6 cloud data logger (METER Group, USA) installed near the lysimeter. Rainfall intensity (EI30 MJ mm ha-1 hr-1) was calculated by the formula suggested by Foster et al. (1981).
Rainfall amounts and intensity received
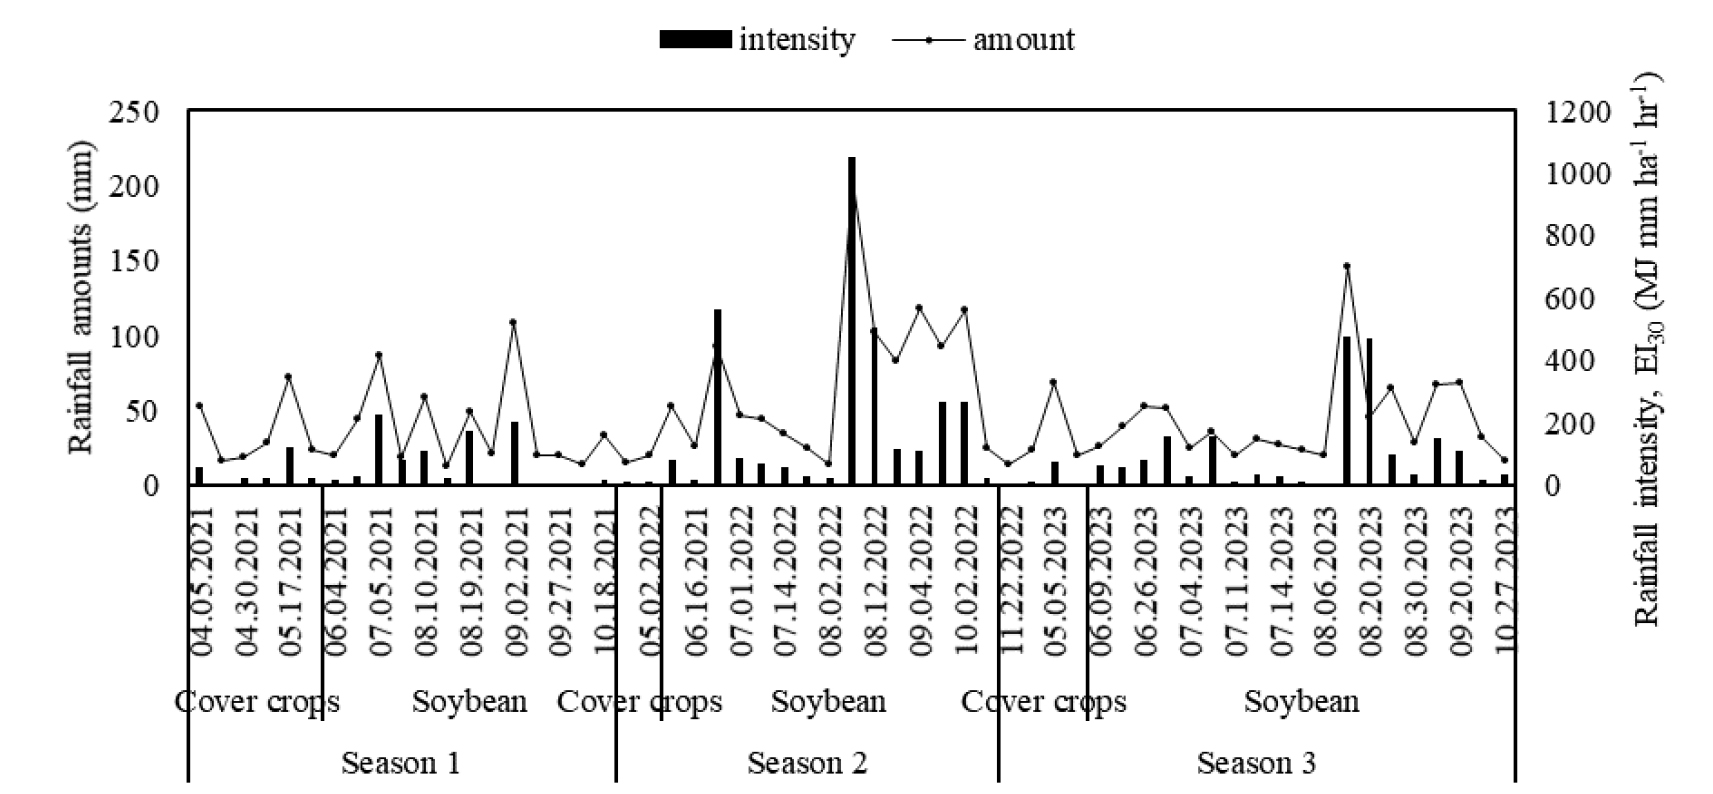
The total rainfall amounts received at the Research Station on rainfall events were 716 mm in the first growing season, 1111 mm in the second and 941 mm in the third. A growing season consisted of a cover crop growing period, followed by soybean growing period. In the first growing season, cover crops received 191 mm of rainfall while soybean received 525 mm. In the second growing season, cover crops received 35 mm of rainfall while soybean received 1076 mm. In the third growing season, cover crops received 105 mm of rainfall while soybean received 836 mm. Average rainfall intensities were 61 MJ mm ha-1 hr-1, 194 MJ mm ha-1 hr-1 and 92 MJ mm ha-1 hr-1 respectively. Fig. 1 shows the rainfall amounts and intensities received on rainfall events.
Estimating cover management factors
Cover management factors of soybean and cover crops were calculated by the following equation (adapted from NIAST, 2012).
where, Σ means summation, Aci is the soil loss from the plant/residue cover on a certain date, Ai is the soil loss under the bare soil on that same date.
Estimating the margins by which soybean and cover crops reduced total soil loss compared to bare land in the whole experimental period
The margins by which soybean or cover crops reduced soil losses, compared to bare land, was calculated as follows:
Statistical analysis
Collected data sets were subjected to regression and correlation analysis using Microsoft Excel. Datasets for the three experimental years were put together for regression analysis. Soil loss was regressed on rainfall intensity and amounts to determine the relationships between them, using data points from the three years.
Results and Discussion
Effects of soybean and cover crop cultivation and bare land, on soil loss and runoff in the three growing seasons
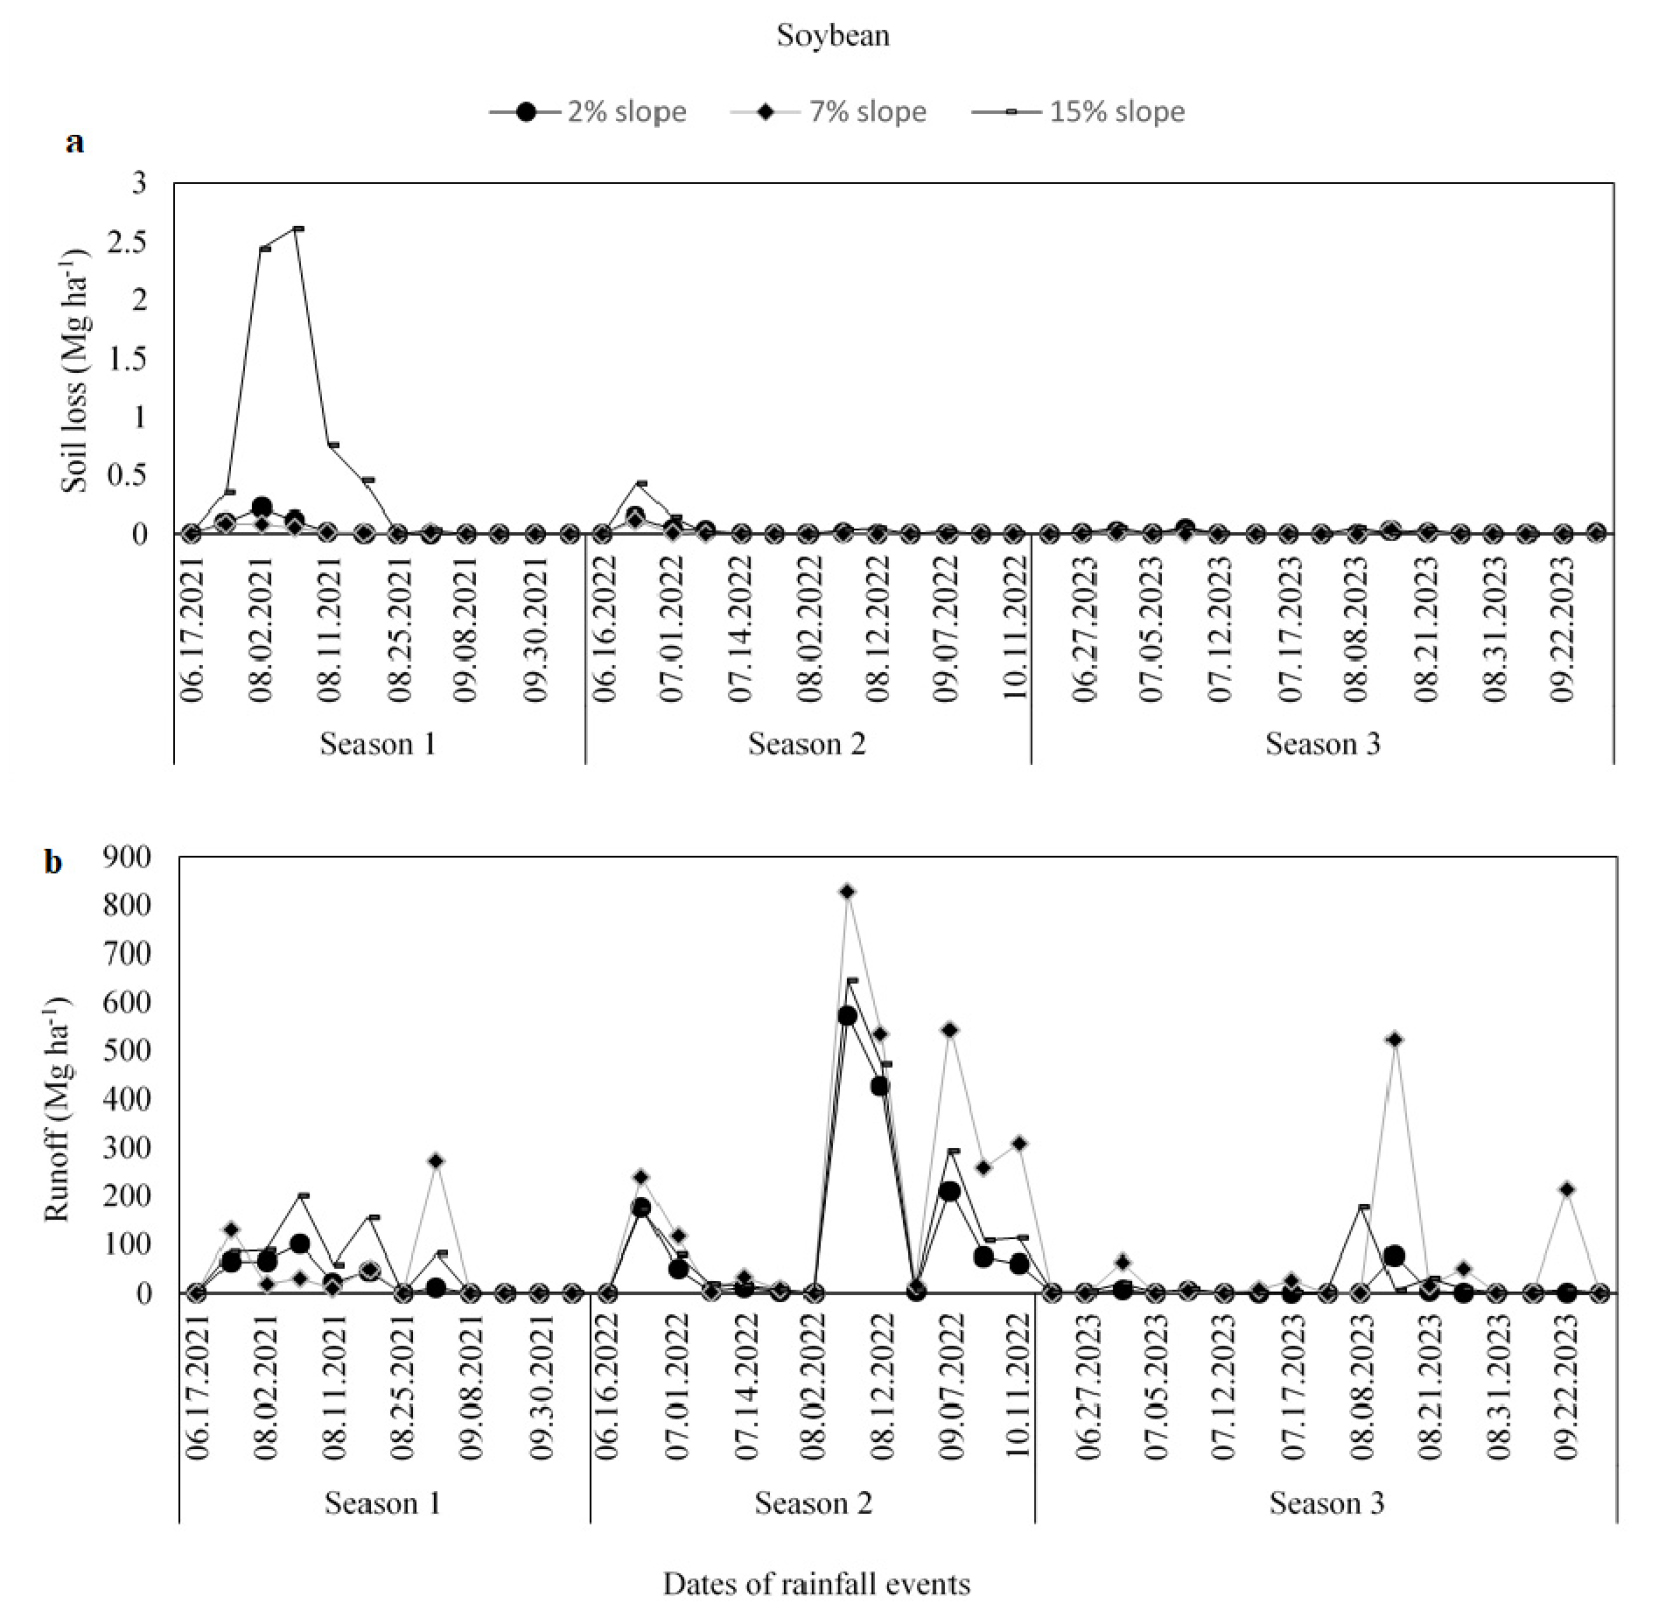
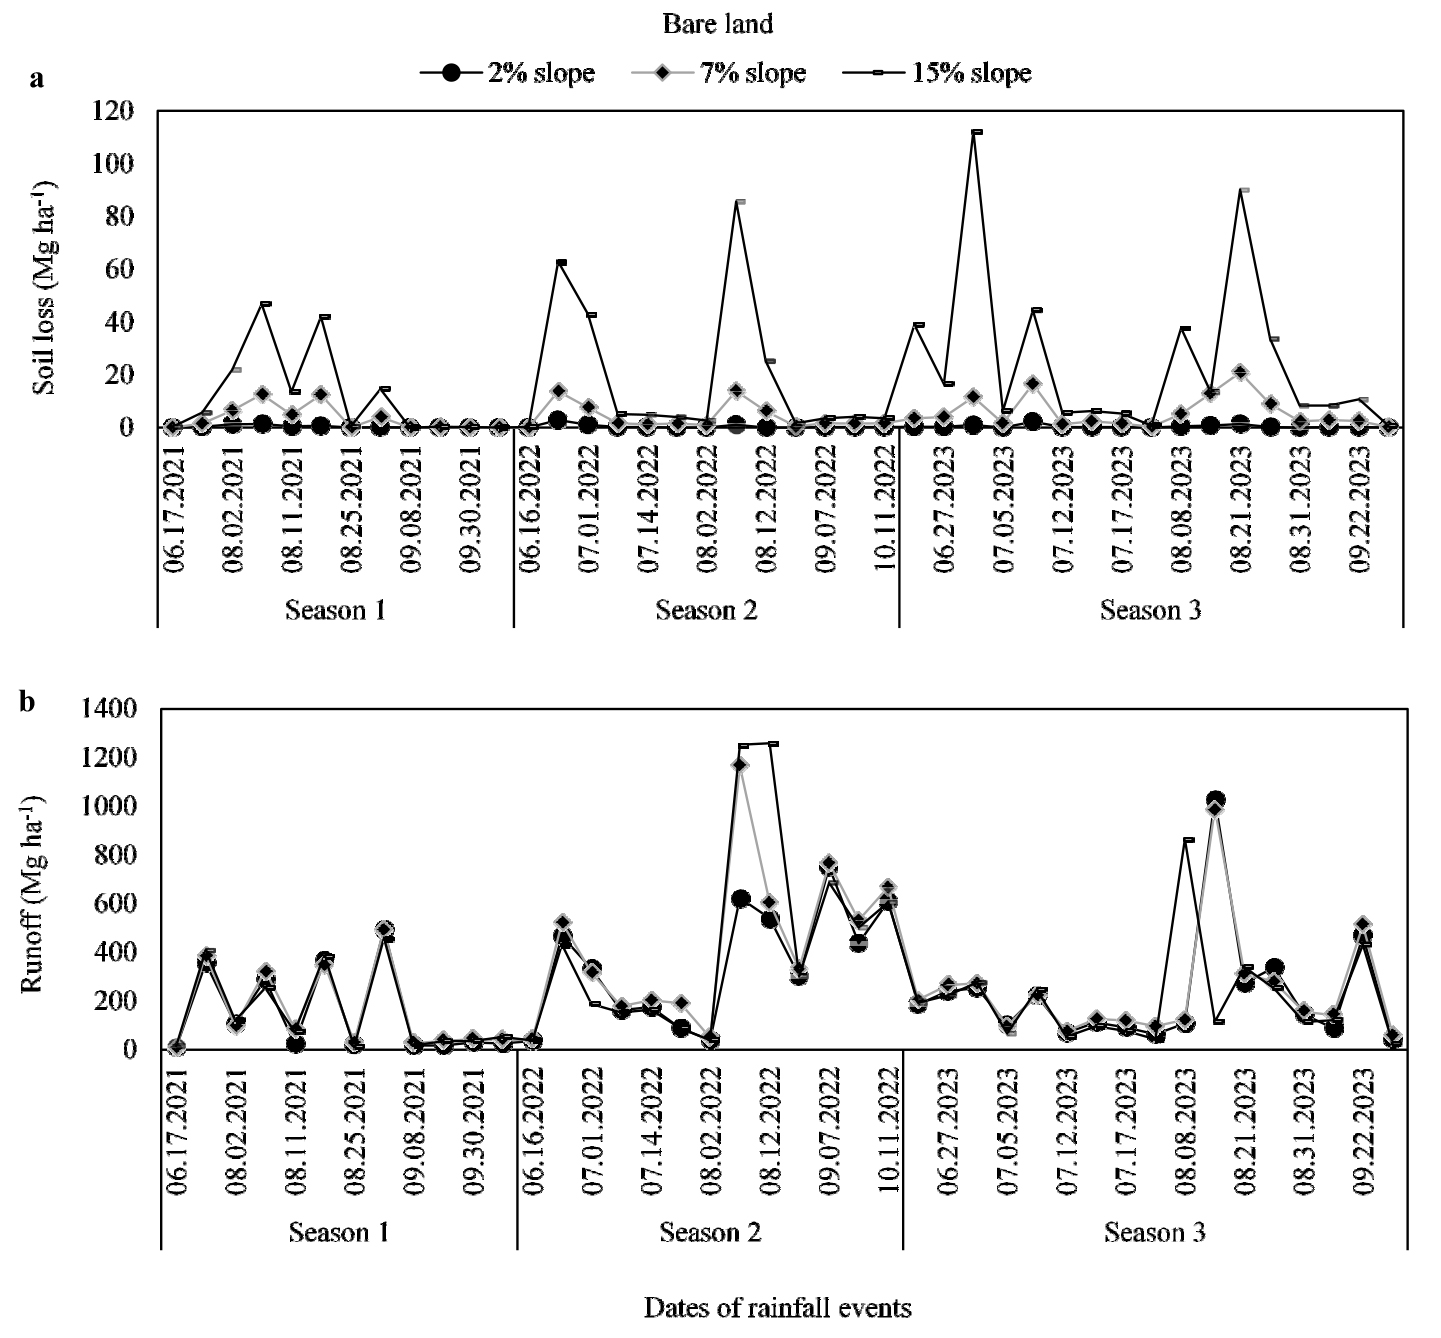
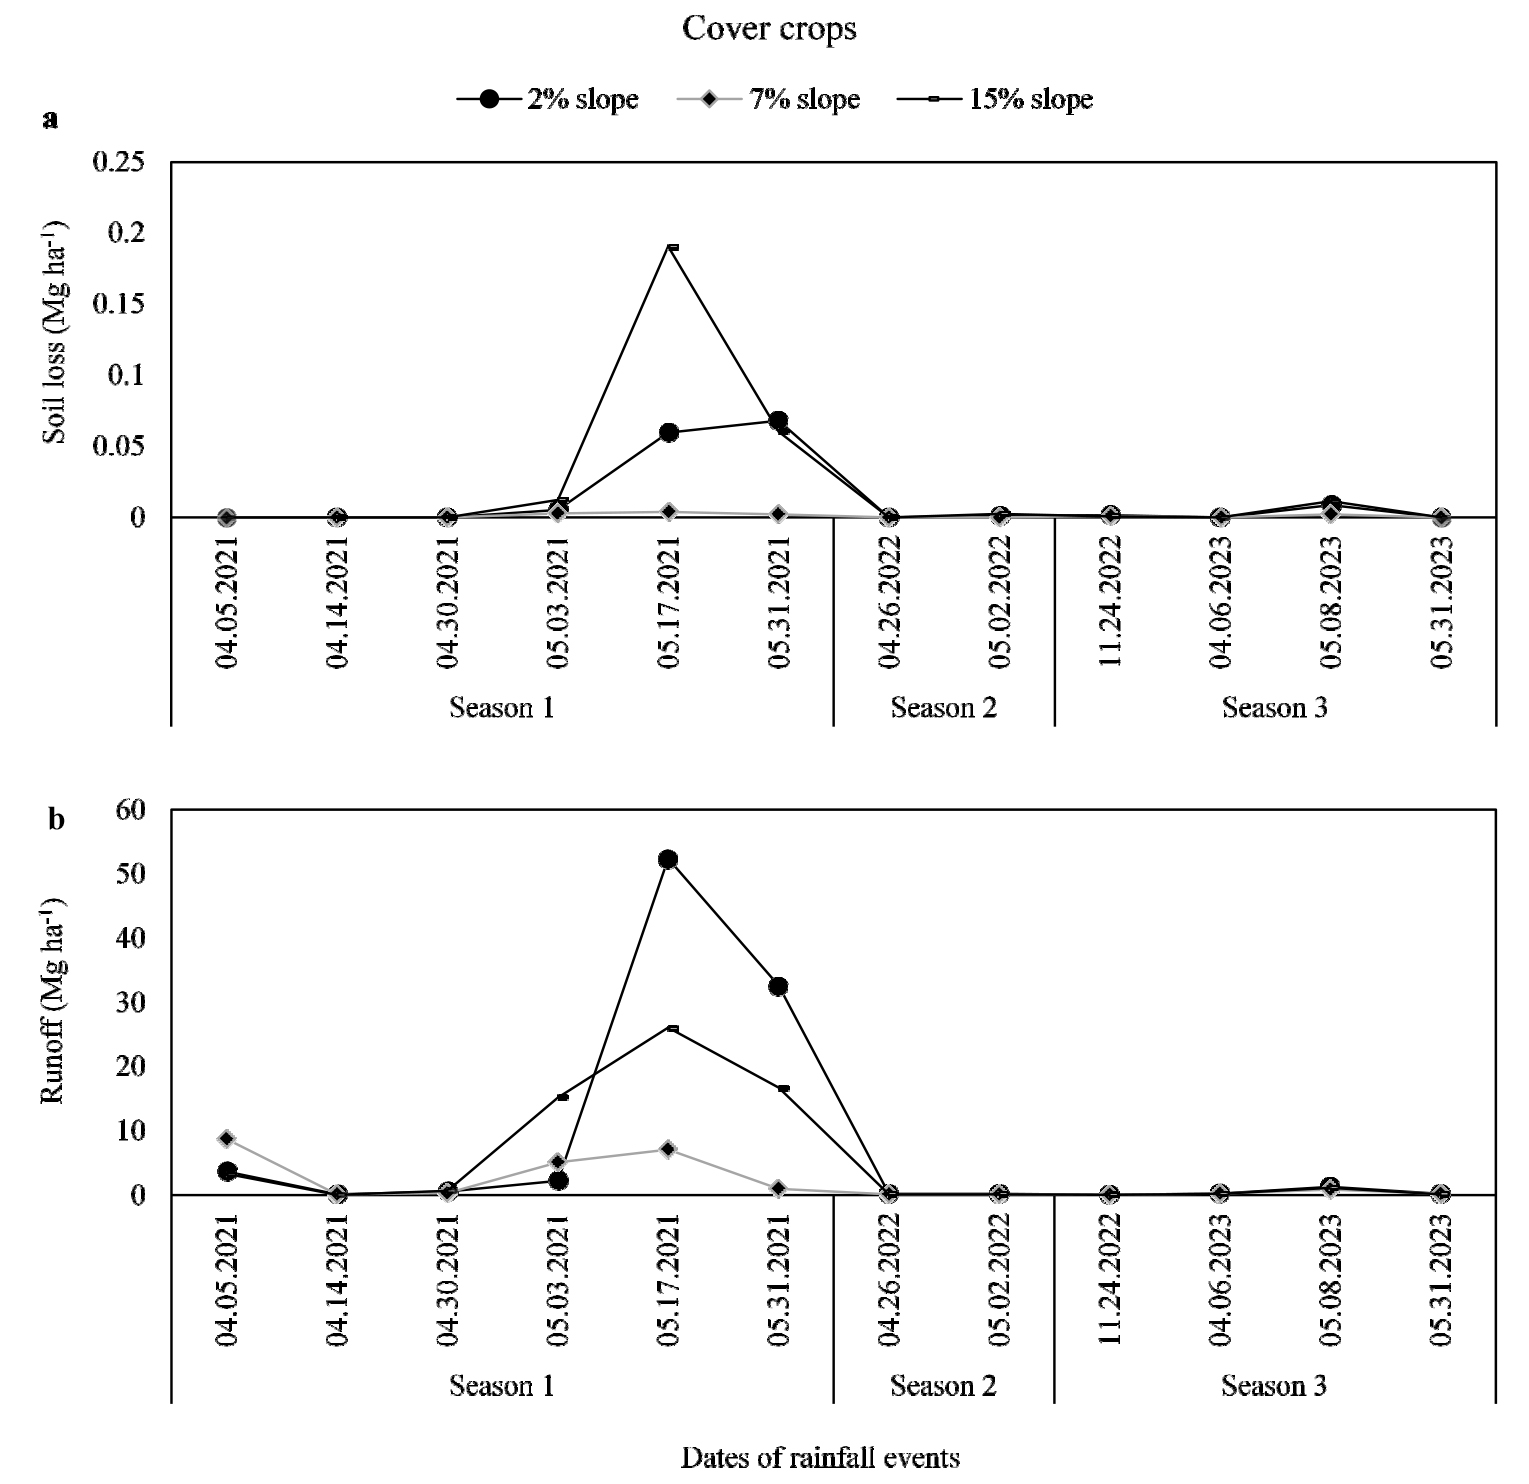
The magnitude of soil loss per rainfall event ranged from 0 to 2.8 Mg ha-1 (Fig. 2a), under soybean cultivation, and 0 to 0.19 Mg ha-1 (Fig. 5a) under cover crop cultivation. Within the same time periods, bare land lost between 0 to 112.20 Mg ha-1 soil per rainfall event during soybean growth (Fig. 4a), and 0 to 1.00 Mg ha-1 soil per rainfall event during the cover crop growth (Fig. 7a) in all three growing seasons. Total soil loss on all rainfall events in the 2, 7 and 15% slope lysimeters were 0.86, 0.48 and 7.63 Mg ha-1 under soybean cultivation, 0.14, 0.01, 0.28 Mg ha-1 under cover crop cultivation. The 2, 7 and 15 % bare land slope lysimeters lost a total of 15.87, 189.98 and 829.27 Mg ha-1 soil during the soybean growth periods in all three growing seasons and 0.31, 0.61 and 1.51 Mg ha-1 soil during the cover crop growth periods in all three growing seasons. Thus, soil losses in the bare land lysimeters, were 18, 396 and 109 times higher than losses in the 2, 7 and 15% soybean lysimeters, during the period of soybean growth, putting the three growing seasons together. Whereas cover crops reduced total soil loss by 2, 61 and 5 times in the same slope lysimeters, compared to bare land lysimeters during the period of cover crop growth. Totalling the three growing seasons, 2, 7 and 15% bare land lysimeters lost 18.04, 202.25 and 912.68 Mg ha-1 under bare land in the three growing seasons.
Higher magnitudes of soil losses in bare land compared to soybean or cover crops occurred because soil particle detachment energy and runoff velocities were not impeded by any vegetation in the bare land (Al-kaisi and Licht, 2005; Balasubramanian, 2017). Bak and Lee (2021) also observed up to 47% increase in soil loss with bare land compared to rye cover crops in the fallow season on sloped fields in the Highlands. According to soil loss estimations of ideal land cover types in Korea, soil loss on bare land could be as large as 70 times or more than soil loss in such upland cultivations in our study (Jang et al., 2015).
Higher magnitude of soil loss under soybean cultivation compared to cover crops (rye and hairy vetch) (Fig. 2 a and b; 5 a and b) was the effect of many, and relatively high intensive rainfall events experienced during the soybean phases, in the main cropping seasons, than the cover crop phases, during the fallow seasons (Fig. 1). The diverse effects of seasonal rainfall variations on the conservation effect of cover vegetation on soil loss is well documented (Fageria et al., 2005; Snapp et al., 2005; Clark, 2008).
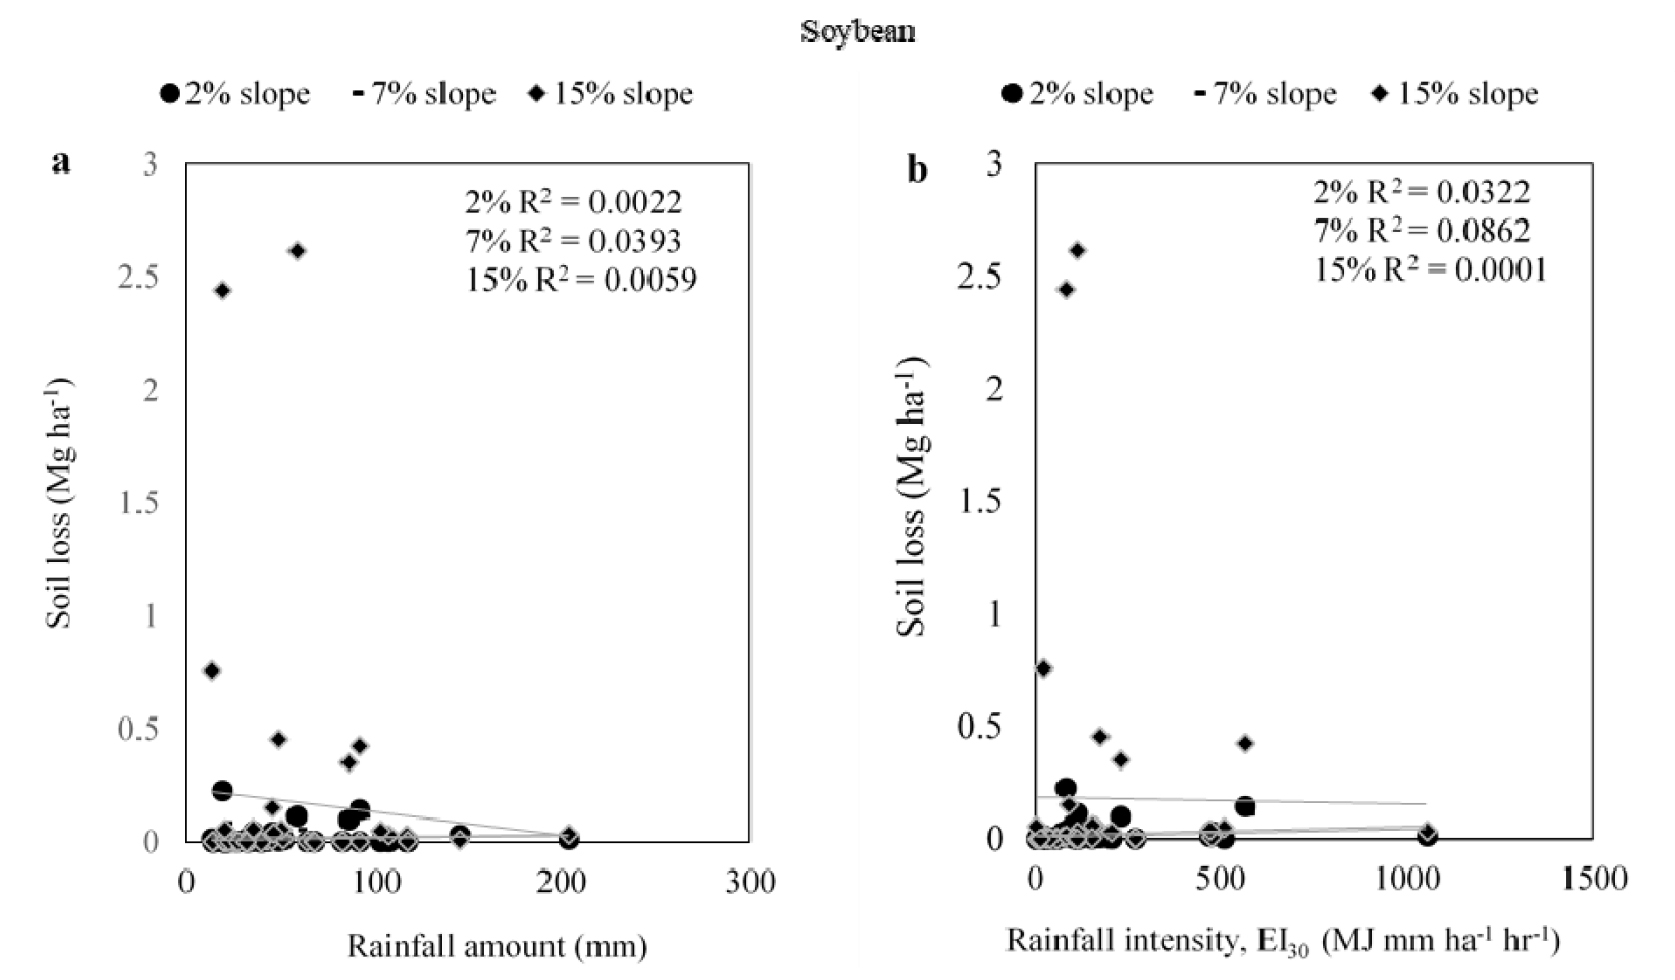
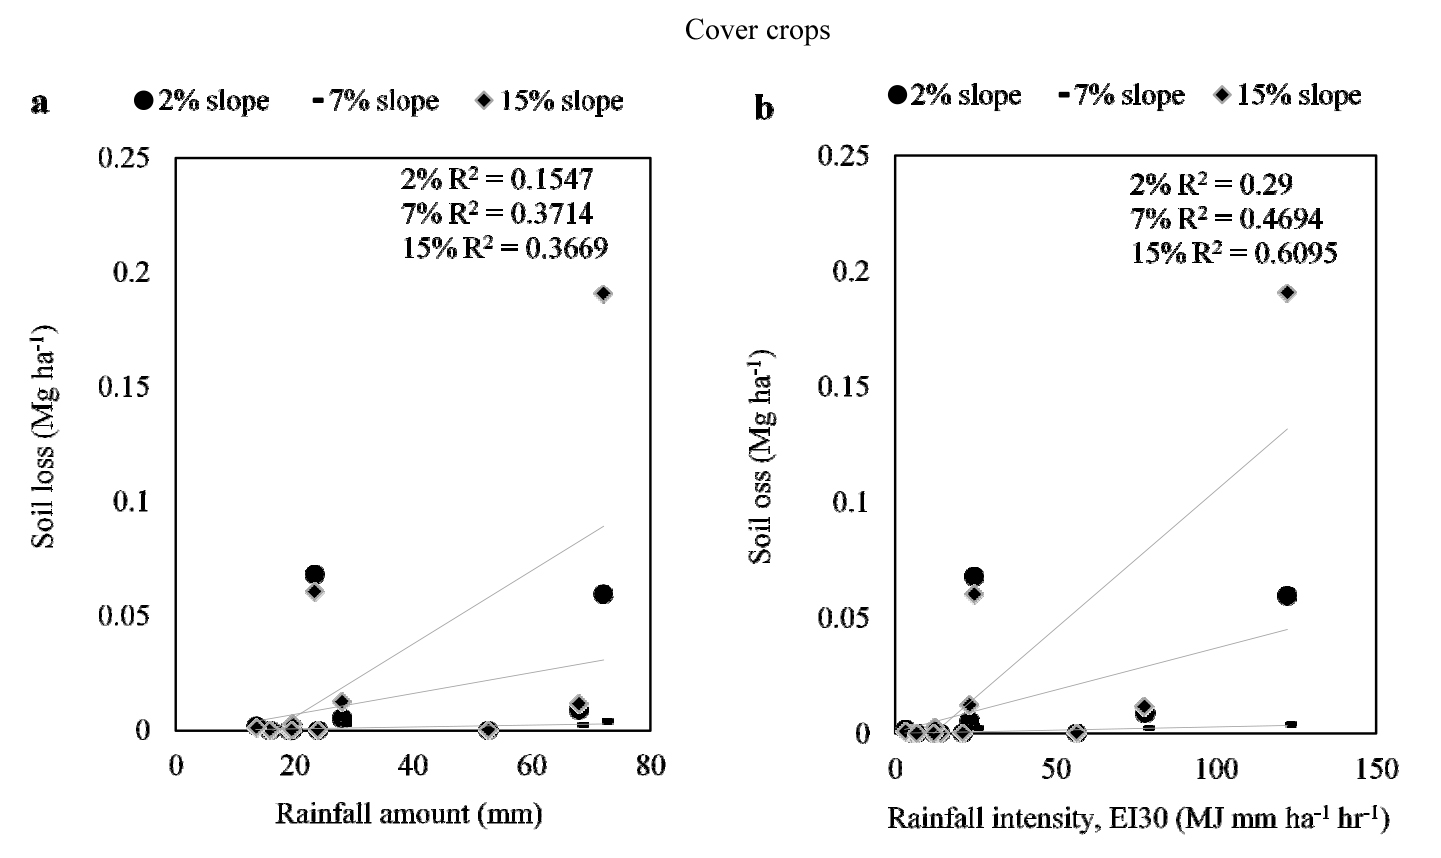
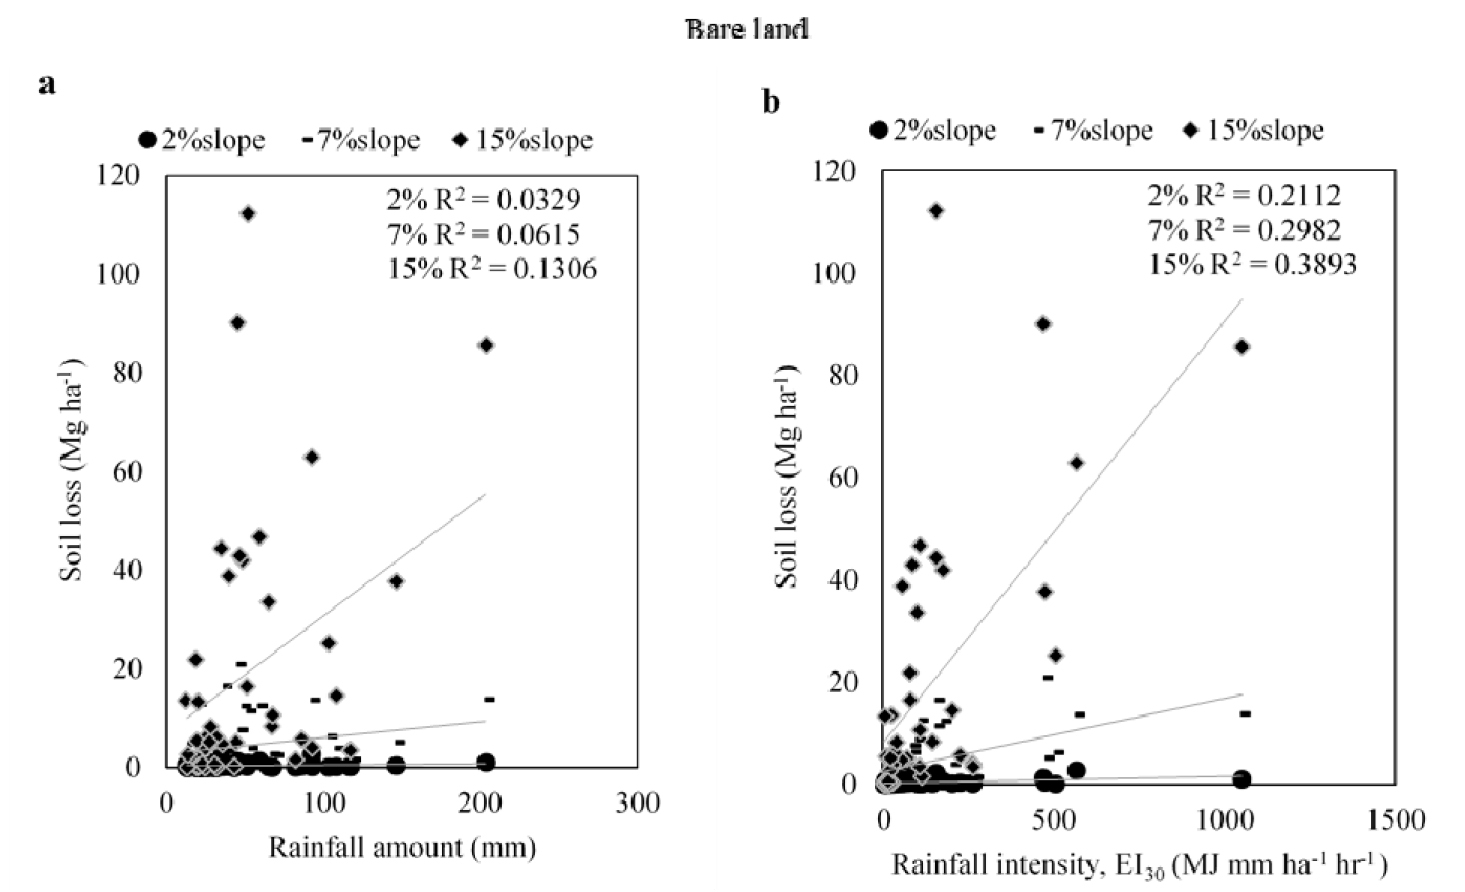
Under soybean cultivation, peak soil losses were observed at the beginning of the first and second growing seasons in all three lysimeters (Fig. 2a). However, peak runoff amounts occurring more frequently within the growing seasons in the slope lysimeters (Fig. 2b) did not correspond to peak soil losses during the same period. These discrepancies indicate that other factors (discussed below) apart from runoff volumes may have been stronger determinants of soil loss, under soybean cultivation. From Fig. 3a and b and Fig. 6a and b, it could be inferred that rainfall amounts and intensities (which are directly related to runoff volume) were also not as strong in determining soil loss in any of the slope lysimeters with soybean cultivation, as lysimeters with cover crop cultivation. The larger amounts and more intensive rainfall events received in the middle to end of soybean growing period (Fig. 1), resulted in the peak runoff volumes in all lysimeters under soybean cultivation in those periods (Fig. 2b). However, these large runoff volumes did not necessarily correspond with the largest soil losses under soybean cultivation in all lysimeters (Fig. 2a) because: (1) strip tillage applied before planting soybean had soil conservation effects, (2) the closing canopy structure of soybean during the middle to end of the soybean-growing period reduced the erosive impact of raindrops on soil surface and (3) increased surface residue from previous cover crop stubble protected the soil. Our observation suggests that, without strip tillage, soybean crops and soil surface residue, more soil losses would have occurred with the increased runoff volumes; and these are the reasons for the poor correlation (low R2 values) between soil loss and rainfall parameters under soybean cultivation . Our observation aligns with the findings of Laufer et al. (2016) which recorded 98% reduction in soil loss with strip tillage and surface residue cover compared to other tillage types in sloped sugar beet fields. Laufer et al. (2016) result was explained by increased aggregate stability against the impact of raindrops and reduced runoff velocities, which lowered sediment concentration. Contrary to review reports of Koudahe et al. (2022), that the root architecture of grass cover crops serve better soil structure improvement mechanisms and physical barrier to soil loss than leguminous ones, same reports cannot be made in our study, because the effect of soybean and rye-hairy vetch cover cops on runoff and soil loss were not assessed under same rainfall conditions and duration. Relatively fewer rainfall events and less amounts received during the cover crop growing periods (Fig. 1) caused lower runoff volumes ranging from 0.1 to 52 Mg ha-1 in the 2, 7 and 15 % slope lysimeters under cover crop cultivation (Fig. 5b). Total runoff under cover crop cultivation within the experimental period was 95, 24 and 69 Mg ha-1 in the 2, 7 and 15% slope lysimeters respectively, and peak soil losses in the first season coincided with peak runoff amounts in the same season in all the three slope lysimeters (Fig. 4). Under cover crop cultivation, there were weak positive correlations between soil loss and rainfall amounts; thus 15%, 37% and 37% of the increases in soil loss in the 2, 7 and 15% slope lysimeters respectively were determined by increases in rainfall amounts (Fig. 6a). Twenty-nine, 47 and 60% of the increases in soil loss were determined by increases in rainfall intensities in the 2, 7 and 15% slope lysimeters respectively (Fig. 6b). In the bare land, rainfall amounts were not significant determinants of soil loss in 2, 7 and 15% slope lysimeters (R2 = 3%, 6% and 13%) (Fig. 8a), however, there were weak positive relationships between soil loss and rainfall intensities (R2: 2% slope = 21%; 7% slope = 30%; 15% slope = 39%) in the bare land (Fig. 8b).
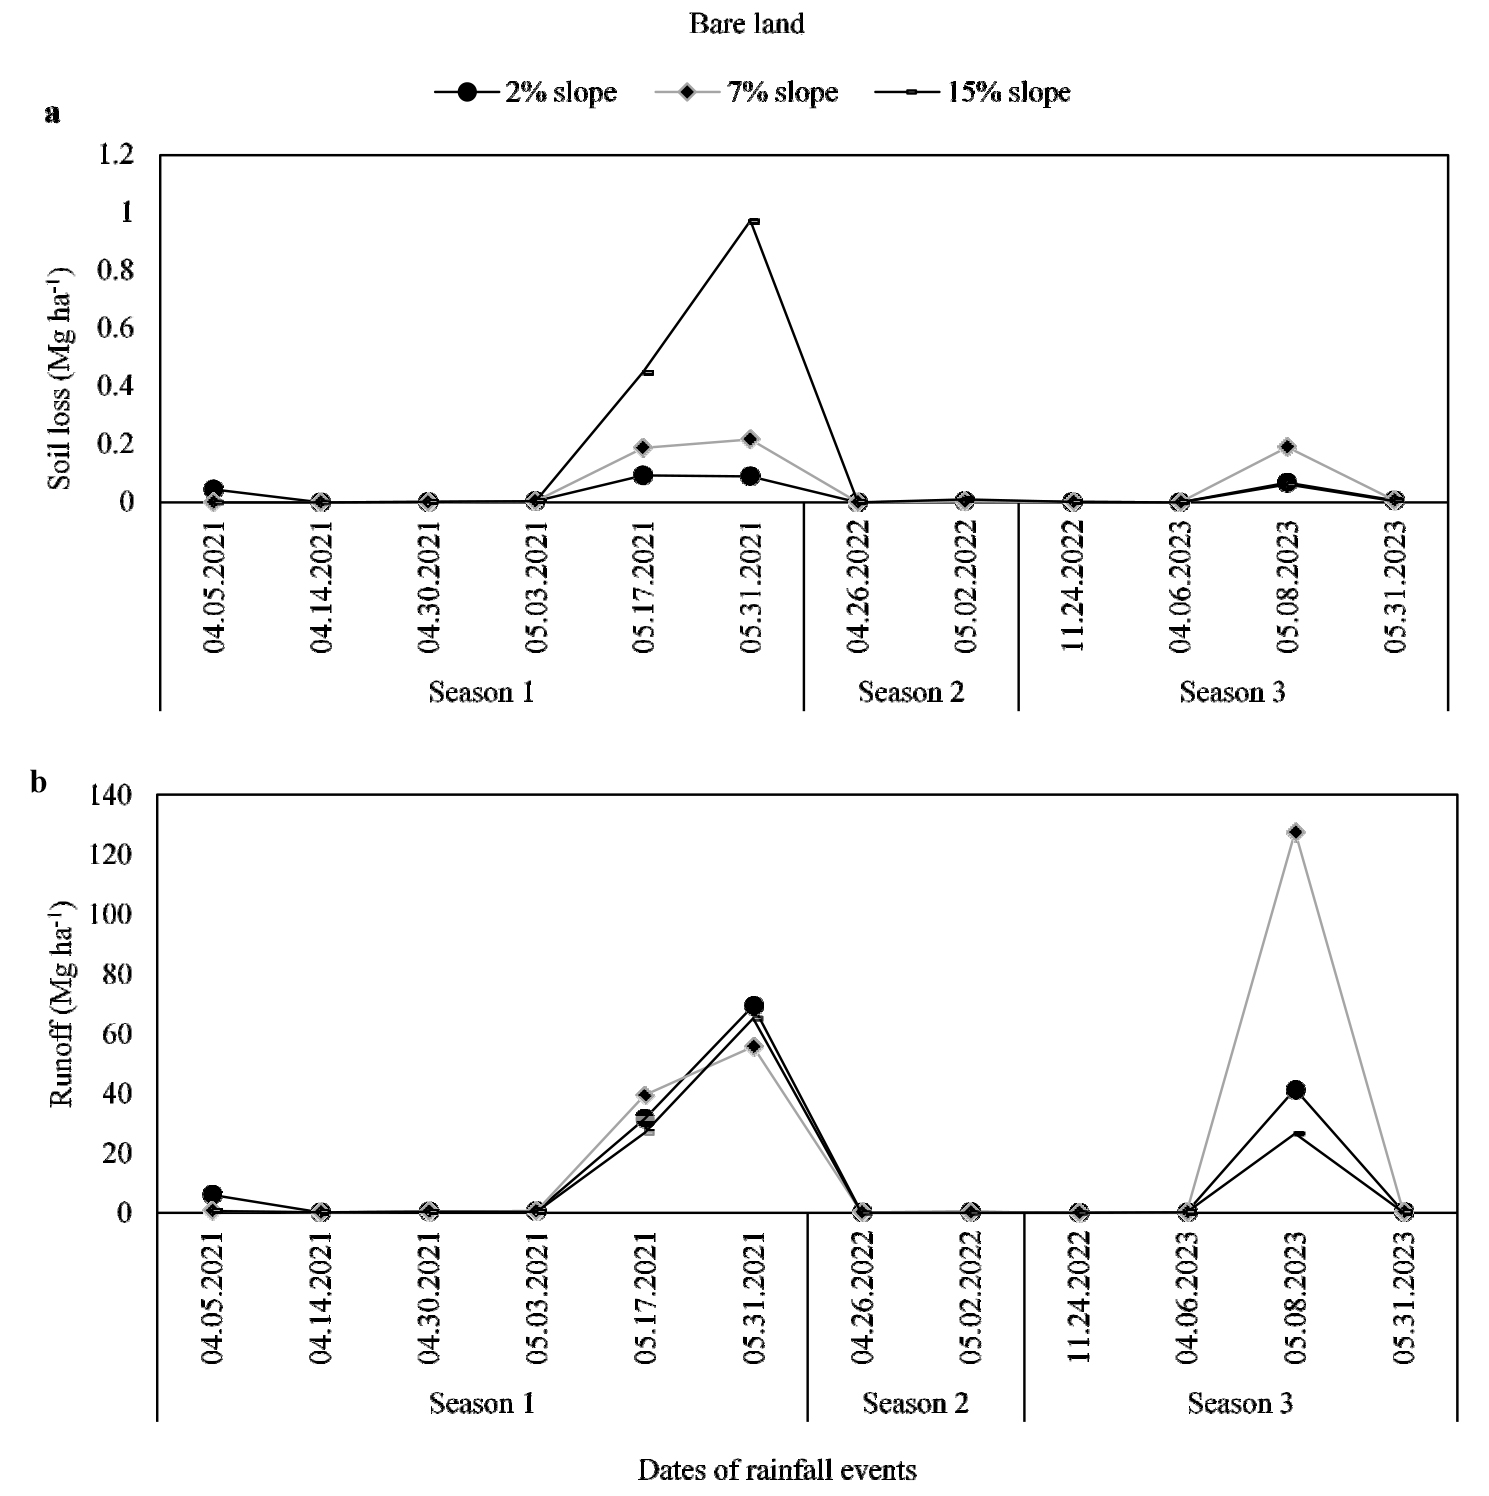
Runoff volumes in the 2, 7 and 15% slope lysimeters under soybean cultivation ranged from 0.1 to 830 Mg ha-1 (Fig. 2b), and totalled 2016, 4318, and 2894 Mg ha-1 in the three slope lysimeters respectively. Though there was more runoff in 7% slope lysimeter than the 15% slope, more soil was lost in the 15% (7.63 Mg ha-1) than the 7% (0.48 Mg ha-1) under soybean cultivation. The largest soil losses occurred in the 15% slope lysimeter under the cover crop cultivation and bare land as well, compared to their respective 2 and 7% slope lysimeters. The largest soil losses in the 15% slope lysimeters under all the vegetation types and bare land was expected, as other authors have observed same in their studies (Liu et al., 1994; Zhang et al., 2015; Wang et al., 2023). As slope gradient increases (up to 25%), the effect of gravity on mass wasting also increases (Defersha et al., 2011; Balasubramanian, 2017; Siswanto and Sule, 2019; Zheng et al., 2019). Mass wasting is the down-slope movement of sediments mainly due to the force of gravity. It influences faster removal and movement of soil sediments on steeper slopes than gentle slopes (Beek et al., 2008).
Cover management factor
In the 2% slope lysimeter, C-factors of soybean were lower than cover crops in all three growing seasons (Table 2). The C-factors were determined as follows: first growing season- soybean (0.12) < cover crops (0.57); second growing season – soybean (0.04) < cover crops (0.32); third growing season – soybean (0.02) < cover crops (0.14). A similar trend was followed in the 7% slope lysimeter. C-factors in all three growing seasons in the 7% slope lysimeter were as follows: first growing season – soybean (0.007) < cover crop (0.02); second growing season - soybean (0.002) < cover crops (0.07); third growing season – soybean (0.0007) < cover crops (0.02). In the 15% slope lysimeter, C-factors in the growing seasons were as follows: first growing season – soybean (0.05) < cover crops (0.18); second growing season – soybean (0.003) < cover crops (0.27); third growing season – soybean (0.0006) < cover crops (0.19).
Table 2.
C-factors of strip-tilled soybean and cover crops during their growing periods in the study.
C-factor indicates how a vegetation type or conservation measure affects the average annual soil loss, and allows for comparison of the effects of different management options on conservation plans (USDA, 2007). It is a ratio of soil loss in the intervention plot compared to soil loss in bare land in that same period, and receiving the same rainfall conditions. The ratio is between 0 and 1, where 0 is a factor for soil loss under a 100% effective soil cover or conservation measure and 1 is a factor for soil loss on a continuous, clean conventionally tilled bare land with no vegetation cover (Panagos et al., 2015; https://esdac.jrc.ec.europa.eu/themes/cover-management-factor).
In our study, soybean under strip tillage had lower C-factors than cover crops in all the three slope lysimeters throughout the experiment, but their C-factors will not be compared because they were not cultivated under similar rainfall conditions. However, it is important to note that soybean C-factors were lower than the 12-year record average of 0.19 from the reports by the Soil Conservation Laboratory of RDA-NIAST (Jung et al., 2004). In their studies (Jung et al., 2004), soybean was cultivated under conventional tillage practices, and without the inclusion of cover crops in the growing season. Considering the magnitudes of total soil loss under the different vegetation types, soybean reduced soil loss by up to 109 times that of bare land in the entire experimental period. Strip tillage and surface residue cover applied in our study made the difference, as soybean was cultivated under conventional tillage practices, and without cover crop rotations in the 12-year average soybean C-factor reports.
We observed slightly higher average soil coverage percentage of soybean in the 7% slope lysimeter (2% slope = 71%; 7% slope = 73.2% ; 15% slope = 67.3%) than other slopes (data not shown) throughout the study. This may have partly contributed to the relatively lowest C-factors of soybean in the 7% slope lysimeters in the first and second growing seasons.
Conclusion
This study evaluated soil losses under strip-tilled soybean/ cover crop rotation and bare land in 2, 7 and 15% slope lysimeters in the 2021, 2022 and 2023 growing seasons in the Highlands of Gangwon; and also estimated C-factors of the experimental period. Strip tillage was applied to soybean/ cover crop slope lysimeters while bare land slope lysimeters were conventionally tilled throughout the experimental years. Cover crops (mixture of rye and hairy vetch) were cultivated during the fallow period, after soybean harvest. Cover crop and soybean residue covered the soil surface in soybean/cover crop slope lysimeters throughout the study. Considering the three growing seasons, 2, 7 and 15% slope lysimeters lost a total of 0.86, 0.48 and 7.63 Mg ha-1 soil respectively during soybean growth periods, while the same lysimeters lost a total of 0.14, 0.01 and 0.28 Mg ha-1 soil under cover crop production. Soybean and cover crops reduced soil loss by up to 109 and 61 times respectively, compared to bare land during their periods of cultivation. Large amounts and highly intensive rainfalls were received during the soybean growing periods (than cover crop growing periods), which generated large volumes of runoff in the soybean growing periods. However, these runoffs did not correspond to increased soil losses in soybean lysimeters as much as soil losses in the bare land lysimeters during those periods. As a result, C-factors for soybean were lowest (0.0006 to 0.12), compared to the 12-year average of 0.19 in conventionally tilled soybean cropping systems, without cover crop rotations in the Highlands. Though soil losses increased with increasing slope gradients, C-factors of the 15% slope lysimeters under strip-tilled soybean cultivation were low (0.0006 to 0.046) among the three slope lysimeters in the entire study period. This indicates that, application of strip tillage, soil surface covering by residue and the covering of soil by soybean crops were effective at reducing soil losses. Cover crops also played soil conservation roles during the fallow phase. Hence, for effective soil conservation, the land must not be left bare.
