

Introduction
Many studies regarding switchgrass production have been conducted because it is suitable for marginal land and it requries relatively low amount of water and nutrient for its growth (Parrish and Fike, 2005; Sanderson and Adler, 2008). Even though, switch grass requires low amount of nutrient for its growth, nitrogen (N) fertilizer should be applied to soil for high biomass production. However, excessive application of N fertilizer to support switchgrass growth for bioenergy production may cause adverse environmental effects related to N dynamics such as nitrous oxide (N2O) emission and nitrate (NO3) leaching. Usually, recovery of fertilized N in soil is low in field condition. In switchgrass biomass production trials conducted in South Dakota, New York, Iowa, Oklahoma, and Virginia, USA, N recovery at all locations was below 10% (Owens et al., 2013).
Excessive amount of N in water bodies can be toxic to human beings (Dinnes et al., 2002; Foley et al., 2005). Nitrate produced from nitrification of fertilized N into soil is an inorganic form of N leached to groundwater and may cause "blue-baby" syndrome in infants under six months of age. Nitrous oxide originated from denitrification of fertilized N into soil is a greenhouse gas contributing to global warming. Even though, relatively small amount of N2O is emitted from arable soil, its global warming potential is 300 times greater than that of CO2 (Solomon et al., 2007).
Usually, N fertilizer is applied for increasing biomass of switchgrass that responds positively to N fertilization. However, excessive N fertilization could cause adverse environmental problems. Therefore, objective of this study is to determine optimum application rate of N fertilizer to increase biomass of switchgrass and to reduce adverse environmental problems. To do this, we determined 1) N use (N removal, fertilized N removal, apparent N recovery, and N use efficiency) of switchgrass; 2) NO3 leaching; 3) N2O emission during growing seasons for two years in South Dakota of the USA.
Materials and Methods
Experimental design and field management This study was conducted at near Bristol, SD USA (45°16' 8.274"N; 97°50'8.9694"W) on a Nutley-Sinai (silty clay, mixed, Chromic Hapluderts) with 2-20% slope. ‘Sunburst’ was planted on 17 May 2008. Experimental design was a randomized complete block with four replications across the landscape. Individual plot size was 0.8 ha to allow for use of conventional agricultural equipment. Three rates of N fertilizer (0, 56, and 112 kg ha-1) were applied annually beginning the year after establishment. Switchgrass was harvested once annually around a killing frost the year after establishment (2009), the second year after establishment (2010), and the third year after establishment (2011). Harvest dates were 28 Oct. 2009, 5 Nov. 2010, and 3 Nov. 2011. Biomass yield, N use of switchgrass, nitrate leaching, and nitrous oxide emission were evaluated in 2010 and 2011.
Biomass yield Yield was determined by harvesting a windrow through the center of each plot (5.5 m × 360 m) with agricultural equipment at a height of 10 to 15 cm. Biomass from each windrow was baled and weighed. Subsamples (approximately 300 g) were collected with a hay probe (1.3-1.9 cm wide × 45.7-61.0 cm depth) from the center of bales for further analyses. The subsamples were weighed, dried at 60°C for 48 h in a forced-air oven, reweighed to determine dry matter yield, and ground in preparation for N analysis. All subsamples were ground in a Wiley mill (Thomas-Wiley Mill Co., Philadelphia, PA) to pass a 1-mm screen and reground to uniformity in a Udy-cyclone impact mill (Udy Co., Ft. Collins, CO) with a 1-mm screen. Collected subsamples were stored at room temperature.
Nitrogen removal Annual nitrogen (N) removal was calculated by multiplying the biomass yield by the nitrogen mass fraction of the dry material. The annual Fertilizer N removal was calculated as the difference between the total N removal from the unfertilized treatment (0 kg ha-1) and total N removal from the fertilized treatments (56 or 112 kg ha-1).
Nitrogen-Use metrics Nitrogen use in relation to dry matter yield was determined using two different metrics: nitrogen-use efficiency (NUE) and apparent nitrogen recovery (ANR).
Nitrogen-use efficiency (mass of biomass per mass of N) for each harvest was calculated as(Zemenchick and Albercht, 2002) :
NUE = (yield at Nx − yield at N0)/mass of N applied
Where Nx = N level >0, and N0 = no N applied
Apparent N recoveries (%) for each harvest were calculated using the difference method (Crasswell and Godwin, 1984):
ANR = [(mass of N removed at Nx − mass of N removed at N0)/mass of N applied at Nx]
× 100
Where Nx = N level >0, and N removal was calculated by multiplying biomass yield times N concentration in the biomass.
Nitrate leaching Suction lysimeters were placed at a 1 m depth in crest and toe slope of each plot to remove effect of landscape position. The lysimeters were constructed of a 5.1 cm diameter PVC pipe with ceramic cup at the bottom. Soil water was come through ceramic layer into inside of vacuumed lysimerter. Water samples were collected from the lysimeters monthly during the growing season. Collected water samples were analyzed for nitrate-N by NO3 analyzer (Latchat Quick Chem Flow Injection Analysis) and cumulative amount of NO3 in leachates from each plot during the growing season was calculated. Cumulative loss of nitrogen through leaching was calculated based on leaching volumes and concentration of NO3 in leachate. Daily precipitation and evapotranspiration data from an on-site weather station was used to determine total leaching volume during growing season.
Nitrous oxide emission We used vented PVC static flux chambers (25 cm diameter x 15 cm height) (Hutchinson and Mosier, 1981) to measure GHG fluxes according to the guidance of Parkin and Venterea (Parkin and Venterea, 2010). Duplicate chambers were temporarily installed (40 min) on PVC collars at two landscape positions (crest and toe) within each plot. Sampling was scheduled for two-week intervals during the growing of the year. Sampling was discontinued during periods where installation of the chambers on the collars would have necessitated disturbance of snow cover. Each sampling session was centered on 11 a.m. and temperature data (air; soil, 5 cm depth; chamber) were collected with a thermometer for each block. Soil moisture was measured by ML3-ThetaProbe soil moisture sensor. Daily precipitation and temperature data were collected from an on-site weather station. At 20 min intervals, 10-ml chamber headspace samples were collected with a syringe via a chamber septum and added to 10-ml, nitrogen-filled serum vials. Nitrous oxide was quantified by gas chromatography (Shimadzu 14B with a CombiPal AOC-5000 autosampler, 2-ml injection loop, Porapack Q precolumns, a 1/8” stainless steel Porapack Q (80/100 mesh) column, nitrogen carrier gas, and an electron capture detector at 260°C). Calibration is routinely performed using dilutions of a certified, gas standard mix (Scotty, Plumsteadville, PA) handled in the manner of samples. Gas flux was calculated using linear regression and the average of two chambers used to represent each plot for further analysis. Cumulative annual gas flux was calculated by linear interpolation among the individual measurements.
Soil sampling A hydraulic soil probe (6.6 cm internal diameter) was used to collect soil samples at initiation of the research in May 2010 and after harvest in November 2010 and 2011. Four random cores were collected from each plot to a depth of 1 m. Each core was subdivided into depth increments of 0 to 5, 5 to 15, 15 to 30, 30 to 60, and 60 to 100 cm, after which soil from each of the four cores at each depth was composited for analysis. Surface residue was removed before sampling. Soil samples were initially sieved to pass an 8-mm screen and dried in a forced-air oven at 40°C until consistent mass was attained. Visible plant residue and roots were removed before drying. Dried soil samples were ground to pass a 2-mm screen for chemical analysis.
Chemical analysis Concentrations of total N in switchgrass biomass were predicted for all samples using near infrared reflectance spectroscopy (NIRS) (NIRS Model 5000; Foss NIRSystems, Silver Springs, MD) based on a calibration data set of 192 samples representing all harvest years (Garcia-Ciudad et al., 1993). A set of 40 samples was used for cross-validation. Calibration and validation statistics were generated using WinISI (Version 1.5) system software (Infrasoft International LLC., State College, PA). For calibration and validation samples, total N was quantified using a Vario Max CNS elemental analyzer (Elementar Instrument, Mt. Laurel, NJ). The soil pH (1:5, H2O) was measured with pH meter (starter 3000, Ohaus, USA). Organic C content was measured with Walkley and Black method (Allison, 1965). Soil nitrate was extracted with 2 M KCl solution (10 g soil with 100 ml of extract solution shook for 1 h; Keeney and Bremner, 1966). Nitrate concentration in soil extract was determined calorimetrically by brucine method (Baker, 1967).was determined by dry combustion method in a Vario Max CNS elemental analyzer. Olsen-P was determined by the method of Olsen et al. Bulk density was determined by taking intact soil cores from each from 0 to 5, 5 to 15, 15 to 30, 30 to 60, and 60 to 100 cm depths. We took the cores by hammering into the ground stainless steel cylinders 50 mm high and 50 mm in diameter (127.37-cm3 inner volume).
Statistical analysis Statistical analysis was performed using SAS version 9.2(SAS, 2008). PROC ANOVA was carried out to compare the means of the different treatments. N rate and year were considered fixed. The least significant difference was used to separate means among location and N level treatments when the appropriate F test was significant (P=0.05).
Results and Discussion
The average annual temperatures were 6.7 and 6.1°C in 2010 and 2011, respectively (Table 1). The average annual temperature in 2010 was higher than 30 years average of temperature but that in 2011 was lower. The total precipitations were 677 and 537 mm in 2010 and 2011, respectively. The total precipitation in 2010 was higher than 30 years average of total precipitation but that in 2011 was lower.
Table 1. Monthly temperature and precipitation and in 2010 and 2011.
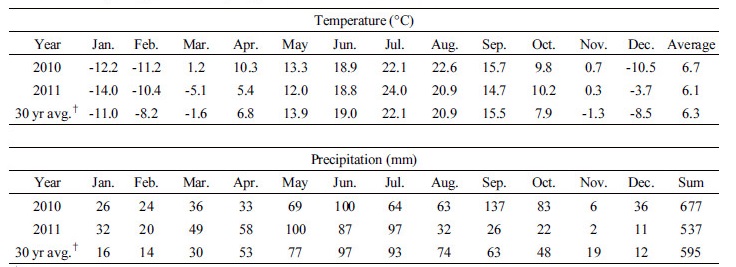
†30 yr avg.: average of monthly temperatures and precipitations for 30 years.
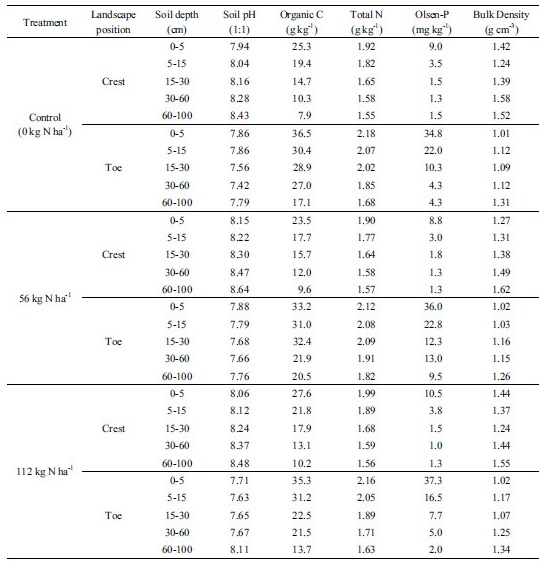
Even though different rates of N fertilizer was applied in 2009, Soil characteristics were similar throughout the study site (Table 2). Soil organic carbon, total N, and extractable P concentration increased with depth, but soil pH and bulk density increased. Especially, selected physical and chemical properties of soil were different between both landscape positions. Soil organic carbon, total N, and extractable P concentration were higher in toe than those in crest, but soil pH and bulk density were lower in toe than those in crest.
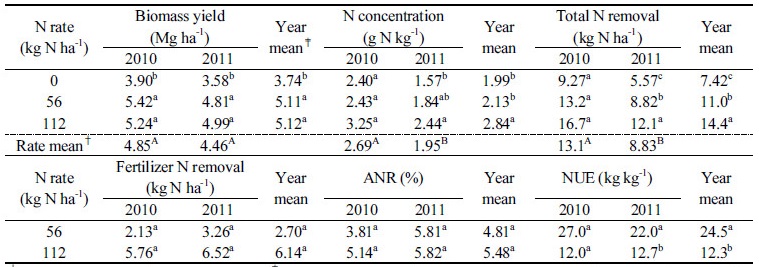
Switchgrass yield, nitrogen concentration, and nitrogen Removal Application rate of N significantly affected biomass yield (Table 3). Switchgrass yield increased with 56 kg ha-1 of N application, however, there was no further increase in biomass yield with 112 kg ha-1 of N application in both years (Table 4). Year did not significantly affected biomass yield (Table 3) and averaged biomass yields across N rates were not significantly different between both years (Table 4), even though average annual temperature and total precipitation were higher in 2010 than those in 2011 (Table 1). Owens et al. (2013) reported that biomass yield of switchgrass were not strongly related with seasonal temperature and precipitation.
Table 3. Analysis of variance (ANOVA) and probability values for biomass yield, N concentration, total N removal, fertilizer N removal, apparent N recovery (ANR), and N use efficiency (NUE).
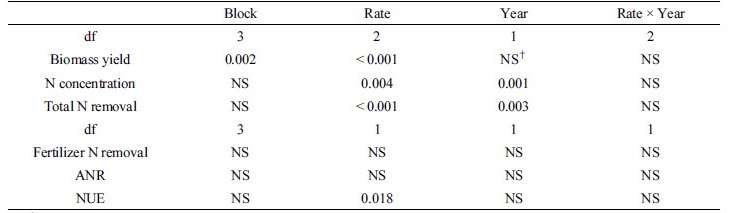
NS†: not significant.
Nitrogen rate significantly affected N concentration in biomass (Table 3). Average N concentration in biomass across years significantly increased with N rate (Table 4). Average N concentration in biomass across N rates was higher in 2010 than that in 2011. Switchgrass harvested in 2011 might not require a lot of N compared with that in 2010 because some of the N in above ground biomass of swithgrass harvested in 2010 was translocated to below ground biomass of switchgrass at harvest season. This is reason why lower N concentration in swithgrass grown in 2010 compared with that in 2011.
Nitrogen rate and year significantly affected total N removal (Table 3). Differences in total N removals with N rates and years were related with biomass yield and N concentration. Average total N removal across years significantly increased with N rate despite the fact that yield did not increased with above 56 kg N ha-1 of N rate (Table 4). This was mainly due to higher N concentration in harvested biomass at 112 kg N ha-1 of N rate. Average total N removal in 2010 was higher than that in 2011. Average N concentration across N rates was higher in 2010 than that in 2011, but biomass yields across N rates were not significantly different between both years.
Fertilizer nitrogen removal, nitrogen recovery, and nitrogen use Nitrogen rate and year did not affected fertilizer N removal (Table 3). Average fertilizer N removals were 2.70 and 6.14 kg N ha-1 at 56 and 112 kg N ha-1 of N rate, respectively (Table 4). This implied that only ca. 3 kg of N fertilizer was absorbed by biomass at 56 kg of N fertilization. This result was evident by ANR. Apparent nitrogen recoveries were 4.81 and 5.48% at 56 and 112 kg N ha-1 of N rate, respectively and not significantly different between both N rates. This was similar to the result found by Owens et al. (2013) who reported N recoveries of less than 10% with fertilization at 112 kg N ha-1 in switchgrass field trials conducted across USA. This low N recovery rate imply that more than 90% of fertilized N may be lost through N dynamics such as NH3 emission, leaching of NO3, and denitrification of N2O or some portion of fertilized N may have become a constituent of soil organic matter.
Table 4. Biomass yield, N concentration, total N removal, fertilizer N removal, apparent N recovery (ANR), and N use efficiency (NUE) affected by N fertilization in 2010 and 2011.
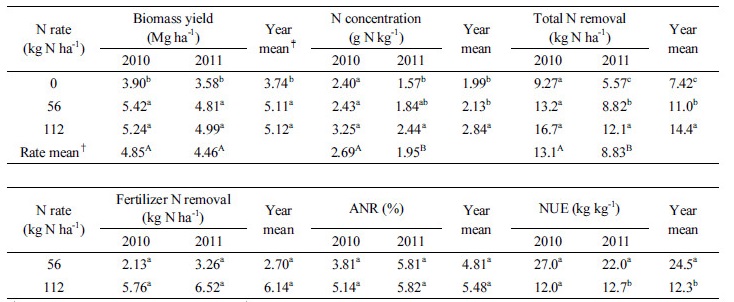
†Rate mean: mean value across N rates. ‡Year mean: mean value across years. Upper and lower case letters are for column and row comparison. Values with same letter within a column or row are not significantly different at P < 0.05.
Nitrogen rate significantly affected NUE (Table 3). Average NUEs across years were 24.5 and 12.3 kg kg-1 at 56 and 112 kg N ha-1 of N rate, respectively (Table 4). Nitrogen use efficiency decreased into half with increasing N application rate from 56 kg N ha-1to 112 kg N ha-1. This implied that excessive N application above 56 kg N ha-1 was unnecessary for switchgrass growing. Excessive N application may result in adverse environmental effects through N2O emission and leaching of NO3.
NO3 leaching Nitrogen rate significantly affected cumulative NO3 leaching (Table 5). Average cumulative NO3 leachings across landscape positions were significantly different among the N rates in 2010 and 2011 (Table 6). Average value of cumulative NO3 leaching across landscape positions slightly decreased at 56 kg N ha-1 compared with 0 kg N ha-1 in both years, even though there was no significant difference between 0 and 56 kg N ha-1. However, it significantly increased at 112 kg N ha-1; the values were 8.10 and 1.16 kg NO3-N ha-1 in 2010 and 2011, respectively. These values were similar to the value of Vadas et al. (2008) who modeled annual NO3 leaching of 6.3 and 8.1 kg N ha-1 from switchgrass field at the N fertilization rate of 112 and 168 kg N ha-1, respectively. Nitrate leaching from 112 kg Nha-1 were much lower than the N leaching from a central Illinois corn and soybean watershed in which Gentry et al. (2009) found that NO3 losses ranged from 22.7 to 59.9 kg N ha-1 year-1. Switchgrass that has deep root system could reduce more NO3 leaching compared with corn that has shallow root system (Nyakatawa et al., 2006).
Table 5. Analysis of variance (ANOVA) and probability values for cumulative NO3 leaching, cumulative N2O emission, and soil NO3-N concentration.
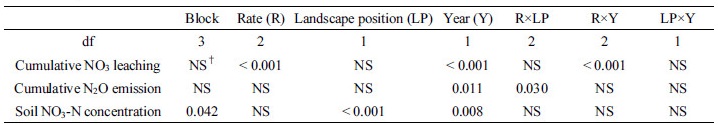
NS†: not significant.
In this study, increase in cumulative NO3 leaching with N rate was associated with N use of switchgrass in different N application rates. Average fertilizer N removals across years were 2.70 and 6.14 kg N ha-1 at the rate of 56 and 112 kg N ha-1, respectively (Table 4). These values mean that ca. 53 and 106 kg of 56 and 112 kg N fertilizer could be lost through N losses process including NO3 leaching. Therefore, excessive N application rate (above 56 kg N ha-1) might accelerate NO3 leaching. In addition, 112 kg N ha-1 N fertilization increased total N removal without a significant increase in biomass yield compared to 56 kg N ha-1 N fertilization. This result was similar to that of Behnke et al. (2012) who reported N fertilization of M. × giganteus increased fluxes of NO3 through the soil profile and increased N removal without increase in biomass production.
The highest concentrations of NO3 in leachate at 1 m depth were in early September and August in 2010 and 2011, respectively (Fig. 1). This was related to daily precipitation. There were large amount of precipitation in early September and late July in 2010 and 2011, respectively. Nitrate is readily leached to the groundwater as precipitation exceeds the water holding capacity during rainfall season (Shrestha et al., 2010). The second highest peak of NO3 leaching fluxes appeared early June after fertilization in 2010 but did not in 2011. There was large amount of precipitation end of May 2011 right after fertilization. This high rainfall might wash away N fertilizer from surface soil through run-off process. Nyakatawa et al. (2006) reported substantial amount of NO3-N could be lost through run-off process, especially in spring and summer. The N loss through run-off might partially account for difference cumulative NO3 leaching between 2010 and 2011. Total annual precipitation was much higher in 2010 than that in 2011 (Table 1). In addition, NO3 leaching can be reduced when root system of switchgrass is well established with year. Year significantly affected cumulative NO3 leaching (Table 5) and average cumulative NO3 leaching across N rates and landscape positions was higher in 2010 than that in 2011 (Table 6).
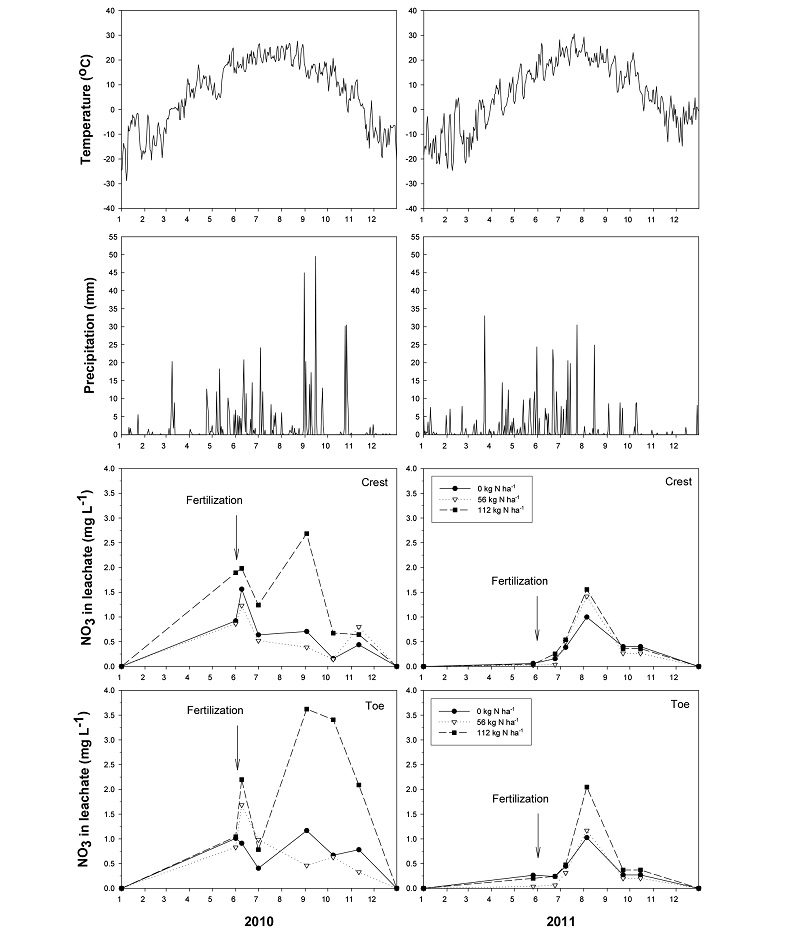
Table 6. Cumulative NO3 leaching affected by N rate and landscape position in 2010 and 2011.
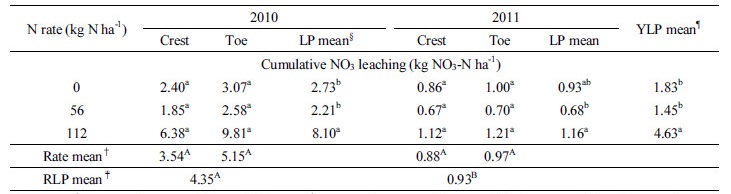
Rate mean†: mean value across N rates. RLP mean‡: mean value across N rates and landscape positions. LP mean§: mean value across landscape positions. YLP mean¶: mean value across years and landscape positions. Upper and lower case letters are for column and row comparison. Values with same letter within a column or row are not significantly different at P < 0.05.
N2O emission Nitrogen rate did not significantly affect cumulative N2O emission, but there was a significant Rate × Landscape interaction for cumulative N2O emission (Table 5). There was no significant difference of average cumulative N2O emission across years among N rates in crest, but it significantly increased at 112 kg N ha-1 in toe (Table 7). Significant increase in cumulative N2O emission in toe with N fertilization of 112 kg N ha-1 was related to N use of switchgrass in different N application rates. As mentioned above, excessive N application rate (above 56 kg N ha-1) beyond plant requirement might accelerate N2O emission. Nitrous oxide fluxes were various among the N rates in crest in 2010 and 2011 (Fig. 2). However, effect of N fertilization on N2O fluxes was more obvious in toe in 2010 and 2011. The highest N2O flux appeared right after N fertilization of 112 kg N ha-1 in toe in 2010 and 2011 rather than in crest. This might be related to soil moisture content. Soil moisture was higher in toe than those in crest (Fig. 2). Soil moisture was significantly correlated to N2O emission (r = 0.329, P < 0.1). Behnke et al. (2012) reported N2O emission was significantly related to soil moisture and temperature. Nitrous oxide emissions increased right after heavy precipitation events in field conditions (Parkin and Kapar, 2006; Baggs et al., 2003). Several studies (Behnke et al., 2012; Bouwman et al., 2002) reported significant relationship between N2O emission and temperature. In this study, soil temperature was not related to N2O emission, however. Nitrous oxide emission was related to NO3 concentration in soil surface. Concentration of NO3 in soil is one of main drivers of N2O emission (Ball et al., 1999; Castali and Smith, 1998; Seneviratne and Van Holm, 1998). Average NO3 concentration in soil surface across N rates and years was higher in toe than that in crest (Table 8). Several studies reported the importance of landscape position on N2O emission (Corre et al., 1996; Izaurralde et al., 2004; Pennock et al., 1992; Van 1993). These studies reported that topography significantly affected N2O emission and the N2O emissions was greater in toe than in crest position.
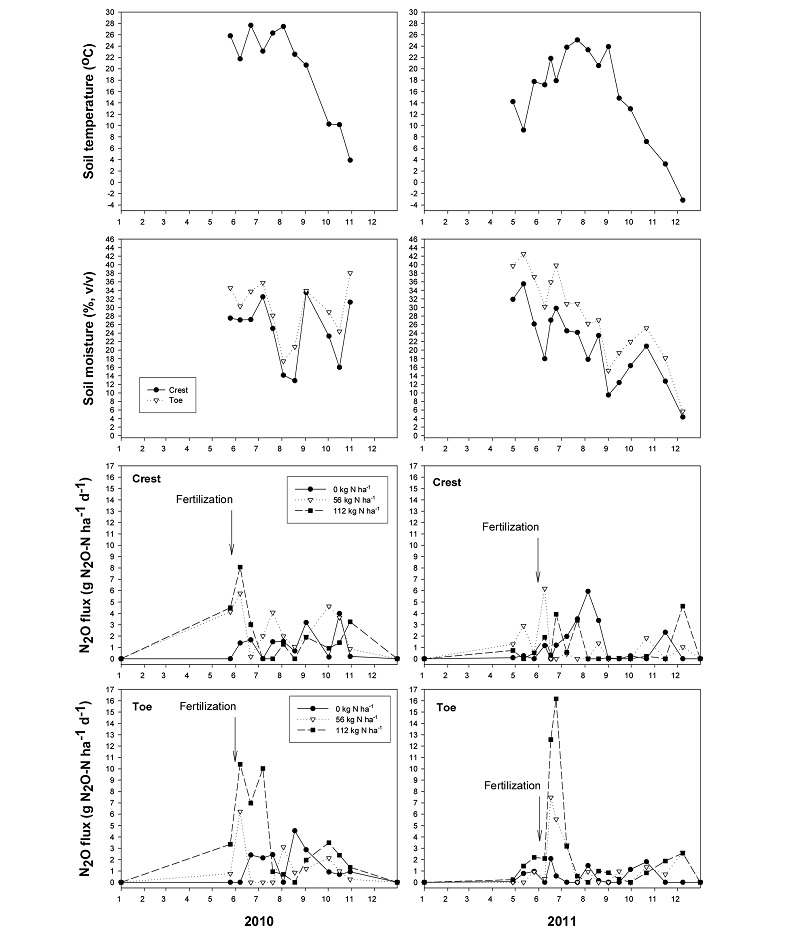
Year significantly affect cumulative N2O emission (Table 5). Average cumulative N2O emission across N rates and landscape positions was higher in 2010 than that in 2011 (Table 7). This might be due to NO3 concentration in surface soil. Average NO3 concentration in surface soil across N rates and landscape positions was higher in 2010 than that in 2011 (Table 8).
Table 7. Cumulative N2O emission affected by N rate and landscape position in 2010 and 2011.
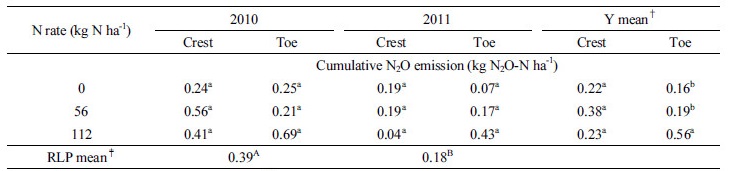
Y mean†: mean value across years. RLP mean‡: mean value across N rates and landscape positions. Upper and lower case letters are for column and row comparison. Values with same letter within a column or row are not significantly different at P < 0.05.
Table 8. Nitrate (NO3-) concentrations in surface soil (0-5 cm) affected by N rate and landscape position in 2010 and 2011.
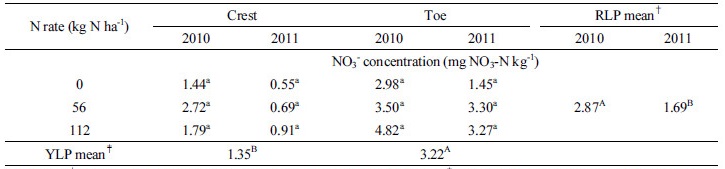
RLP mean†: mean value across N rates and landscape positions. YLP mean‡: mean value across N rates and years. Upper and lower case letters are for column and row comparison. Values with same letter within a column or row are not significantly different at P < 0.05.
Conclusions
Based on the results in this study, total N removal significantly increased with N rate despite the fact that yield did not increased with above 56 kg N ha-1 of N rate. Nitrogen use efficiency decreased into half with increasing N rate from 56 to 112 kg N ha-1. NO3 leaching and N2O emission were related to N use of switchgrass. Excessive N application rate (above 56 kg N ha-1) beyond plant requirement could accelerate NO3 leaching and N2O emission in switchgrass field. Therefore, 56 kg N ha-1 might be optimum N application rate in reducing economic waste on N fertilizer and adverse environmental impacts.
