

Introduction
Materials and Methods
>Experimental site and facility description
Experimental design and rice cultivation
Environmental conditions during rice growing period
Determination of WUE by analyzing rice plant δ13C
Calculation of WUE, and vapor pressure deficit
Statistical analysis
Results and Discussion
Conclusions
Introduction
Elevated carbon dioxide (CO2) concentrations (e[CO2]) and/or air temperatures (eTair) affect the growth of rice (Oryza sativa L.), a staple food for more than half of the world’s population (Bin Rahman and Zhang, 2023). Many studies have reported that e[CO2] boosts rice growth and yield via so-called “CO2 fertilization” effect and eTair cancel out this effect to some degree via warming-induced floral sterility (Kumar et al., 2023; Qin et al., 2023; Wang et al., 2025). The C acquisition, and thus biomass production, of plants is coupled with resource use efficiency, including water use efficiency (WUE), which is defined as the C gain (carboxylation rate) per unit of water lost (stomatal conductance) during photosynthesis (Farquhar et al., 1989; Su and Shangguan, 2020). WUE is a crucial factor for agricultural water management under climate change (Lee et al., 2024; Park et al., 2024). It is well documented that e[CO2] induces stomatal closure in C3 plants, including rice, thereby increasing WUE (e.g., Kimball, 2016; Wang et al., 2025). Warming may also increase both the carboxylation rate, by stimulating Rubisco enzyme activity, and stomatal conductance, by increasing transpiration to cool down the plant, although it depends on the temperature regime (Zhang et al., 2022). However, the gas exchanges and stomatal conductance have primarily been measured at the single leaf or canopy level, and thus, these measurements represent only the transient status when the measurement was conducted (Wang et al., 2025; Zhang et al., 2022), not the whole growth period (Su and Shangguan, 2020).
In this regard, the C isotope ratio (13C/12C, expressed as δ13C) of rice tissues collected at harvest can be used as a proxy of the gas exchange response of rice to e[CO2] and warming for the entire rice growing period, as any changes in carboxylation rates and stomatal conductance during rice growth cause variations in C isotope discrimination (Δ13C) and, thus, leave a distinct δ13C signature (Farquhar et al., 1989; Su and Shangguan, 2020). For rice plants, the accuracy of WUE assessments using the δ13C has been verified by Impa et al. (2005). Therefore, the δ13C of rice plants at harvest may provide time-integrated information on changes in WUE due to e[CO2] and warming, as they influence the carboxylation rate and stomatal conductance. However, relevant studies are lacking and thus our understanding of the changes in WUE of rice plants exposed to e[CO2] and warming for entire growing period is limited.
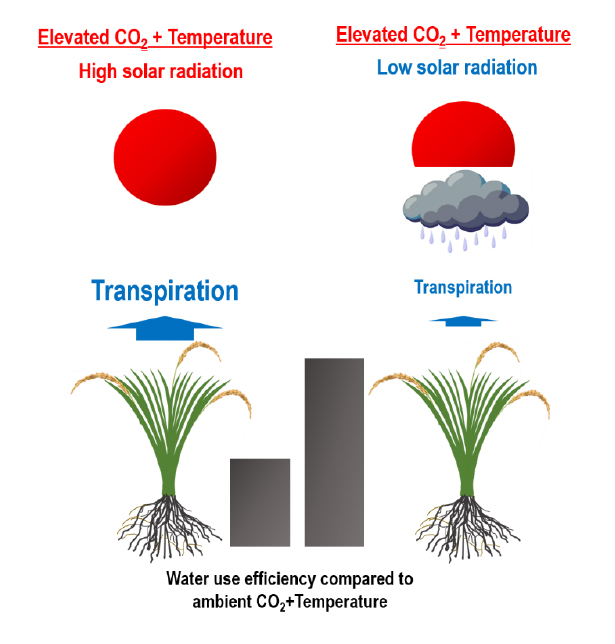
Co-elevated [CO2] and Tair accompany changes in weather conditions, such as changes in precipitation, sunshine hours, and solar radiation, due to frequent extreme weather events, which dramatically affect plant growth (Choi et al., 2013; Seneviratne et al., 2021). In particular, vapor pressure deficit (VPD) affects transpiration of plants and thus WUE, and VPD is highly dependent on relative humidity (RH) and Tair. However, it is unclear how these changes affect the variations in WUE caused by e[CO2] and eTair. Despite the importance of WUE with regard to rice growth, there are no studies examining the interannual variations in WUE of rice plants under e[CO2] and eTair with varying weather conditions. To fill this knowledge gap, this study investigated the effects of co-elevated CO2 and Tair on WUE of rice plants under varying weather conditions for two years (2019 and 2020). We hypothesized that the increment of e[CO2]-driven WUE may differ with years under changing weather conditions; specifically, increases in RH associated with decreased sunshine hours and solar radiation will increase WUE via decreased VPD, considering the theoretical interrelationship between VPD and RH.
Materials and Methods
Experimental site and facility description
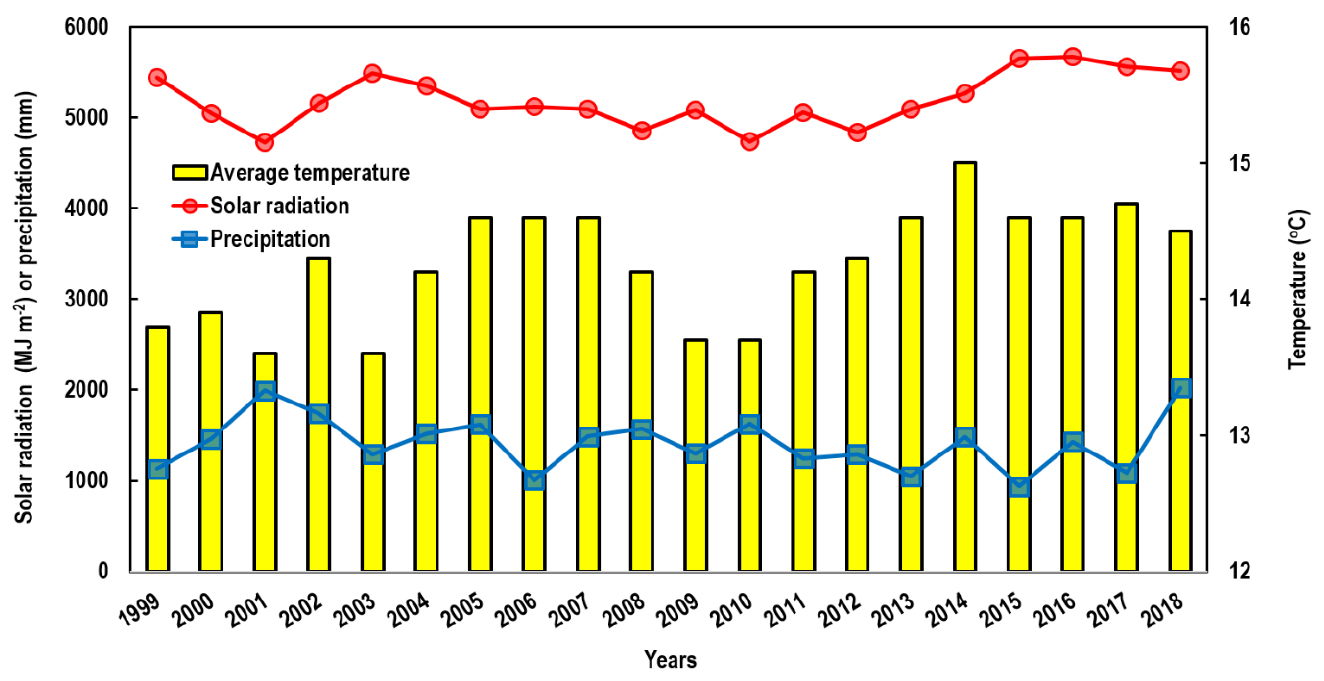
This study was conducted in the experimental rice paddy at Chonnam National University (126°53′ E, 35°10′N, alt. 33 m), Gwangju, South Korea for paddy for two years (2019 and 2020). This area has a temperate climate with an annual mean Tair of 14.2°C over the past two decades (1999 - 2018) before the experiments, and the annual precipitation was about 1386 mm, with more than 60% of rainfall occurring from June to August (monsoon season). During the same period, annual solar radiation, precipitation, and mean Tair ranged from 4723 to 5670 MJ m-2, 937 to 2027 mm, and 13.6 to 15.0°C, respectively (KMA, 2021), showing high interannual variability (Fig. 1).
Rice plants (subsp. Japonica, cv. Dongjinbyeo) were grown, with or without CO2 fumigation, in natural sunlit temperature gradient chambers (TGCs) constructed on the experimental field. More detailed descriptions of the TGCs are provided in our previous studies (Kim et al., 2011; Nam et al., 2013; Baek et al., 2024). Briefly, the TGCs (2.4 m in width × 24 m in length × 2.0 m in height for each TGC) consisted of six independent chambers. Among these chambers, three TGCs were utilized for ambient [CO2] (a[CO2]) and the others for e[CO2], of which [CO2] was controlled by fumigating CO2 from a tank into the ambient air. The difference along the longitudinal direction of the chambers from the ambient air inlet (0 m, ambient Tair (aTair)) to the air outlet (24 m) as set at 3°C with natural diurnal fluctuations, using natural warming due to incident solar radiation or an electronic heater when solar radiation alone was not enough.
Experimental design and rice cultivation
A split-plot experimental design was used for pot (26 cm in diameter and 45 cm in depth) experiments, with two [CO2] levels (a[CO2] and e[CO2]) as whole-plot treatments (main treatment) and two Tair levels (aTair and eTair) as split-plot treatments (sub-treatment). Therefore, four [CO2]-Tair combinations were tested with triplication.
In March 2019, loam soils (approximately 1000 kg) were collected from the paddy field around the TGCs, and gravel and visible rice residue were removed. The soils were stored until the experiment. In May, soils (12 kg on a dry basis, see Table 1 for more detailed information on the soil) were packed into each pot and waterlogged to allow the development of anaerobic paddy soil environment. Ten days later, three 30-day-old rice seedlings were transplanted into each pot. Three pots were assigned to each [CO2]-Tair treatment, resulting in a total of 36 pots in the experiment (3 pots × 4 treatments × 3 replications). In each TGC, the three-pot sets were inserted to a 35 cm depth of the in-situ TGC soils, adjacent (50 cm) to the air inlet (aTair) and at an 18 m distance (eTair) from the inlet to create an approximate 2°C difference. Seedlings of the same rice type were transplanted into the rest of each TGCs’ area and surroundings outside of the TGCs, with a hill spacing of 15 cm and a row spacing of 30 cm, to create canopy conditions.
Table 1
Selected properties of soil used.
| Variables1 | Values | |
|
Particle size distribution (%) | Sand | 35.2 (0.5) |
| Silt | 41.5 (0.4) | |
| Clay | 23.3 (0.3) | |
| Texture | Loam | |
| pHwater | 5.58 (0.12) | |
| Total N (g kg-1) | 1.27 (0.04) | |
| NH4+ (mg N kg-1) | 30.9 (3.5) | |
| NO3- (mg N kg-1) | 24.6 (5.7) | |
| Total C (g kg-1) | 13.4 (0.2) | |
| Available P (mg P2O5 kg-1) | 4.4 (0.5) | |
| CEC (cmolc kg-1) | 10.3 (1.1) | |
1Particle size distribution with pipette method; Texture as USDA classification; pHwater with a pH meter at a 1-to-5 (soil-to-water) ratio; total N and C using a combustion method; NH4+ and NO3- with Kjeldhal distillation method after extracting with 2 M KCl at 1-to-5 (soil-to-extractant) ratio; available P with Bray #1 method; CEC with NH4OAc method.
Fertilizer application was split three times: the basal fertilizer (5.5 g N m-2 as urea, 2.0 g P m-2 as fused phosphate, and 3.9 g K m-2 as KCl) was applied 0 days after transplantation (DAT), the first additional application (3.3 g N m-2 as urea) at the tillering stage (14 DAT), and the second additional application (2.2 g N m-2 as urea) at the panicle initiation stage (48 DAT). The pots were waterlogged to a water depth of 3 - 5 cm throughout the growing season except for a 7-day summer drainage in the middle of July. All other agronomic practices, including weed control and irrigation, conformed to local farmers’ practices until harvest. Rice cultivation experiments were repeated in the same manner using the pots in the next year.
Environmental conditions during rice growing period
During the rice-growing experimental period, June - September, of each year, the mean [CO2] of the a[CO2] treatment was 410 ppmv in 2019 and 414 ppmv in 2020, and those of the e[CO2] treatments were 652 and 695 ppmv, respectively. The daily mean Tair in aTair and eTair were 25.9 and 27.9°C in 2019, and 25.6 and 27.5°C in 2020, respectively. The daily fluctuations of [CO2] and Tair are provided in Fig. 2. The cumulative sunshine hours and solar radiation during the same period were 675.3 hrs and 2079 MJ m-2, respectively, in 2019 and 589.4 hrs and 1929 MJ m-2, respectively, in 2020 (Fig. 2a) (KMA, 2021). More specifically, the solar radiation in July and August, the period coinciding with the active vegetative and reproductive growth stages, was much lower in 2020 (394 and 502 MJ m-2, respectively) than in 2019 (505 and 550 MJ m-2, respectively) due to a longer rainy monsoon period in 2020. However, during the grain-filling stages, in September, the solar radiation was higher in 2020 (441 MJ m-2) than in 2019 (417 MJ m-2) (Fig. 2a). RH also differed between years; the mean RH during the rice growing period was 81.4% in 2019 and 86.0% in 2020 (Fig. 2b).
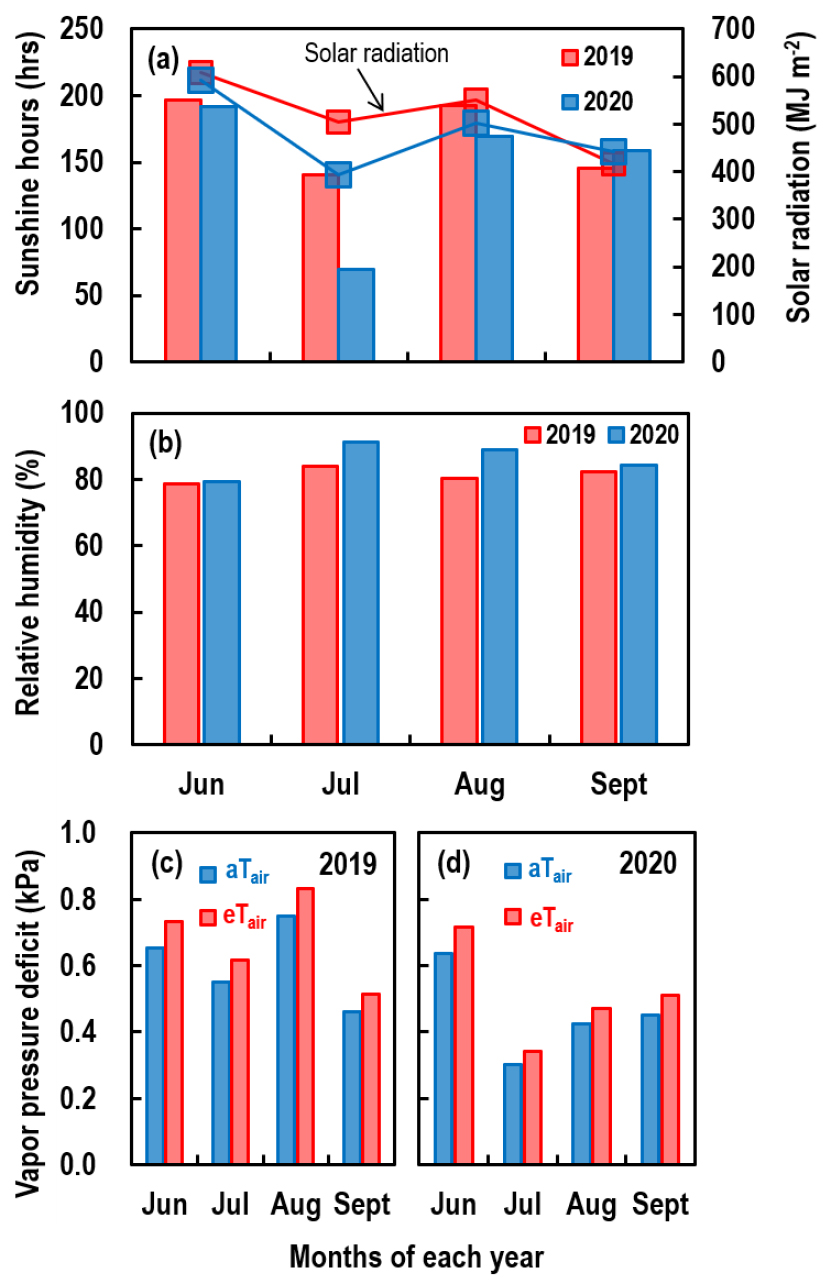
Fig. 2
Weather conditions during the rice growing season in 2019 and 2020: (a) sunshine hours (bars) and solar radiation (lines), (b) relative humidity, and (c and d) the vapor pressure deficit (VPD) under ambient (aTair) and elevated (eTair) temperature conditions in (c) 2019 and (d) 2020. The VPD was calculated using equations 5 and 6.
Determination of WUE by analyzing rice plant δ13C
On 114 DAT in both years, the above-ground plant parts were harvested, and the soils were excavated intact. All visible root tissues were collected from the soils by washing the excavated contents on a 2 mm sieve. Plant samples were separated into grain, straw (including green and dead leaves, leaf sheath, and rootstocks), and roots. Plant samples were washed with running water to remove soil particles and dried to a constant weight in ovens at 60°C. The plant samples were cut into < 1 cm pieces and homogenized. A portion (2 - 5 g, depending on the sample size) of the plant sample was ground to a fine powder in a ball mill (MM200, Retsch GmbH, Germany) and used for chemical analysis.
The δ13C of plant samples was determined using a stable isotope ratio mass spectrometer linked to an elemental analyzer (Integra 2, Sercon Ltd, UK). Carbon isotope compositions were calculated as
where R is the 13C/12C ratio and the standard was the Vienna Pee Dee Belemnite (VPDB) standard. The precision and reproducibility of the δ13C measurements—checked with an internal reference material, corn tissue (-12.3 ± 0.1‰ for δ13C) calibrated against NIST SRM 8542 (sucrose, -10.5‰)—were better than 0.2 and 0.1‰, respectively.
The δ13C of the whole rice plant was calculated using an isotope mixing model:
where Croot, Cstraw, Cgrain, and Cwhole are the C contents of the roots, straw, grain, and whole rice plant, respectively, and δ13Croot, δ13Cstraw, δ13Cgrain, and δ13Cwhole are their corresponding δ13C values.
Calculation of WUE, and vapor pressure deficit
In this study, we calculated an intrinsic WUE, the ratio (AN/gH2O) of the net photosynthetic assimilation rate (AN) to stomatal conductance of water vapor (gH2O) during photosynthesis using the equation (Kwak et al., 2016)
where 1.6 is the ratio of gH2O relative to the stomatal conductance of CO2 (gCO2), according to Fick’s law (Flexas et al., 2013); Ca and Ci are the mean [CO2] of each TGC and the intercellular [CO2], respectively; and Ci was calculated using the relationship between Δ13C and Ci/Ca (Farquhar et al., 1989):
where δ13Cair and δ13Cplant are the δ13C of atmospheric CO2 (air in chambers) and the rice plants, respectively. The δ13Cair values were computed using an isotope mixing model with two sources; the tank CO2 (the δ13C was -37.8 ± 0.4‰) (Baek et al., 2011) and the CO2 of each TGC. The values were -13.2 ± 0.3‰ and -21.7 ± 0.6‰ in 2019 and -13.7 ± 0.3‰ and -22.9 ± 1.1‰ in 2020, for the a[CO2] and e[CO2] chambers, respectively. α (normally -4.4‰) and β (normally -27‰) are the C isotope discrimination factors against 13C for the diffusion of CO2 through stomata and for carboxylation by Rubisco enzymes, respectively. Although isotope discrimination during CO2 dissolution (diffusion in the liquid phase) and (photo) respiration may also affect Δ13C, these types of discrimination are small within a single series of studies, and the simplified equation shown above is widely used (O’Leary, 1993). The equation indicates that an increase in Ci/Ca, either due to increased stomatal conductance (CO2 supply) or decreased carboxylation (CO2 consumption), results in a greater Δ13C, leading to a more negative δ13C and vice versa.
To interpret WUE in relation to transpiration in the rice plants, the VPD during the rice growing period was calculated using Tair and RH (Wang et al., 2004):
where SVP is the saturated vapor pressure, calculated as
The mean VPDs for the rice growing period were 0.60 and 0.67 kPa for aTair and eTair, respectively, in 2019 (Fig. 2c) and decreased to 0.45 and 0.51 kPa, respectively, in 2020 (Fig. 2d).
Statistical analysis
The homogeneity of variance and normality of all datasets were tested using Levene’s and Kolmogorov-Smirnov tests, respectively. No data transformations were needed. Analyses of variance (ANOVAs) were performed using the general linear model procedure for year × [CO2] × Tair in IBM SPSS Statistics 27 (IBM Corp., Armonk, New York, USA). When significant effects were found in the ANOVA, the means were separated using Duncan’s multiple-range test. A significance level of α = 0.05 was used for inferring significance in all statistical analyses.
Results and Discussion
The δ13C of rice plant was lowered by e[CO2] (P < 0.001) in both years, as 13C-depleted CO2 (-21.7 ± 0.6‰ in 2019 and -22.9 ± 1.1‰ in 2020) was used for fumigation, but eTair did not affect δ13C values (Table 2). The δ13C of plant tissues reflects both the δ13C of the CO2 in the ambient air and C isotope discrimination associated with stomatal conductance and carboxylation rate during photosynthesis (Farquhar et al., 1989). Therefore, fumigation with 13C-depleted CO2 lowered the δ13C of the air’s CO2, resulting in significantly lower δ13C in the rice grown under e[CO2] (Cheng et al., 2010; Tokida et al., 2011). The δ13C was higher in 2020 than in 2019 (P < 0.001) by 0.1 - 2.3‰, depending on the rice compartment and [CO2]-Tair treatment (Table 2).
Due to the interrelationship of δ13C with Δ13C and Ci/Ca (Equation 4), statistical analysis results for Δ13C were similar to those for δ13C (Table 2). Decreased Δ13C (and thus Ci/Ca) and increased WUE (Table 2) under e[CO2] obviously reflect e[CO2]-induced stomatal closure (Shimono et al., 2010; Zhang et al., 2022; Ancín et al., 2024). Though eTair did not affect the WUE of rice plants, e[CO2] consistently increased WUE by > 80% in both years, regardless of the rice compartment or Tair, resulting in increased WUE under the e[CO2]-eTair treatment conditions (Fig. 3 and Table 2). Under any given [CO2] and Tair combination, the WUE of rice plants was consistently 10 - 34% higher in 2020 than in 2019 across the rice compartments (Table 3).
Table 2
δ13C, Δ13C (‰), and WUE of rice plants under different elevated [CO2] and air temperature (Tair) conditions.
| Code | δ13C (‰) | Δ13C (‰) | WUE (µmol CO2 mmol-1 H2O) | |||||||||
| Whole | Root | Straw | Grain | Whole | Root | Straw | Grain | Whole | Root | Straw | Grain | |
| Year 2019 | ||||||||||||
| a[CO2]-aTair | -28.2 (0.1) | -29.6 (0.1) | -28.3 (0.1) | -27.5 (0.1) | 15.5 (0.1) | 16.9 (0.1) | 15.5 (0.1) | 14.7 (0.2) | 130.6 (1.2) | 114.3 (0.7) | 130.5 (1.6) |
139.2 (1.7) |
| a[CO2]-eTair | -27.4 (0.1) | -28.4 (0.2) | -27.5 (0.1) | -26.6 (0.2) | 14.6 (0.1) | 15.6 (0.2) | 14.7 (0.1) | 13.8 (0.2) | 140.1 (1.7) | 129.3 (2.4) | 140.0 (1.5) |
149.7 (1.9) |
| e[CO2]-aTair | -35.0 (0.2) | -35.8 (0.4) | -35.5 (0.1) | -34.2 (0.2) | 13.8 (0.2) | 14.6 (0.4) | 14.3 (0.2) | 12.9 (0.2) | 237.6 (3.8) | 223.8 (6.8) | 228.5 (2.8) |
254.1 (3.9) |
| e[CO2]-eTair | -35.7 (0.3) | -36.1 (0.4) | -35.8 (0.3) | -34.7 (0.6) | 14.5 (0.4) | 14.9 (0.4) | 14.6 (0.3) | 13.5 (0.6) | 225.4 (6.4) | 217.8 (7.0) | 223.5 (6.0) | 243.7 (11.2) |
| Year 2020 | ||||||||||||
| a[CO2]-aTair | -26.8 (0.2) | -27.3 (0.1) | -27.4 (0.2) | -25.7 (0.2) | 13.4 (0.2) | 14.0 (0.1) | 14.1 (0.2) | 12.3 (0.2) | 155.2 (2.0) | 148.6 (1.4) | 147.5 (1.8) |
168.4 (2.1) |
| a[CO2]-eTair | -26.3 (0.2) | -26.8 (0.2) | -26.8 (0.2) | -24.8 (0.3) | 13.0 (0.2) | 13.4 (0.2) | 13.5 (0.2) | 11.4 (0.3) | 160.8 (2.3) | 155.3 (1.9) | 154.4 (2.2) |
179.0 (3.5) |
| e[CO2]-aTair | -34.6 (0.4) | -35.4 (0.5) | -35.4 (0.4) | -33.9 (0.3) | 12.1 (0.4) | 11.4 (0.5) | 13.0 (0.4) | 11.4 (0.3) | 286.4 (7.7) | 300.5 (9.7) | 270.0 (8.4) |
299.6 (6.3) |
| e[CO2]-eTair | -34.8 (0.2) | -35.3 (0.2) | -35.3 (0.2) | -33.6 (0.2) | 12.3 (0.2) | 11.8 (0.2) | 12.9 (0.2) | 11.1 (0.2) | 282.6 (3.5) | 291.9 (4.3) | 271.4 (3.5) |
305.5 (3.3) |
| Effects1 | Probability > F | |||||||||||
| Y | <0.001 | <0.001 | <0.001 | <0.001 | <0.001 | <0.001 | <0.001 | <0.001 | <0.001 | <0.001 | <0.001 | <0.001 |
| C | <0.001 | <0.001 | <0.001 | <0.001 | <0.001 | <0.001 | <0.001 | 0.002 | <0.001 | <0.001 | <0.001 | <0.001 |
| T | 0.519 | 0.187 | 0.073 | 0.088 | 0.507 | 0.181 | 0.086 | 0.085 | 0.932 | 0.639 | 0.296 | 0.275 |
| Y × C | 0.095 | 0.932 | 0.220 | 0.011 | 0.849 | 0.140 | 0.414 | 0.239 | <0.001 | <0.001 | <0.001 | 0.004 |
| Y × T | 0.881 | 0.317 | 0.834 | 0.328 | 0.849 | 0.328 | 0.961 | 0.301 | 0.702 | 0.473 | 0.747 | 0.275 |
| C × T | 0.006 | 0.004 | 0.026 | 0.026 | 0.005 | 0.006 | 0.028 | 0.026 | 0.019 | 0.026 | 0.109 | 0.100 |
| Y × C × T | 0.260 | 0.449 | 0.352 | 0.292 | 0.226 | 0.449 | 0.470 | 0.301 | 0.316 | 0.699 | 0.456 | 0.290 |
Table 3
Interannual changes in water use efficiency (WUE) for each CO2 concentration ([CO2]) and air temperature (Tair) conditions.
| Rice part | % difference of WUE in 2020 relative to those in 2019 under different [CO2] and Tair conditions1 | |||
| a[CO2]-aTair | a[CO2]-eTair | e[CO2]-aTair | e[CO2]-eTair | |
| Whole | 18.8*2 | 14.8* | 20.6* | 25.4* |
| Roots | 30.0* | 20.1* | 34.3* | 34.1* |
| Straw | 13.0* | 10.3* | 18.1* | 21.5* |
| Grains | 21.0* | 19.6* | 17.9* | 25.4* |
Although the responses of WUE to either e[CO2], eTair, or both did not differ between years, the higher WUE in 2020 (P < 0.001) (Fig. 3) suggests that rice under lower solar radiation utilized water more efficiently by reducing transpiration. During the active rice growing season in July and August, the VPD was lower in 2020 than in 2019 (Fig. 2c and 2d). In addition, the increment of WUE in response to e[CO2] was higher in 2020 than in 2019 (P < 0.001). It has been reported that transpiration decreases with lower VPD, resulting in increased WUE (Massmann et al., 2019; Grossiord et al., 2020; Liu et al., 2022). Considering the theoretical interrelationship between VPD and RH, which is also linked to sunshine hours and solar radiation (Equations 5 and 6), an increased RH (as expected under decreased sunshine hours and solar radiation) might increase WUE via decreased VPD. Therefore, the changes in WUE (Fig. 3) suggest that decreases in solar radiation may improve the WUE of rice. Our results demonstrate that weather conditions (e.g., solar radiation during rice growth) critically affect the direction and magnitude of changes in WUE under elevated [CO2] regardless of Tair conditions.
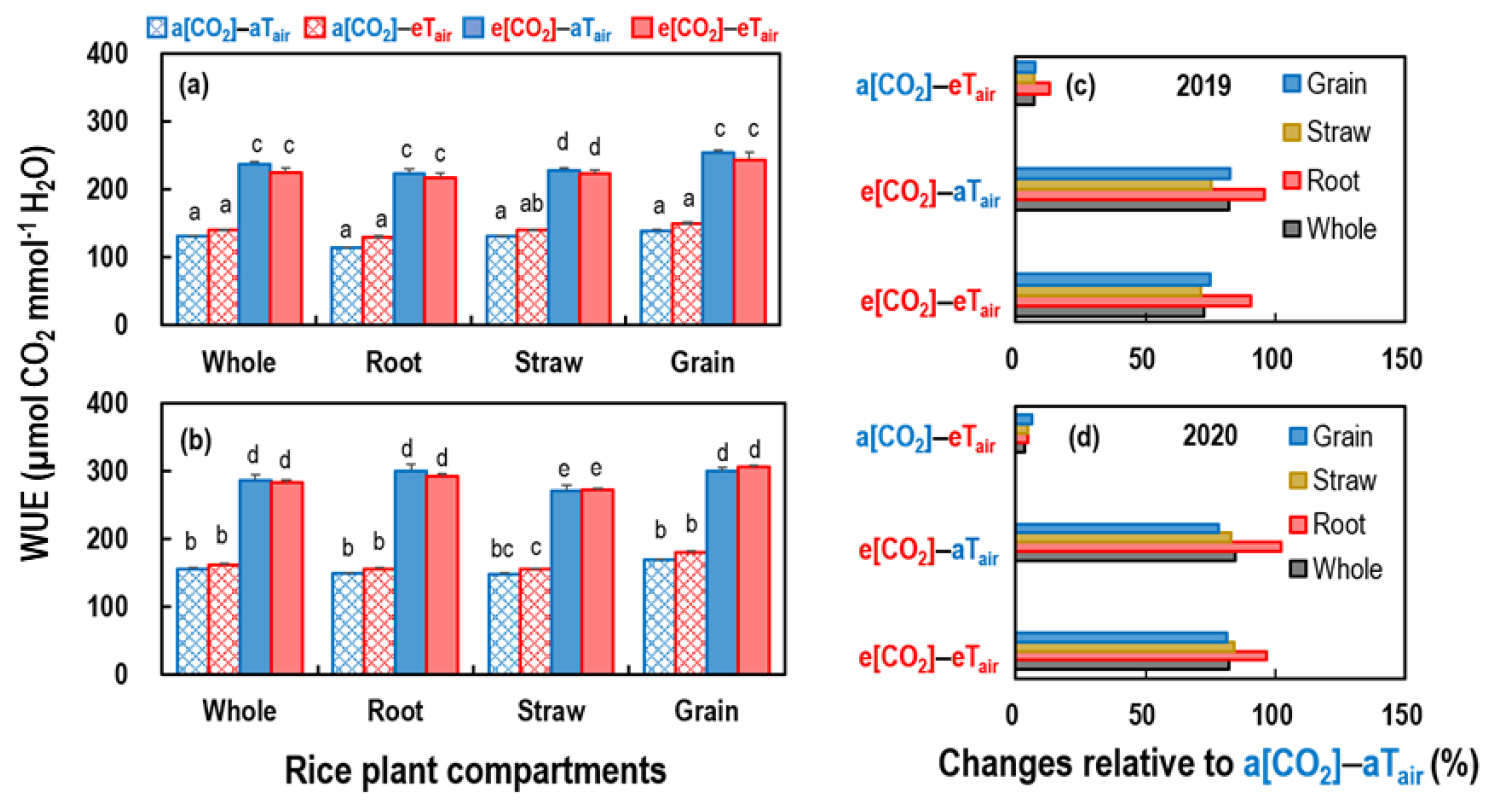
Fig. 3
Changes in the water use efficiency (WUE) of rice plants in various compartments (the whole plant, grain, straw, and roots) among four CO2 concentration ([CO2]) and air temperature (Tair) combinations (a[CO2], ambient [CO2]; e[CO2], elevated [CO2]; aTair, ambient Tair; and eTair, elevated Tair): (a and b) the WUE of rice plants in (a) 2019 and (b) 2020 and (c and d) changes in WUE relative to ambient conditions in (c) 2019 and (d) 2020. For (a) and (b), the values represent the means with the standard errors of three replicates. Different lowercase letters within the same rice compartment indicate that the values are different (P < 0.05) among the [CO2]-Tair combinations across two years.
Conclusions
Several studies have reported that e[CO2] alone or combined with eTair increases WUE of plants including rice. However, it remained unclear if the increases in WUE are affected by weather conditions. In this regard, this study demonstrates that solar radiation (and thus sunshine hours), which are closely associated with RH and thus VPD, strongly affect the e[CO2]-driven increases in WUE of rice plants. More specifically, the greater increments in WUE by e[CO2] in 2020 compared to 2019 suggest that decreased solar radiation increases WUE via decreased transpiration. As the WUE of rice plants is a crucial factor in hydrology of paddy ecosystems, our results propose that variability of weather conditions needs to be taken into account in assessment of water resources for developing irrigation schemes under warming with e[CO2].
