

Introduction
Materials and methods
토양시료
미량영양소 유효태 함량 분석
통계분석
Results and Discussion
미량영양소 유효태 함량과 토양특성의 관계
토지이용형태 및 모암이 미량영양소 유효태 함량에 미치는 영향
지역에 따른 미량영양소 유효태 평균함량
토양 미량영양소 관리방안
Conclusion
Introduction
인간의 생명현상 유지와 활동을 위해 식량을 통한 영양소의 섭취가 필수적이다. 지구상 식량의 약 95%는 토양에서 직 ‧ 간접적으로 생산되기 때문에 토양은 영양소 공급에 있어 핵심적인 요소이다 (FAO , 2015).
작물이 정상적으로 생장하기 위해서는 17가지 필수영양소가 필요하며 작물이 필요로 하는 양을 기준으로 다량 영양소와 미량영양소로 구분된다. 다량영영소는 작물 체내에 대부분 % 수준으로 존재하며, 탄소 (C), 산소 (O), 수소 (H), 질소 (N), 인 (P), 칼륨 (K), 칼슘 (Ca), 마그네슘 (Mg) 및 황 (S)이 포함된다. 반면에 미량영양소는 ppm 수준으로 존재하며 (Sillanpää, 1972), 철 (Fe), 아연 (Zn), 붕소 (B), 염소 (Cl), 구리 (Cu), 니켈 (Ni), 망간 (Mn) 및 몰리브덴 (Mo)이 포함된다 (Singh et al., 2010). 이러한 구분은 작물이 요구하는 양에 따른 것이며, 리비히의 최소량의 법칙 (Liebig’s law of the minimum)에 제시된 바와 같이 두 범주의 영양소 모두 작물 생장에 있어 동등하게 필수적이다 (Liebig, 1840; Marschner, 2012).
토양에 존재하는 영양소의 종류와 함량은 기본적으로 모암 (parent material)에 의해 결정되지만 (West, 1981), 농경지 토양은 이러한 자연적 배경 위에 인위적 관리 (무기 ‧ 유기질 비료 사용 및 경운방식)에 의해 추가적으로 영향을 받는다 (Li et al., 2007; Shiwakoti et al., 2019).
식량의 생산성을 확보하기 위해 적절한 무기질 비료를 사용하면서 N, P, K와 같은 다량영양소를 원활하게 공급하고 있다. 반면, 미량영양소의 경우 해당 무기질 비료의 시용이 제한적이어서 장기간 작물 재배 시 토양의 미량영양소 함량이 감소하여 (Jones et al., 2013; Shiwakoti et al., 2019; Wang et al., 2022), 작물의 미량영양소 함량 저하 및 인체의 숨은 기아 (hidden hunger) 현상이 발생하기도 한다 (Kihara et al., 2020). 인체 내에서 미량영양소 결핍은 주로 Fe과 Zn이 발생하며 어린이나 임산부의 발생 빈도가 높아 전 세계적으로 미량영양소 결핍으로 고생하는 인구가 약 20억명이다 (Dickinson et al., 2009; Kihara et al., 2020; Singh et al., 2010; Wakeel et al., 2018).
FAO가 주도한 국제 토양 조사 (1974년 - 1982년)에서 30개국 3,538개 토양시료의 미량영양소 함량을 분서간 결과, 일부 국가에서는 최대 91%가 특정 미량영양소 결핍으로 평가되었다 (Alloway, 2008). 우리나라는 Cu, Mn, Zn에 대하여 잠재적 결핍 가능성이 제기되었다 (Alloway, 2008). 이에 따라 다양한 국가에서 후속 조사가 수행되었으며, 인도, 중국, 터키에서는 토양 미량영양소 결핍이 확인되었고 (Cakmak, 2008; Singh, 2008; Zou et al., 2008), 중동 지역에서는 작물에서 결핍 증상이 나타나기도 하였다 (Rashid and Ryan, 2008).
토양 중 미량영양소 분석은 식물체가 이용 가능한 유효태 (available form)를 분석하는 것이 중요하며 대표적으로 DTPA, Mehlich Ⅲ 분석법이 있다. DTPA 분석법은 중성에서 알칼리성 토양을 대상으로 미량영양소를 추출하기 위하여 고안된 방법이다 (Lindsay and Norvell, 1978). Mehlich Ⅲ 분석법은 다량영양소와 미량영양소를 동시에 추출하기 위하여 고안된 방법이며 (Mehlich, 1984), DTPA 분석법 보다 넓은 산성에서 약알칼리성 토양에 적용이 가능하다 (Cancela et al., 2002).
현재 우리나라에서는 농경지 토양의 미량영양소 함량에 대한 전국 규모의 연구가 수행되지 않아 정확한 실태 파악이 어려운 실정이다. 따라서 본 연구는 국내 토양산도에 적합할 것으로 판단되는 Mehlich Ⅲ 분석법을 이용하여 우리나라 농경지의 토지이용형태 (land use type)와 모암 및 토양특성에 따른 토양 중 미량영양소 유효태 함량에 대한 기초자료를 구축하고자 한다.
Materials and methods
토양시료
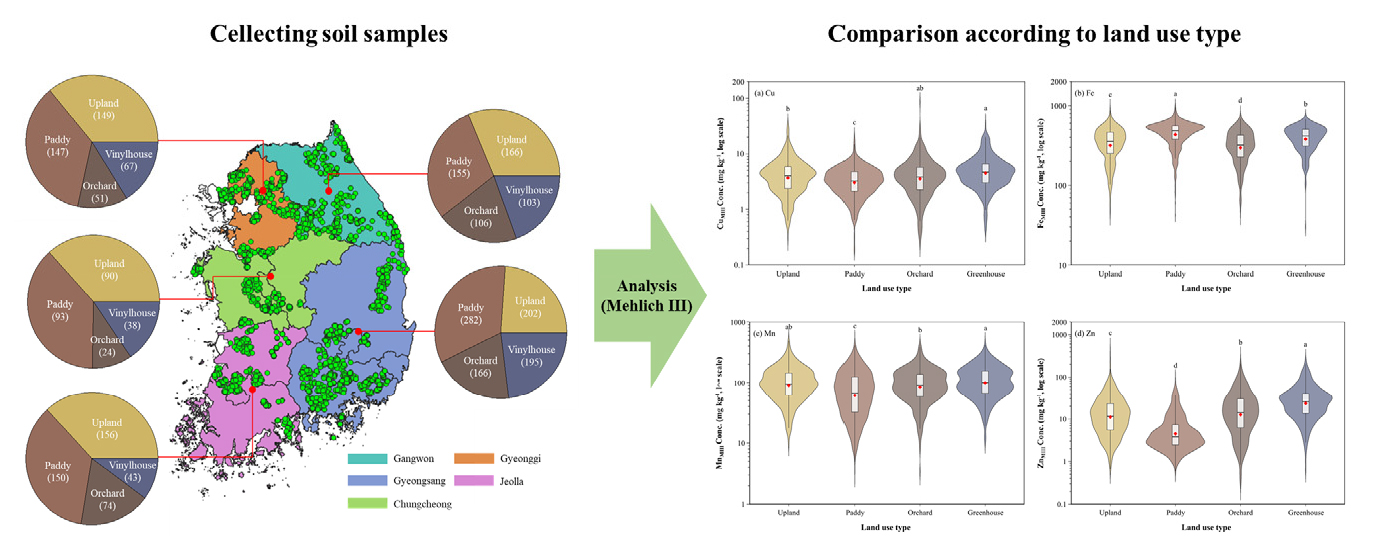
미량영양소의 분석을 위해 토지이용형태 (밭, 논, 과수원, 시설재배지)가 다른 지역으로부터 총 2,457 점의 토양시료를 전국에 위치한 다수의 농업기술센터로부터 제공받았다 (Fig. 1). 토양시료의 일반화학성 분석결과는 한국토양정보시스템인 흙토람에서 제공받았다. 분석항목은 pH, 토양유기물 (soil organic matter, SOM), 유효인산 (Av. P2O5) 및 교환성 양이온 (Exch. Ca, K, Mg) 이었다 (Table 1). 또한, 모암이 미량영양소 함량에 미치는 영향을 확인하기 위하여 흙토람에서 제공하는 토양환경지도의 토양특성 중 단면특성을 통해 각 시료지점의 모암을 조사하였다.
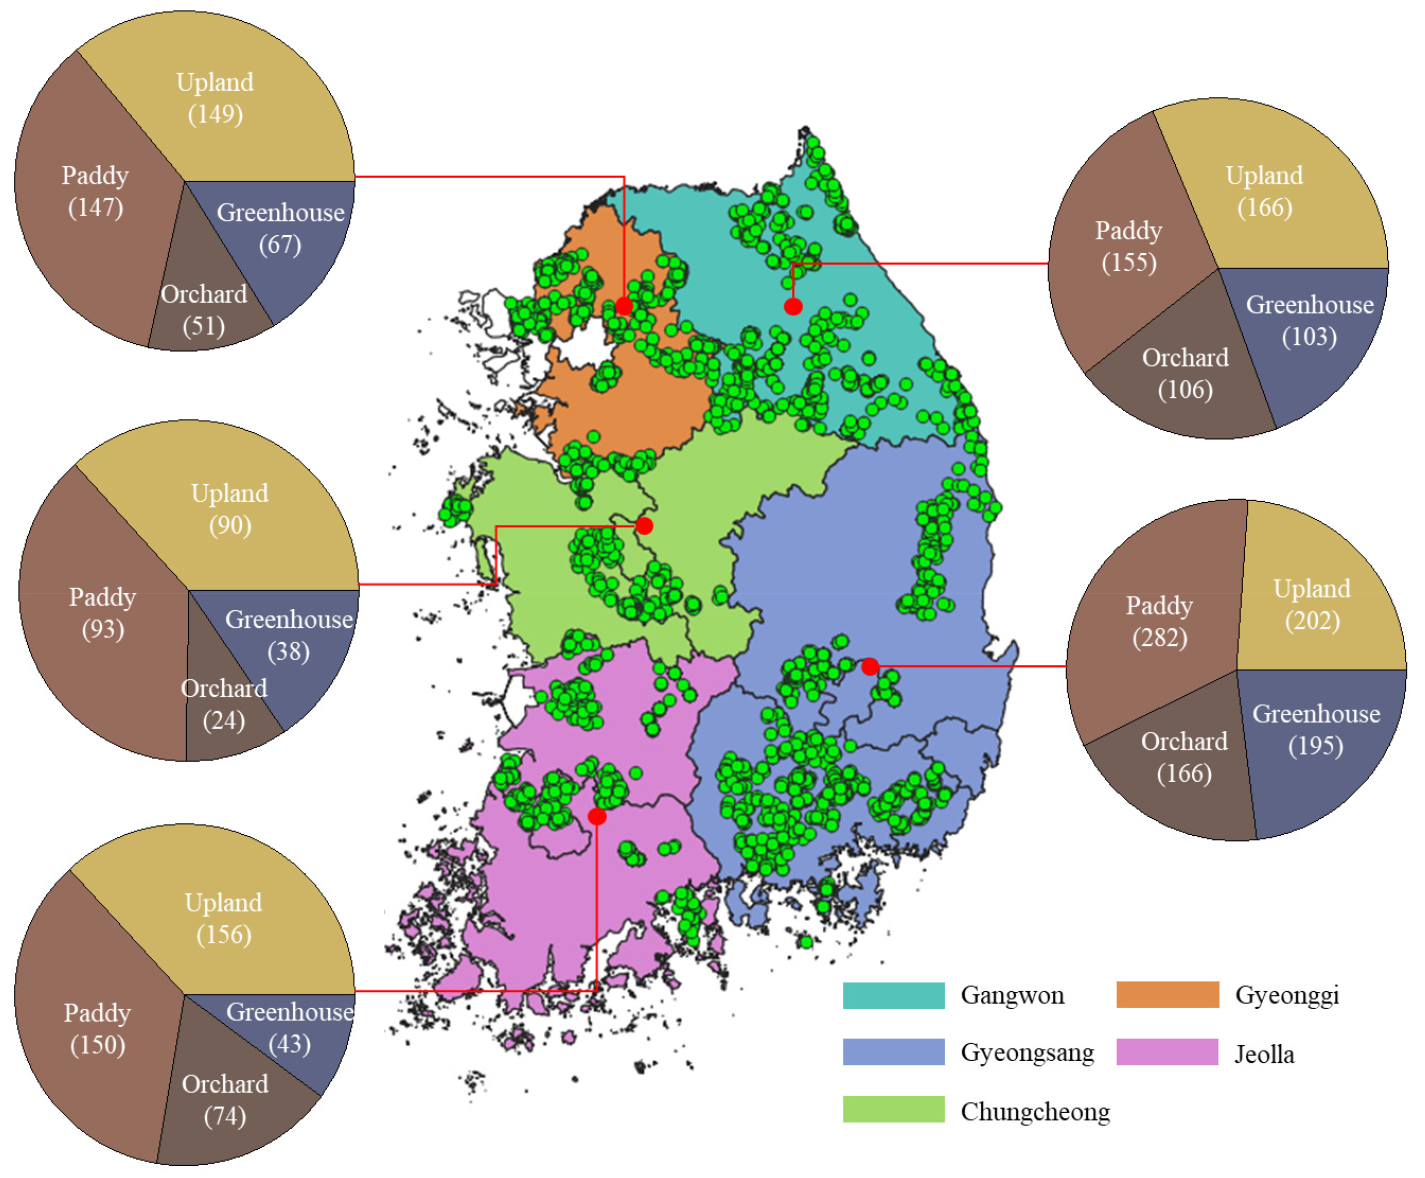
Table 1
Mean and ranges of the chemical properties of the soil samples .
|
pH - |
SOM (g kg-1) |
Av. P2O5 (mg kg-1) | Exchangeable (cmolc kg-1) | |||
| Ca | K | Mg | ||||
| Mean (SD1) | 6.4 (0.8) | 25.0 (13.5) | 466 (463) | 7.4 (4.4) | 0.92 (1.49) | 2.2 (2.0) |
| Min | 3.9 | 0.0 | 1 | 0.1 | 0.01 | 0.0 |
| Max | 10.4 | 141.0 | 3,492 | 36.0 | 48.52 | 27.7 |
미량영양소 유효태 함량 분석
토양의 미량영양소 유효태 함량 분석은 Mehlich Ⅲ (MⅢ) 침출법을 이용하였다 (Mehlich, 1984). 토양시료 2 g에 MⅢ 용액 (0.2 M CH3COOH, 0.015 M NH4F, 0.013 M HNO3, 0.25 M NH4NO3, 0.001 M EDTA, pH 2.5) 20 mL를 가하여 상온에서 10분간 진탕하여 Whatman No. 40 여과지로 여과 후 ICP-OES (iCAP 6300 Duo, Thermo Fisher Scientific, USA)를 이용하여 Cu, Fe, Mn 및 Zn 함량을 정량하였다.
통계분석
토양 중 미량영양소 유효태 함량에 대한 통계분석은 SPSS (Version 26, IBM Corp., USA)를 이용하였다. 토양 특성과 미량영양소 유효태 함량의 관계는 Pearson 상관분석으로 평가하였다. 토지이용형태 및 모암에 따른 미량영양소 유효태 함량 차이는 일원분산분석 (one-way ANOVA)으로 비교하였으며, 사후검정 (post-hoc)은 Games-Howell test (P < 0.05)를 이용하였다. 또한 토지이용형태와 모암이 미량영양소 유효태 함량에 미치는 영향을 확인하기 위하여 이원분산분석 (two-way ANOVA)을 수행하였다.
Results and Discussion
미량영양소 유효태 함량과 토양특성의 관계
국내 농경지 토양의 미량영양소 유효태 평균 함량은 Cu 4.5 mg kg-1, Fe 394.8 mg kg-1, Mn 101.7 mg kg-1, Zn 18.2 mg kg-1 으로 조사되었다 (Table 2). 국내에서는 Mehlich Ⅲ 추출법 기반 미량영양소 유효태 함량을 비교할 수 있는 선행연구의 부재로 인해 동일 추출법을 사용한 국외 선행연구들과 비교분석하였다. 스페인 북서부의 자연토양 (Cancela et al., 2002)의 미량영양소 함량은 Cu 0.8 mg kg-1, Fe 104.8 mg kg-1, Mn 15.7 mg kg-1, Zn 3.2 mg kg-1로 낮은 반면, 체코의 농경지 토양 (Zbíral, 2016)은 Cu 3.6 mg kg-1, Fe 372 mg kg-1, Mn 126 mg kg-1, Zn 6.7 mg kg-1로 국내 함량과 유사한 범위를 보였다. 스페인 북서부의 낮은 함량은 화강암이 주로 분포하고 (Arias et al., 2016), 지중해성 기후로 인해 토양발달이 느리며 (Verheye and Rosa, 2005), 자연토양으로 토양관리가 제한적이기 때문인 것으로 보인다. 체코의 유사성은 자연환경 차이에도 불구하고 장기간의 농업관리로 인해 토양 미량영양소 유효태 함량이 우리나라와 유사해진 것으로 보인다. 우리나라는 온대 몬순 기후에 화강암이 우세하고 체코는 대륙성 기후에 퇴적암이 우세하여 대조적인 지형 ‧ 기후 조건에 위치하고 있음에도 불구하고 (NGII, 2020; Žížala et al., 2021), 장기간의 토양관리가 토양특성을 특정범위로 수렴 (convergence)시켜 자연환경 차이를 상대적으로 상쇄하는 효과를 가져오는 것으로 판단된다 (Kuzyakov and Zamaian, 2019).
Table 2
Mean, ranges and median of soil micronutrient contents extracted by Mehlich Ⅲ.
|
Cu (mg kg-1) |
Fe (mg kg-1) |
Mn (mg kg-1) |
Zn (mg kg-1) | |
| Mean (SD1) | 4.5 (3.8) | 394.8 (149.4) | 101.7 (67.8) | 18.2 (24.9) |
| Min | 0.2 | 30.4 | 3.4 | 0.0 |
| Max | 86.5 | 1,002.1 | 486.1 | 406.7 |
| Median | 3.8 | 401.8 | 87.4 | 9.6 |
미량영양소 유효태 함량은 토양특성에 영향을 받는 것으로 알려져 있는데 본 연구에서는 토양특성 (pH, 토양유기물, 유효인산, 교환성 양이온)과 Fe를 제외한 미량영양소 유효태 함량 간에는 양의 상관관계로 나타났다 (Table 3). Fe의 경우 토양유기물 (r = 0.097, P < 0.01)과 유효인산 (r = 0.025, P > 0.05)을 제외한 토양특성들과 음의 상관관계를 보였으며 다른 미량영양소 보다 낮은 음의 상관계수 (-0.126~-0.044)로 토양특성에 영향을 적게 받는 것으로 나타났다.
Table 3
Pearson correlation coefficients of soil properties with micronutrients (n = 2,457).
| Cu | Fe | Mn | Zn | |
| pH | 0.163**1 | -0.126* | 0.327** | 0.164** |
| SOM | 0.231** | 0.097** | 0.041* | 0.377** |
| Av. P2O5 | 0.282** | 0.025 | 0.064** | 0.542** |
| Exch. Ca | 0.232** | -0.073** | 0.371** | 0.369** |
| Exch. K | 0.201** | -0.044* | 0.134** | 0.333** |
| Exch. Mg | 0.189** | -0.049* | 0.265** | 0.344** |
토양 미량영양소 유효도에 영향을 주는 토양특성은 다양하지만 특히 pH와 유기물함량이 중요한 것으로 알려져 있다 (Alloway, 2009; Dhaliwal et al., 2019; Vasu et al., 2021). pH는 토양입자 표면의 작용기의 양성자화 상태를 조절하여 pH-의존적 표면 전하를 생성하고 (Barrow and Hartemink, 2023), 이에 따라 미량영양소에 대한 정전기적 흡착을 제어함으로써 미량영양소의 유효도를 결정한다 (Harter, 1991; Adamczyk-Szabela and Wolf, 2022). 구체적으로, 토양 pH 증가에 따라 토양입자 표면의 음전하가 증가하여 미량영양소의 흡착이 촉진되나 (Wen et al., 2020), 동시에 미량영양소의 수산화물이 형성되고 토양입자 표면의 작용기와 착화합물을 형성하여 미량영양소의 용해도가 감소된다 (Harter, 1991; Adamczyk-Szabela and Wolf, 2022). 토양유기물은 미량영양소와 복합체를 형성하여 유효도를 증가시키며, 동시에 pH 변화에 대한 완충작용을 한다 (Chen, 1996). Dasgupta et al. (2023)은 토양 중 미량영양소 유효태 함량을 예측하기 위하여 토양특성 인자로 pH와 토양유기물을 이용하였으며,. Dhaliwal et al. (2019)은 퇴비, 녹비 및 식물 잔재물 등을 토양에 처리하면 이들 물질이 미량영양소를 공급할 뿐만 아니라 가용성 복합체를 형성하기 때문에 통합 영양 관리 (integrated nutrient management)에 유기질 비료를 포함하는 것이 미량영양소 결핍 현상 완화에 기여할 것이라고 하였다. 실제로 토양에 퇴비를 처리하면 유효인산, 교환성 양이온 뿐만 아니라 미량영양소 유효태 함량이 증가하는 것으로 보고된 바 있다 (Vidal-Vázquez et al., 2005; Choi et al., 2010). 이외에도 토양 중 미량양소 유효태 함량은 점토함량, CaCO3 및 CEC 등의 영향을 받기도 한다 (Santiago et al., 2008; Vasu et al., 2021; Dasgupta et al., 2023). 농촌진흥청에서 수행하는 토양 모니터링 연구사업인 농업환경변동평가 조사결과에 따르면 우리나라 농경지 토양의 pH, 토양유기물, 유효인산, 교환성 칼슘 함량이 지속적으로 증가하고 있다 (RDA, 2021). 토양특성과 미량영양소 유효태 함량 간에 통계적 유의성 (P < 0.05)이 관찰되었으나 설명력 (r2 < 0.3)은 제한적이었다. 이는 무기 ‧ 유기질 비료와 토양개량제 지원사업을 통한 석회물질의 장기시용의 직접적 효과 외에도 (Rutkowska et al., 2014), 기후, 지형, 작물체계, 토양관리방안 등 다양한 요인이 미량영양소 유효태 함량에 복합적으로 작용함을 시사한다 (Shiwakoti et al., 2019; Vasu et al., 2021; Dasgupta et al., 2023).
토지이용형태 및 모암이 미량영양소 유효태 함량에 미치는 영향
농경지의 대표적인 네 가지 토지이용형태인 밭 (upland, UL), 논 (paddy, PD), 과수원 (orchard, OC), 시설재배지 (greenhouse, GH)로 분류하여 각 미량영양소에 대하여 비교분석한 결과, 유효태 Cu, Mn 및 Zn 평균함량은 시설재배지가 5.86 mg kg-1, 117.1 mg kg-1 및 34.0 mg kg-1으로 가장 높았고, 유효태 Fe 평균함량은 논이 465 mg kg-1으로 가장 높았다 (Fig. 2).
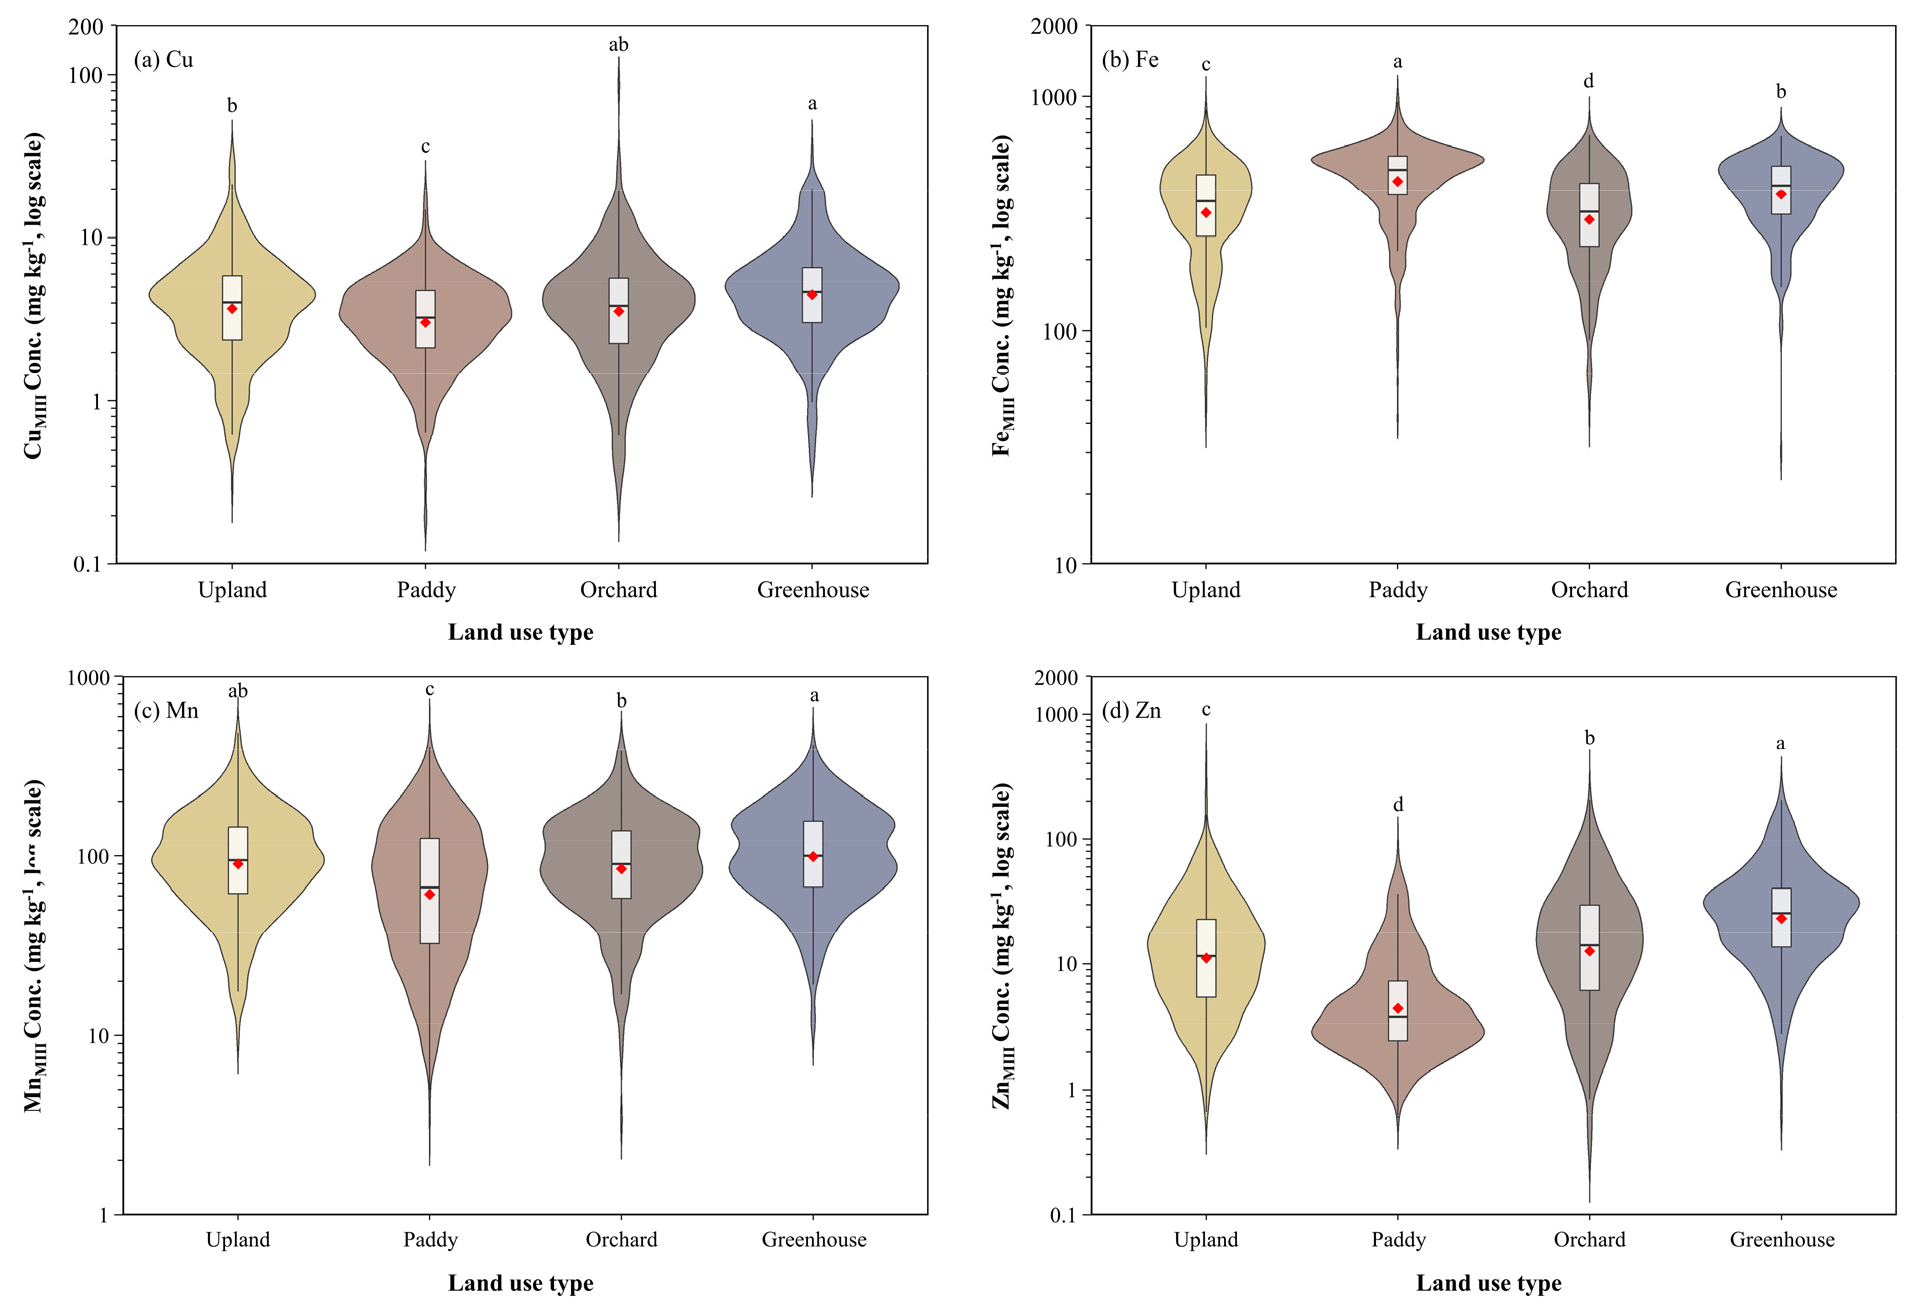
Fig. 2
Comparison of soil micronutrient (Cu, Fe, Mn, Zn) concentrations extracted by Mehlich Ⅲ according to land-use type. Red diamond represents mean. Box indicates interquartile range. Whiskers indicate minimum and maximum values. Different letters denote significant differences at P < 0.05 according to the Games–Howell test.
각 시료채취 지점에 해당하는 모암은 산성암 (acidic rock, AR), 제4기층 (quaternary deposit, QD), 퇴적암 (sedimentary rock, SR), 변성암 (metamorphic rock, MR)으로 네 가지였고 일부는 분류불가 (unknown)로 조사되었다. 각 모암별 해당하는 시료 수는 산성암 1,110개 (45.2%), 제4기층 980개 (39.9%), 퇴적암 253개 (10.3%), 변성암 60개 (2.4%), 분류불가 54개 (2.2%)로 약 85%가 산성암과 제4기층 이었다. 분류불가를 제외한 네 가지 모암별 미량영양소 유효태 함량 비교결과 Cu와 Zn 함량은 모암에 따른 통계적 유의한 차이는 없었으나 퇴적암이 5.2 mg kg-1와 19.5 mg kg-1으로 높았고, Fe 함량은 제4기층이 443 mg kg-1, Mn 함량은 퇴적암이 149.5 mg kg-1으로 가장 높아 퇴적암이 대체적으로 미량영양소 유효태 함량이 높은 경향을 보였다 (Fig. 3).
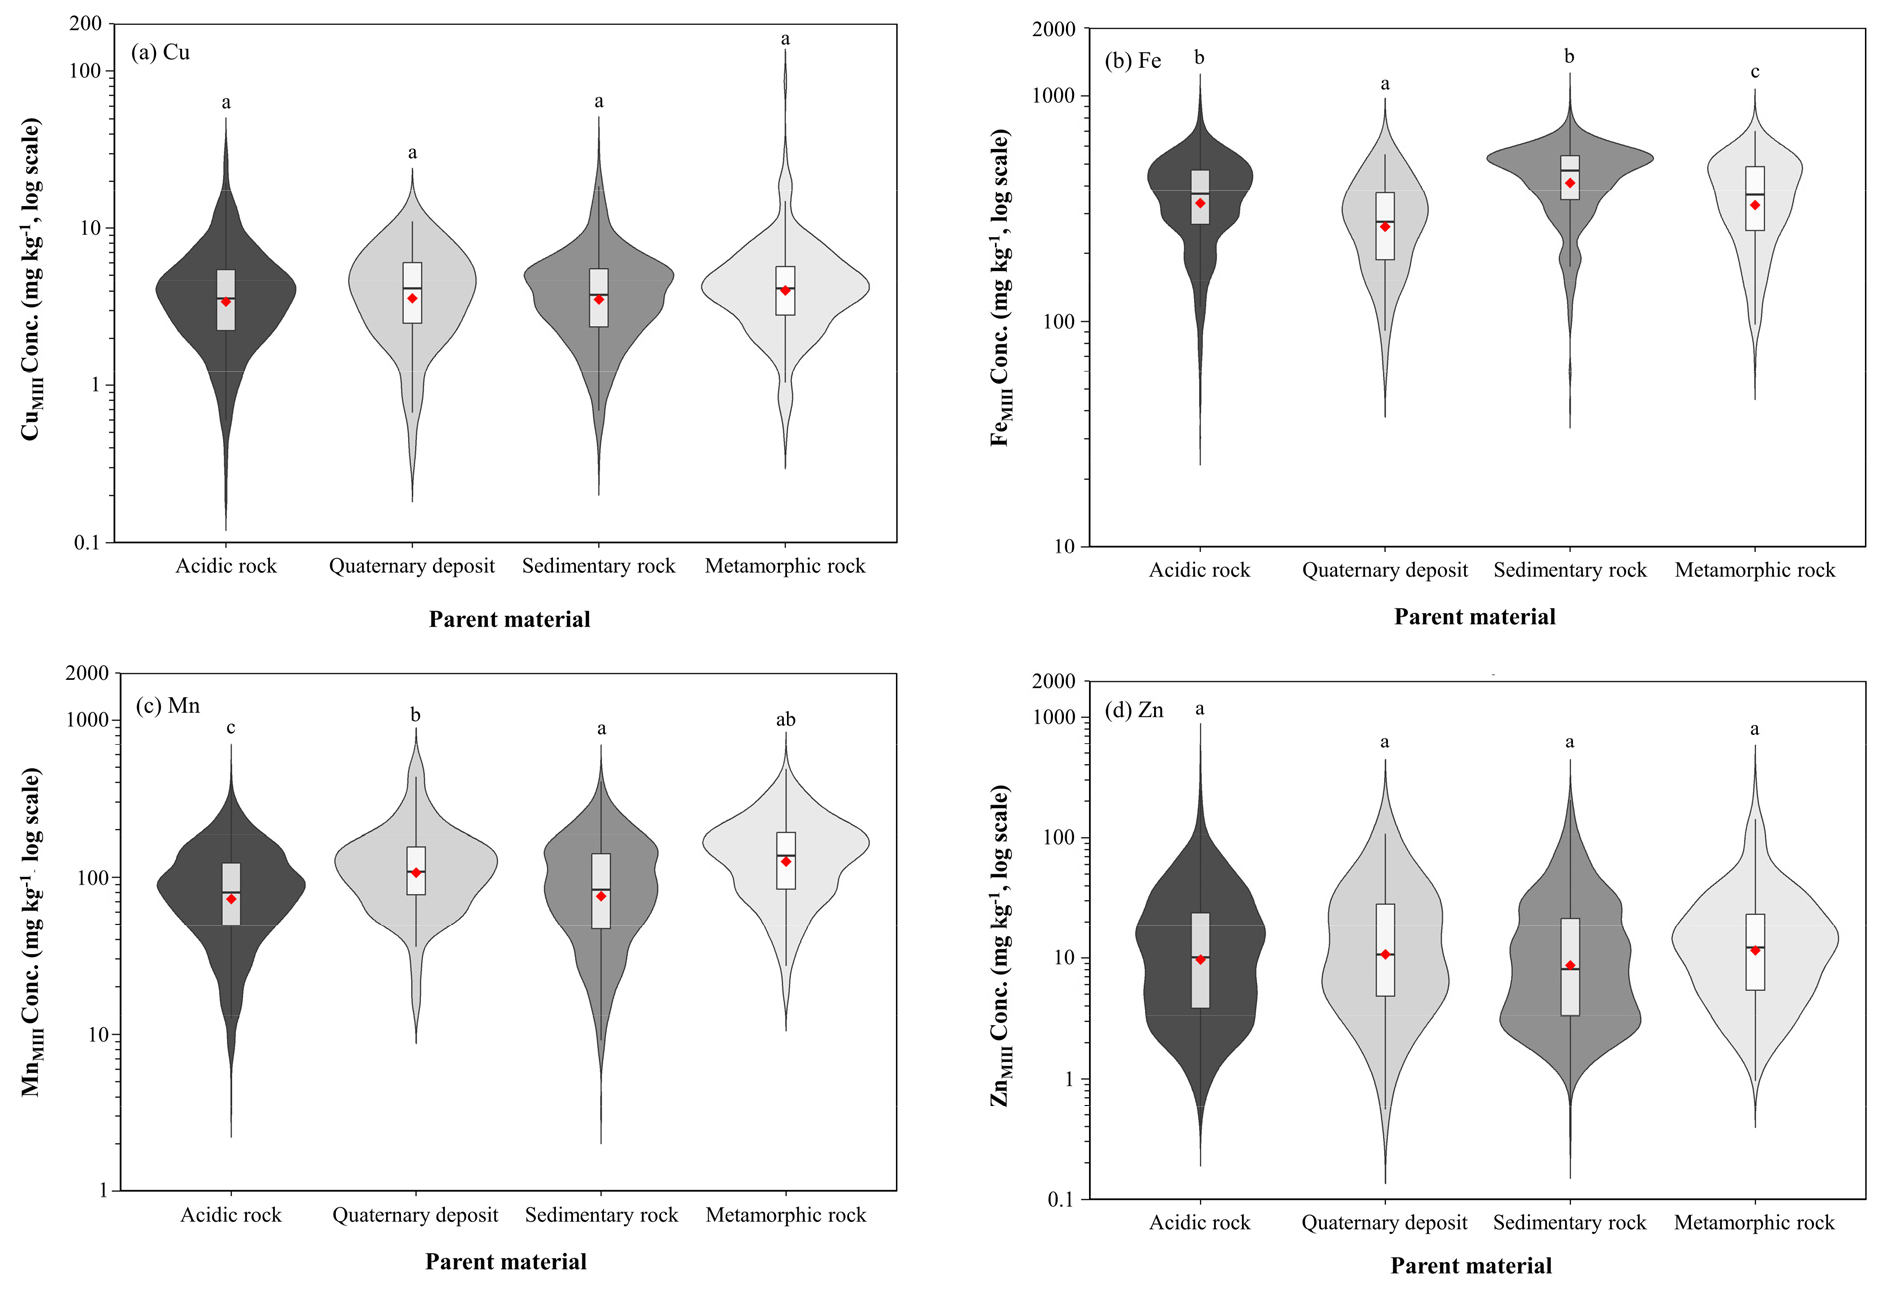
Fig. 3
Comparison of soil micronutrient (Cu, Fe, Mn, Zn) concentrations extracted by Mehlich Ⅲ according to parent material, excluding unknown types. Red diamond represents mean. Box indicates interquartile range. Whiskers indicate minimum and maximum values. Different letters denote significant differences at P < 0.05 according to the Games–Howell test.
토지이용형태 및 모암이 토양 중 미량영양소 유효태 함량에 미치는 영향을 확인하기 위하여 이원배치 분산분석을 실시한 결과 모암과 토지이용형태 모두 토양 중 미량영양소 유효태 함량에 유의한 영향을 미쳤으며 (P < 0.05), 상호작용 효과도 유의한 영향을 미치는 것으로 나타났다 (P < 0.01) (Table 4).
Table 4
Influence of land use type and parent materials on soil micronutrient concentrations.
Cu와 Zn은 가축 생육을 위해 사료에 투입되고 있는데 (An et al., 2021), Jeong et al. (2023)은 농자재가 집약적으로 투입되는 시설재배지의 특성으로 인해 가축분퇴비가 장기시용된 시설재배지 토양 중 Cu와 Zn 함량이 높은 것으로 보고하였다. 논에서는 다른 토지이용형태에 비해 퇴비의 사용이 적어 Cu와 Zn의 함량이 낮은 것으로 판단된다. Fe 함량은 논에서 가장 높은 것으로 나타났는데 Fe의 용해도는 주로 pH와 산화환원전위에 영향을 받는다 (Colombo et al., 2014). pH가 낮을수록 미량원소 화합물의 용해도가 증가하는 경향을 보이는데, 호기적인 조건에서는 Fe은 산화되어 안정적인 산화철 (Fe (Ⅲ)) 형태로 용해도가 감소하며 혐기적인 조건에서는 Fe이 환원되어 2가 철 (Fe (Ⅱ)) 형태로 용해도가 증가한다 (Colombo et al., 2014). 따라서 상대적으로 낮은 pH와 담수로 인하여 낮은 산화환원전위를 보유한 논은 Fe이 환원될 수 환경이 조성되고 Fe 흡수량 또는 유효도가 증가하여 타 토지이용형태보다 Fe 함량이 높은 것으로 판단된다.
산성암은 화성암 중 마지막에 형성되는 암석으로 앞서 형성되는 염기성암이나 중성암에 대부분의 미량영양소가 결정화되기 때문에 미량영양소 함량이 낮다. 퇴적암은 화성암의 풍화작용에 의해 형성된 것으로 화성암과 유사한 성분으로 구성되어 있지만 초기에 형성된 퇴적암은 염기성암에서 유래한 광물이 풍부하여 미량영양소 함량이 높다. 변성암은 모암에 따라 미량영양소 함량이 상이하나 고압, 고온의 조건에서 재결정화가 발생하기 때문에 미량영양소의 유효도가 낮다 (West, 1981). 우리나라 모암의 경우 대부분은 산성암과 변성암으로 이들로부터 생성된 토양은 미량영양소 함량이 적고, 평남 분지, 태백산 분지, 경상 분지 등과 같은 퇴적암이 주로 분포하는 지역에서 생성된 토양은 상대적으로 미량영양소 함량이 높을 것으로 판단된다 (NGII, 2020).
지역에 따른 미량영양소 유효태 평균함량
미량영양소 분석결과를 다섯 개의 도 (道) 단위 행정구역인 강원 (Gangwon, GW), 경기 (Gyeonggi, GG), 경상 (Gyeongsang, GS), 전라 (Jeolla, JL), 충청 (Chungcheong, CC)으로 분류하여 비교분석 결과 강원이 대체로 미량영양소 유효태 평균함량이 낮았으며 유효태 Mn 함량은 지역에 따른 차이가 없었다 (Fig. 4). 이렇게 지역별로 미량영양소 유효태 함량에 차이가 나타난 것은 단순히 모암이나 지형, 기후 같은 자연적 요인뿐만 아니라 (Vasu et al., 2021; Dasgupta et al., 2023), 각 지역의 특성에 따른 주요 토지이용형태의 비율 (예: 논이 지배적인 지역, 밭이 지배적인 지역 등), 토양관리방안, 주요 재배작물 (예: 작물의 종류, 품종 등) 차이 등의 영향인 것으로 판단된다.
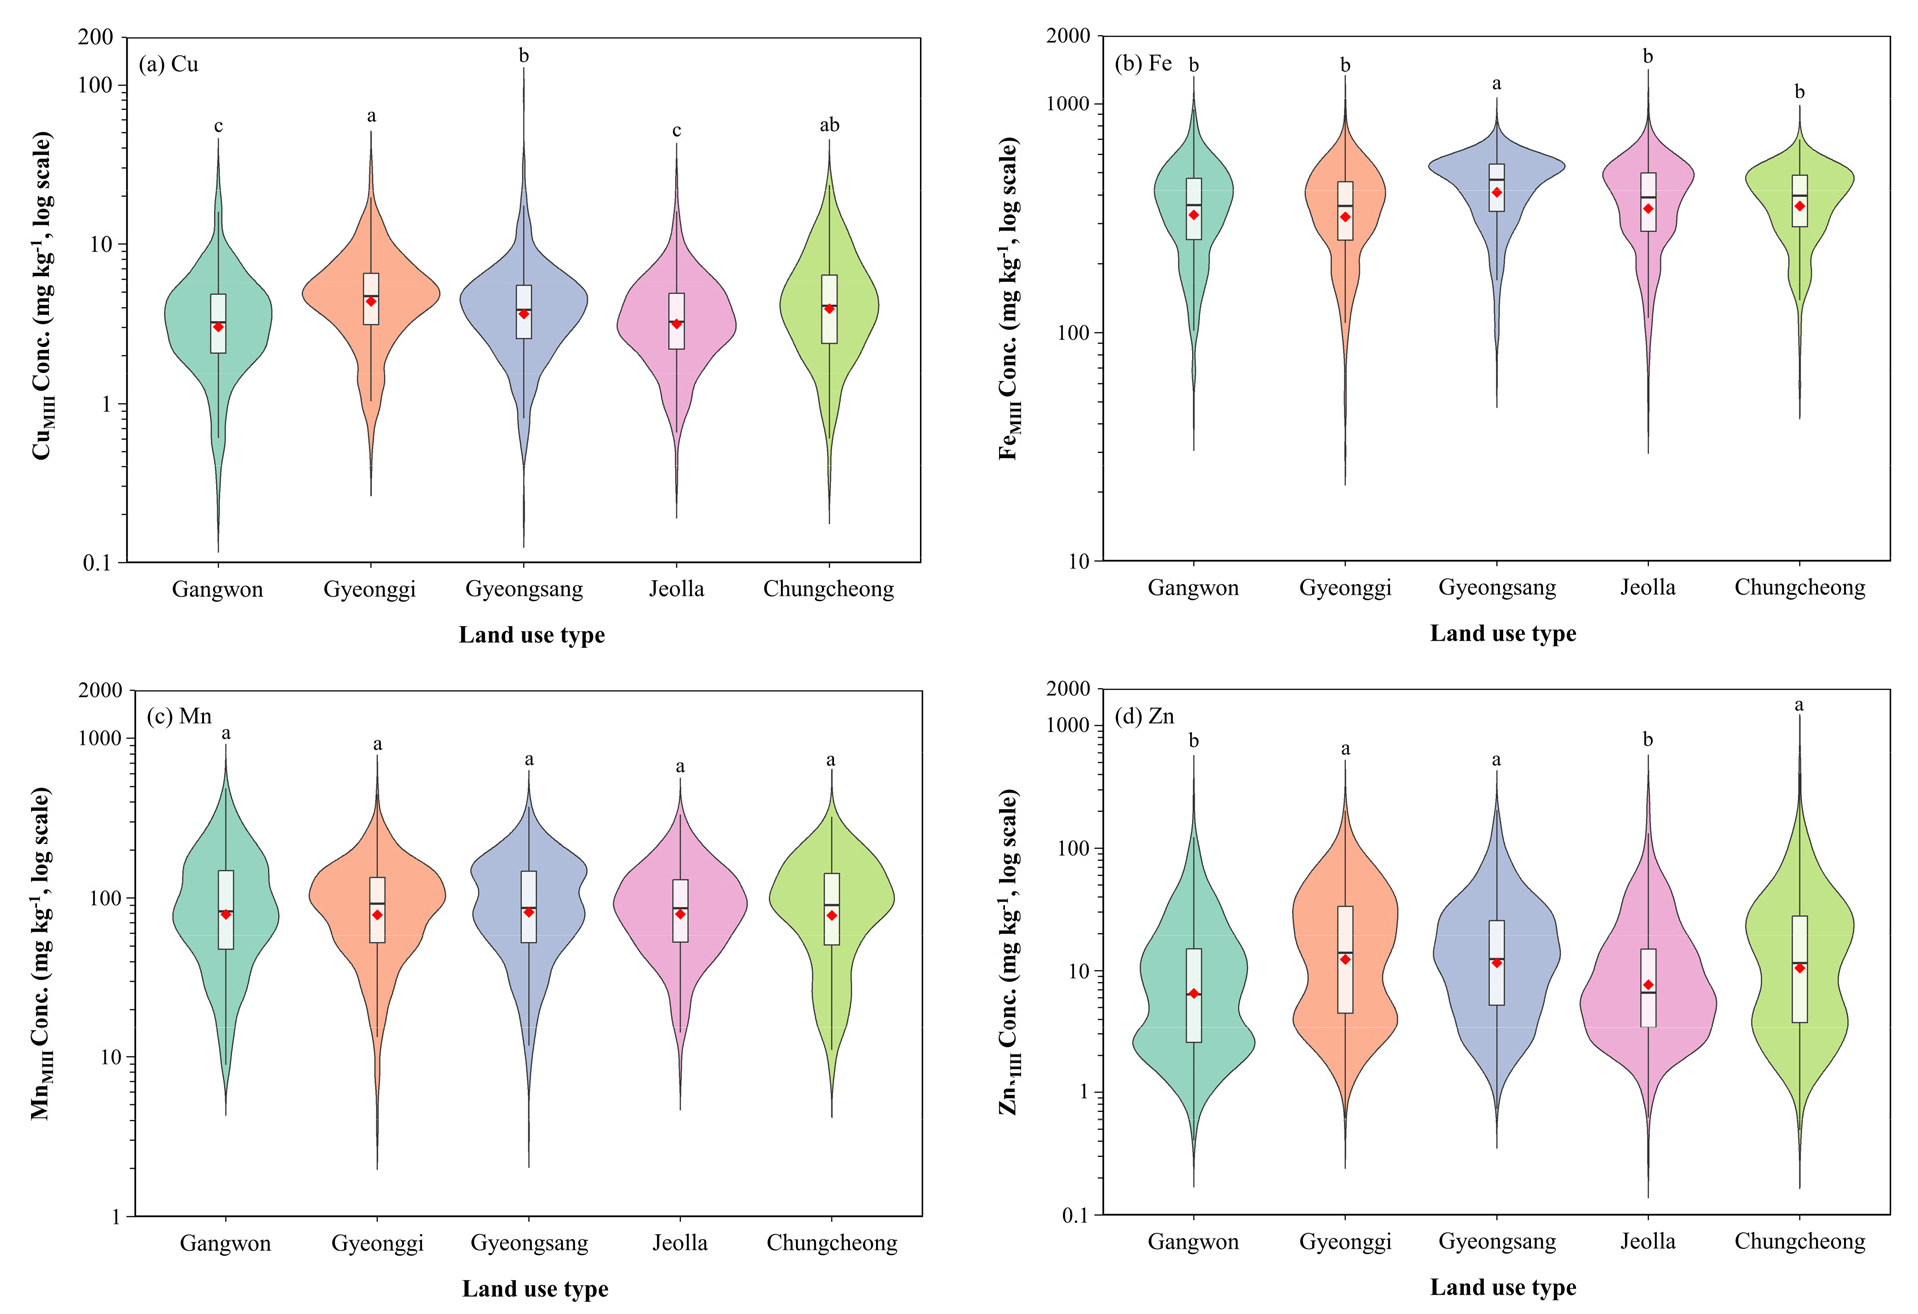
Fig. 4
Comparison of soil micronutrient (Cu, Fe, Mn, Zn) concentrations extracted by Mehlich Ⅲ according to Provinces. Red diamond represents mean. Box indicates interquartile range. Whiskers indicate minimum and maximum values. Different letters denote significant differences at P < 0.05 according to the Games–Howell test.
토양 미량영양소 관리방안
토양에 존재하는 미량영양소 유효태 함량에 영향을 미치는 요인은 매우 다양하다. 지형이나 기후는 인위적으로 관리할 수 없는 영향인자로 결국 지형이나 기후에 맞는 농경지 관리방안을 고려할 수 밖에 없다. Shiwakoti et al. (2019)은 75년간 경운방식과 질소 비료 처리량을 달리하여 토양 중 미량영양소 유효태 함량을 분석한 결과 디스크 (disk plough) 방식이 유효태 Mn 함량 증진에 효과적이었고 질소질 비료 처리에 따라 유효태 Cu 함량이 감소하는 것으로 보고하였다. 또한, 동일한 기간동안 교란되지 않은 초지보다 농경지에서 유효태 Zn과 Cu 함량의 감소율이 더 큰것으로 나타나 농경지 토양에 대한 미량영양소 관리의 필요성을 시사하였다. Li et al. (2007)은 16년간 유기질 비료를 처리한 결과 유효태 Fe, Mn 및 Zn 함량이 증가하여 토양유기물 관리의 중요성을 시사하였다. 미국의 경우 각 주립대학교에서 주요 작물과 결핍이 될 가능성이 높은 미량영양소에 대하여 분석법과 기준을 설정하여 토양 미량영양소를 관리하고 있다 (Table 5). 우리나라도 지역에 따른 주요 재배작물이 다르며, 토양관리 방법에 차이가 있기 때문에 지역별 적합한 분석법과 미량영양소 적정기준에 대한 연구가 선행되어야 할 것으로 보인다.
Table 5
Analytical methods and threshold value for classification of soil micronutrients in different States of United States.
| State |
Extracting solution | Class | Threshold value (mg kg-1) | |||
| Cu | Fe | Mn | Zn | |||
| Vermont |
Modified Morgan | Low | <0.5 | |||
| Medium | 0.5 - 0.9 | |||||
| High | >1.0 | |||||
| Wisconsin | 0.1 N HCl | Very low | <1.5 | |||
| Low | 0 - 10 | 1.6 - 3.0 | ||||
| Optimum | 11 - 20 | 3.1 - 20.0 | ||||
| High | >20 | 20.1 - 40.0 | ||||
| Very high | >40.0 | |||||
| Nebraska | DTPA | Low | <2.5 | <0.4 | ||
| Medium | 2.5 - 4.5 | 0.4 - 0.8 | ||||
| Adequate | >4.5 | >0.8 | ||||
| Illinois1 | DTPA | Low | <1.8 | <0.9 | <0.45 | |
| Adequate | >1.8 | >0.9 | >0.45 | |||
| Oklahoma | n.a2 | Deficient | <2.0 | <1.0 | <0.3 | |
| Medium | 2.0 - 4.5 | 0.3 - 2.0 | ||||
| Adequate | >4.5 | >1.0 | >2.0 | |||
| Oregon | DTPA | Low | <0.6 | <1.0 | <1.5 | |
| Sufficient | >0.6 | 1 - 5 | >1.5 | |||
| Florida | Mehlich Ⅲ | n.a | n.a | n.a | n.a | n.a |
Conclusion
우리나라 농경지 토양 2,457점의 미량영양소 함량을 분석한 결과 토지이용형태 중 시설재배지가 Cu, Mn, Zn이 높은 경향을 보였고 Fe는 논에서 가장 높았다. 모암 중에선 퇴적암이 미량영양소 함량이 높았다. 또한 토양특성에 따라 미량영양소의 함량이 영향을 받는 것을 확인할 수 있었다. 아직 토양 중 미량영양소에 대한 기초연구가 부족했었으나 본 연구를 통해 농경지의 미량영양소 분포에 대해 기초자료를 구축할 수 있었다. 향후 토지이용 외의 비료 및 퇴비 처리, 경운, 객토 등 토양관리가 미량영양소에 미치는 영향에 대해 보다 상세히 조사할 필요가 있다는 한계를 확인할 수 있었고, 향후 연구에서 본 연구에서 구축한 조사 방법 및 DB가 기초자료로 활용될 수 있을 것으로 기대된다.
