

Introduction
Materials and Methods
Plant material and growth condition
Sample preparation and GC-TOF-MS analysis for primary metabolites
Sample preparation and UPLC-DAD-QTOF-MS analysis for flavonoids
Statistical analysis
Results
Discussion
Introduction
Sulfur (S) is a macro mineral nutrient that is essential in plant growth and development (Nikiforova et al., 2004), and is a key component of amino acids (cystenine and methionine), co-enzymes (S-adenosylmethionine, SAM), prosthetic groups and sulfolipids (Hesse and Hoefgen, 2003; Saito, 2004). Sulfur, taken up by the roots as sulfate, is transported to the leaves for the assimilation as a form of sulfolipids or cysteine.
In general, sulfur is widely supplied as a form of ammonium-sulfate ((NH4)2SO4), potassium-sulfate (K2SO4), calcium-sulfate (CaSO4) and magnesium-sulfate (MgSO4) into agricultural soils. As starved, plants undergo visible symptoms such as chlorosis and retarded growth and, finally, lead to restricted growth and development (Nikiforova et al., 2004). Furthermore, Sulfur deficiency strongly decreases the uptake and assimilation of nitrogen which cause lower nitrogen use efficiency (NUE) (De-Bona et al., 2011), and induces low levels of protein and chlorophyll resulting in reduction of photosynthesis, and increases some amino acids (Nikiforova et al., 2005). Besides changing amino acids, sulfur deficiency is known to decreases glucose and sugar metabolism (Dong et al., 2017), and reduced fruit quality such as lower lycopene (Zelena et al., 2009) and flavonoids (Zhang et al., 2011). Flavonoids are ubiquitous plant secondary products that are best known as a protectant to environmental stresses such as UV-B (Landry et al., 1995; Ryan et al., 2000), mineral toxicity (Kidd et al., 2001) and salt (Ellenberger et al., 2020).
Sulfur deficiency in agricultural lands has been increased throughout the world (Germida and Janzen, 1993), and an available soil S contents in Korea showed relatively low levels in paddy (44.7 mg kg-1), upland (62.2) and greenhouse (116.3) soils (Yoon et al., 1996). The production and use of S-containing fertilizers have been showing a trend of gradual decrease due to soil acidification by S-containing fertilizers (Korea Fertilizer Association, 2020), however, an application of S-containing fertilizers showed significant yield of crops (Shin et al., 2005; Nam and Yoon, 2014). A huge amount of phosphogypsum, as a byproduct of phosphoric acid production, is one of important agricultural issues to utilize effectively due to containing essential nutrients including sulfur (Hentati et al., 2015; Saadaoui et al., 2017), and, particularly, it was effective in amending reclaimed, acidic and aluminum-toxified soils (Carvalho and van Raij, 1997; Garrido et al., 2003; Gharaibeh et al., 2014). Therefore, it is timely necessary to re-evaluate the roles of sulfur for crop production and soil amendment considering the expansion of phosphogypsum for agricultural use and the functions of sulfur for crop quality.
Firstly, we tried to investigate biochemical and physiological changes due to S deficiency prior to accessing agricultural priority of sulfur. Therefore, our aim was to examine an alteration in primary metabolites from leaves, roots and fruits of bell pepper plants as sulfur deficiency period prolonged and, to this end, employed a metabolite profiling. Metabolite profiling has been extensively used to characterize the effect of nutrient supply level on the tissue nutrition for cabbage, bell pepper and tomato plants, and revealed the shifts in metabolites to cope with inappropriate nutrient supply (Sung et al., 2015, 2018; Kim et al., 2018; Kwon et al., 2019; Gil et al., 2020). We tracked the changes in primary metabolites of leaves, roots and fruits at 15 days of S deficiency period. Furthermore, we also investigated the compositional fluctuations of flavonoids from the leaves harvested at the same day.
Materials and Methods
Plant material and growth condition
Seeds of bell pepper (Capsicum annuum L. var. angulosum) were germinated in perlite containing deionized water. Seedlings were moved to a hydroponic container at 14 days after the germination. The hydroponic containers were filled with nutrient solution consisting of 2.5 mM Ca(NO3)2, 2.5 mM KNO3, 1 mM MgSO4, 0.25 mM KH2PO4, 0.03 mM Fe-EDTA, 0.5 mM NH4NO3, 2 µM H3BO3,0.2 µM MnCl2, 0.19 µM ZnSO4, 0.01 µM CuSO4, and 0.03 µM H2MoO4. The light intensity fell between 800 and 1,200 µmol m-2 s-1 at mid-day. The growth temperature was 25 ± 3°C during the day and 15 ± 3°C at night. The container was continuously aerated. Four-weeks-old bell pepper plants were grown with 1/2 strength of Hoagland nutrient solution for 2 weeks, and then sulfur (S) deficiency was set up by replacing the nutrient solution in the container with S-deficient solution. For the S-deficient solution, MgSO4 were replaced by MgCl2. Leaves, roots and fruits were harvested at 10:00 - 12:00 on 5 and 15th day from the initiation of S deficiency, and samples were stored at -80°C for further analysis.
Sample preparation and GC-TOF-MS analysis for primary metabolites
Extraction of primary metabolites was performed as done in Kim et al. (2017). Sample was prepared by freeze-drying and grounding. The powdered sample of 100 mg was mixed with 1 mL of methanol, water, and chloroform in volume ratio of 2.5:1:1 and 60 µL of ribitol as an internal standard (0.2 mg mL-1) for 30 min at 37°C using a Thermomixer Compact (mixing frequency of 1,200 rpm; Eppendorf AG, Hamburg, Germany). The mixture was centrifuged for 3 min at 16,000 × g. The methanol/water phase (0.8 mL) of the mixture was mixed with 0.4 mL of deionized water in a new tube. The solution was centrifuged for 3 min at 16,000 × g. Drying of the methanol/water phase of the solution was performed for 2 h in a centrifugal concentrator (C-105, TOMY, Tokyo, Japan) and for another 16 h in a freeze dryer. After methoxyamine hydrochloride (80 µL, 20 mg mL-1) in pyridine was added, the solution was shaken for 90 min at 30°C. After 80 µL of N-methyl-N-(trimethylsilyl) trifluoroacetamide was added, Tthe solution was shaken for 30 min at 37°C. For GC-TOF-MS, an Agilent 7890A gas chromatograph (Agilent, Atlanta, USA) coupled to a Pegasus HT OF mass spectrometer (LECO, St. Joseph, USA) was used. For sample separation, a fused-silica capillary column coated with 0.25 µm film (CP-SIL 8 CB; 30 m × 0.25 mm; Varian Inc., Palo Alto, CA, USA) was used. The split ratio, injector temperature, and helium gas flow rate through the column were 1:25, 230°C, and 1.0 mL min-1, respectively. The temperature setting was as follows; 80°C for the first 2 min, increasing to 320°C at a rate of 15°C min-1, and keeping at 320°C for 10 min. The temperatures of the transfer line and ion source were 250°C and 200°C, respectively, and the mass scan range was 85 - 600 m/z. US National Institute of Standards and Technology mass spectral library and an in-house library were used for peak identification. The concentrations of all metabolites were calculated from the relative peak areas compared to those of the internal standard.
Sample preparation and UPLC-DAD-QTOF-MS analysis for flavonoids
Individual flavonoids were extracted according to the procedure of Kim et al. (2012) with slight modification. Lyophilized samples (1 g) were shaken for 5 min with 40 mL of MeOH: water: formic acid (50: 45: 5, v/v/v) containing internal standard. After centrifugation (3,000 rpm, 4°C, 15 min), the supernatant was filtered by syringe filter (PVDF, 0.20 µm, Whatman, Kent, England), and then 0.5 mL of the filtrate was diluted with 4.5 mL of water. The crude-extract was conducted to purify using the Sep-pak C18 classic cartridge (Waters Co., Milford, MA, USA). The cartridge was conditioned with 2 mL of MeOH and water, respectively. The diluted extract was loaded into the cartridge and washed with 2 mL of water to remove impurities. The extract was eluted by 3 mL of MeOH and concentrated using N2 gas. Finally, the crude-flavonoids were re-dissolved with 0.5 mL of MeOH: water: formic acid (50: 45: 5, v/v/v) prior to analysis. The analysis of individual flavonoids was conducted by UPLC-DAD-QTOF-MS (Waters Co., Milford, MA, USA) equipped with Kinetex 1.7 µm XB C18 100A column (150 × 2.1 mm i.d., Phenomenex, Torrance, CA, USA). The chromatographic conditions with slight modification from our previous report (Lee et al., 2016) as follows: flow rate (0.3 mL min-1), column oven temperature (30°C), and wavelengths (350 nm). The mobile phase was 0.5% formic acid in water (A) and 0.5% formic acid in acetonitrile (B). The flavonoids were analyzed using following gradient conditions: initial 5% B; 20 min, 25% B; 25 min, 50% B; 30 - 32 min, 90%, and 35 - 40 min, 5% B. The mass spectrometric parameters used was as the follows; 3.5 kV of capillary voltage, 40 V of sampling cone voltage, 120°C of source temperature, 500°C of desolvation temperature, and 1,050 L h-1 of desolvation gas. The mass analysis was performed in positive ionization mode using an electrospray ionization (ESI) source, and measured in full scan range of 200 - 1,200 m/z. The quantification was carried out using internal standard without considering relative response factor.
Statistical analysis
All analyses were performed for at least three biological replicates. Principal component analysis (PCA) for metabolites was performed as described in Kim et al. (2017). Correlations between metabolites were calculated by Pearson’s correlation analysis using SAS 9.4 (SAS Institute, Cary, NC, USA). The MultiExperiment Viewer (ver. 4.4.0, http://www.tm4.org/mev/) was used for hierarchical cluster analysis (HCA) and a heat map.
Results
The primary metabolites were profiled using GC-TOF-MS, and 39 of known metabolites including carbohydrates, amino acids and organic acids were identified. Metabolic data from the leaves (5 and 15 days after treatment, DAT), roots (5 and 15 DAT) and fruits (15 DAT) of bell pepper are subjected to a principal component analysis (PCA) to compare the difference between treatments (Fig. 1A). The PCA showed two principal components (PC1 and PC2) that explained 39.1 and 30.7% of total variance, respectively. Sulfur deficiency at 5 DAT did not change primary metabolites in both leaves and roots compared to the control. By contrast, long-term sulfur deficiency (15 days) markedly separated the leaves and roots by the PC2. The loading plot revealed that PC1 generally separated some of carbohydrates (positively) and amino acids and organic acids (negatively) (Fig. 1B). Furthermore, amino acids had positive loading values by PC2 whereas organic acids had negative loading values. The heat map analysis provides a useful visualization of how metabolites respond to S deficiency. The correlation between the primary metabolites was analyzed and separated into two clusters (Fig. 2). Cluster I consisted of oxalic acid, xylose, fructose, glucose, and mannitol, and cluster II consisted of other soluble sugars, organic acids, and amino acids. The relative fold changes in primary metabolites from the leaves, roots and fruits affected by S deficiency at 15 DAT were illustrated in Fig. 3. Overall, S deficiency resulted in the increase in carbohydrates (except glucose) and amino acids (except aspartate, methionine and alanine) in the leaves, while organic acids showed a trend of decrease except pyruvate and malate. In the roots, carbohydrates were decreased by S deficiency except sucrose, whereas a majority of amino acids and organic acids was significant increased. In the fruits, most of metabolites was markedly reduced by S deficiency.
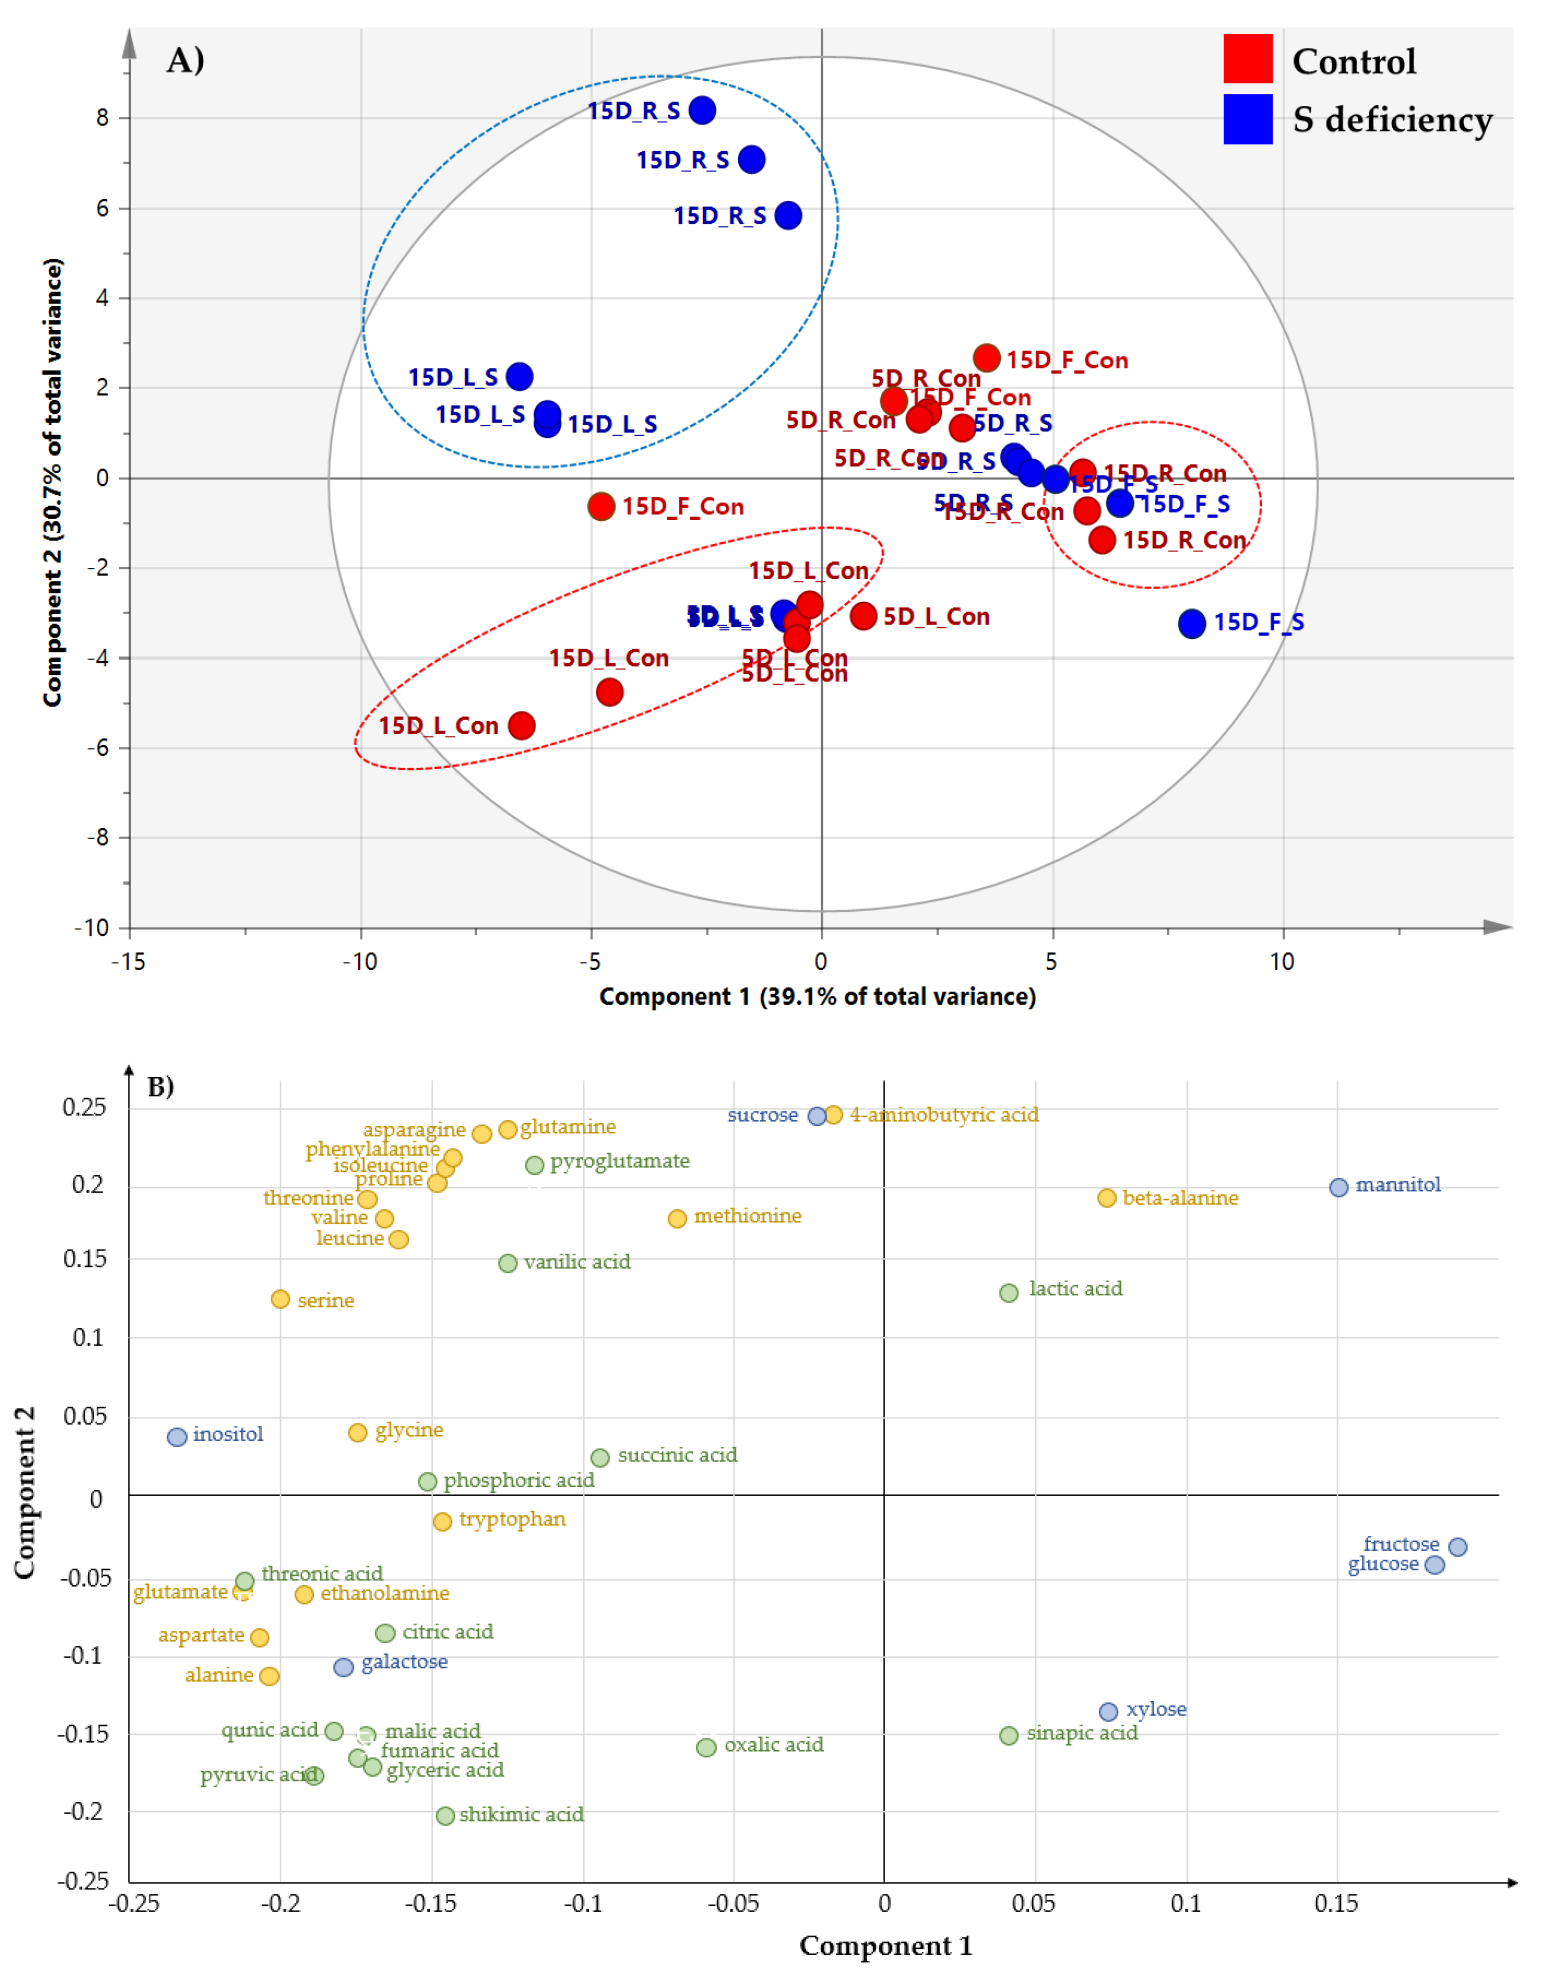

Fig. 2.
Correlation matrix and cluster analysis of the primary metabolites for leaves and roots of bell pepper under different sulfur supply conditions. Each square of heat map shows the Pearson’s correlation coefficient on a color scale. The value of the correlation coefficient is represented by the intensity of blue or red colors, as indicated on the color scale.
The flavonoids were detected from the leaves at 15 DAT using UPLC-DAD-QTOF-MS and quantified (Table 1). The compositional changes by S deficiency were not observed, and an effect was merely the slight increase or decrease in abundance. Of 15 flavonoids, luteolin 7-O-(2″-O-apiosyl)glucoside, unknown 1 and 2 (considered as an apigenin-derivative) were noticeably reduced by S deficiency, whereas luteolin 7-O-(2″-O-apiosyl-6″-O-malonyl) glucoside, unknown 5 and 6 (considered as an apigenin-derivative) increased.
Table 1.
Content of flavonoids detected from bell pepper leaves grown under 15-days sulfur deficiency (mg 100 g-1 dry weight). Mean values ± SD of three biological replicates.
Discussion
From the current study, it was observed that S deficiency remarkably affected primary metabolites in the leaves, roots and fruits, whereas an effect on flavonoids that act as a protectant against various environmental stresses was not obvious by S deficiency. These results were in line to the previous studies for many different species, in which sulfur deficiency caused marked increase in amino acids. A significant increase in amino acids including glutamine, asparagine, arginine, threonine, isoleucine, tryptophan, and glycine by S deficiency was reported in Arabidopsis (Nikiforova et al., 2005) and tobacco (Migge et al., 2000) plants. Spinach deprived from sulfate showed that young and old leaves increased arginine and young leaves increased glutamine but old leaves didn’t indicate the strong impact on N-utilization of young leaves by S deficiency (Prosser et al., 2001). Indeed, the current results of bell pepper were in accordance with other species that S-metabolism greatly influenced N-metabolism (Migge et al., 2000) due to the disturbed N assimilation which accumulates nitrate and asparagine (Prosser et al., 2001). The data about decrease in glucose and fructose, and accumulation of sucrose in the root by long term S deficiency (15 DAT) were in line with the results for other plant species. Arabidopsis decreased glucose level and sugar metabolism by sulfur deficiency (Dong et al., 2017), and rice plant decreased level of monosaccharaides and increased level of starch by sulfur deficiency (Lunde et al., 2008). On the other hand, spinach leaves increased sugars under sulfur deficiency (Dietz and Heilos, 1990). Visible morphological changes of sulfur deficiency are known to increase in root-to-shoot ratio (Lunde et al., 2008), and the increase in sucrose in the current study could be related for this mechanism. The decrease in glucose and fructose, and accumulation of sucrose in the root by sulfur deficiency in this study was similar to that of P, K, or Mg deficiency for the same period to bell pepper in the previous study (Kim et al., 2018).
An increase or decrease in flavonoids (glucose-bound-metabolites) in the leaves by S deficiency is likely to be greatly involved in the abundance in soluble carbohydrates such as glucose, fructose and sucrose. In general, flavonoids that are synthesized in the leaves are transported toward the whole plant via phloem (Jørgensen et al., 2015). Our data showed an ambiguity in the levels by the type of derivatives by sulfur deficiency. It was likely to be from an intensity of stress and plant species; increased flavonoids in bell pepper (Ellenberger et al., 2020), increased flavonoid content in Arabidopsis (Nikiforova et al., 2005), rice (Lunde et al., 2008) and two bell pepper cultivars, whereas decreased in barley (De-Bona et al., 2011). Armengaud et al. (2009) reported that nutrient deficiency leads to reversible or irreversible impacts on plant primary metabolism, and metabolic changes are strongly dependent upon the type of nutrients, intensity and plant species. In conclusion, S deficiency (15 DAT) affected primary metabolisms; an increase in amino acids in vegetative organs (leaves and roots) and a decrease in primary metabolites in reproductive organ (fruits). Furthermore, the levels of flavonoids in the bell pepper leaves showed relatively low perturbation by S deficiency. Our results suggest that, considering the significant increase in amino acids in the leaves and a decrease in carbohydrates in the fruits, S-mediated metabolism is greatly connected with C-N metabolism, and thus, S deficiency could cause the shortage of soluble carbohydrates from source to sink tissue. Together, on the basis of physiological functions of sulfur, S-containing fertilizers could be used to ensure favorable crop production and quality in low fertility soils including the reclaimed land.
