

Introduction
Materials and Methods
Study sites and soil sampling
Soil analyses
Statistical analysis
Results and Discussion
Distribution of ECe, ESP, and pH of the RTL soils
Salinity-sodicity types of soils of the RTL districts
Conclusions
Introduction
Reclaimed tidelands (RTLs) in the coastal areas of South Korea is estimated to be 186,639 ha of area, which is equivalent 12% of national arable land (Jeong et al., 2020). Due to its high salinity and groundwater level, RTLs are commonly used for the cultivation of rice (Oryza sativa L.), which is a national staple food (Lim et al., 2020). It has been reported that rice is not physiologically tolerant to salinity (Abrol et al., 1988), and thus decreased rice yield in RTLs with increased ECe has been reported in South Korea (Park et al., 2022). Despite this, irrigation of water with low salinity during rice season temporarily leaches down salts below rooting zones, and thus proper management including fertilization, gypsum application, and organic amendments can achieve rice yield comparable to that of non-saline soils, contributing to the national food security (Lim et al., 2020).
Though RTLs are responsible 22% of national rice production in South Korea, there are increasing social pressures on the use of RTLs for upland crops such as forage (Bae et al., 2021; Yun et al., 2021) and other cereal crops (Lee et al., 2021a, 2021b; Oh et al., 2022) due to reduced rice consumption. Therefore, it is necessary to investigate the salinity status of RTLs for assessment of the suitability of RTLs for the cultivation of upland crops (Jeong et al., 2020). As summarized by Jeong et al. (2020), many studies highlighted the importance of ECe for assessment of crop suitability for cultivation in salt-affected soils due to salinity stress on crops; i.e., most of forage and cereal crops exhibit salinity stress at 1.8 - 8.0 dS m-1 of ECe (Abrol et al., 1988). However, soil sodicity is also critical factor to influence upland crops growth as increased sodicity negatively affect soil physical properties such as destabilization soil aggregate, surface sealing, crusting, and runoff and erosion (Lim et al., 2020). Despite this, very little information on the status of both salinity and sodicity for RTLs in South Korea is available.
This study investigated the spatial variations in the salinity and sodicity of 16 RTLs located in southwestern Korea. The RTLs had been constructed in different areas and times (before 1900s to 2000s) and thus rice cultivation period were also different. Therefore, it was hypothesized that soil salinity and sodicity may decrease with years of rice cultivation due to desalinization and desodification by repeated irrigation and leaching of salts during rice cultivation.
Materials and Methods
Study sites and soil sampling
Soil samples were collected from paddy fields of 16 RTL districts located in the coastal area of southwestern South Korea (Fig. 1). The soils are classified as fulvic-gleyic-hydragric Anthrosols in the World Reference Base for Soil Resources of the International Union of Soil Sciences (IUSS Working Group WRB, 2015). The fields have been used for rice cultivation after RTL construction. Of 16 RTLs (Baiksoo, BS; Bojeon, BJ; Bokgil, BG; Gocheonam, GCA; Goheung, GH; Gunnae, GN; Mandeog, MD; Sanae, SN; Samsan, SS; Seosimcheon, SSC; Sopo, SP; Topmeori, TMR; Unnam, UN; Wolcheon, WC; Youmsan, YS; and Youngsangang, YSG), five RTLs (BG, SSC, TMR, UN, and YS) were constructed in unknown periods and thus had longer rice cultivation history compared to others. In contrast, six RTLs (GCA, GH, GN, SN, SS, and YSG) were constructed in 2000 and thus relatively shorter cultivation history (Table 1). During the last three decades, the annual mean temperature and annual precipitation of the study sites were 13 - 15°C and 1,400 - 1,500 mm, respectively (KMA, 2022).

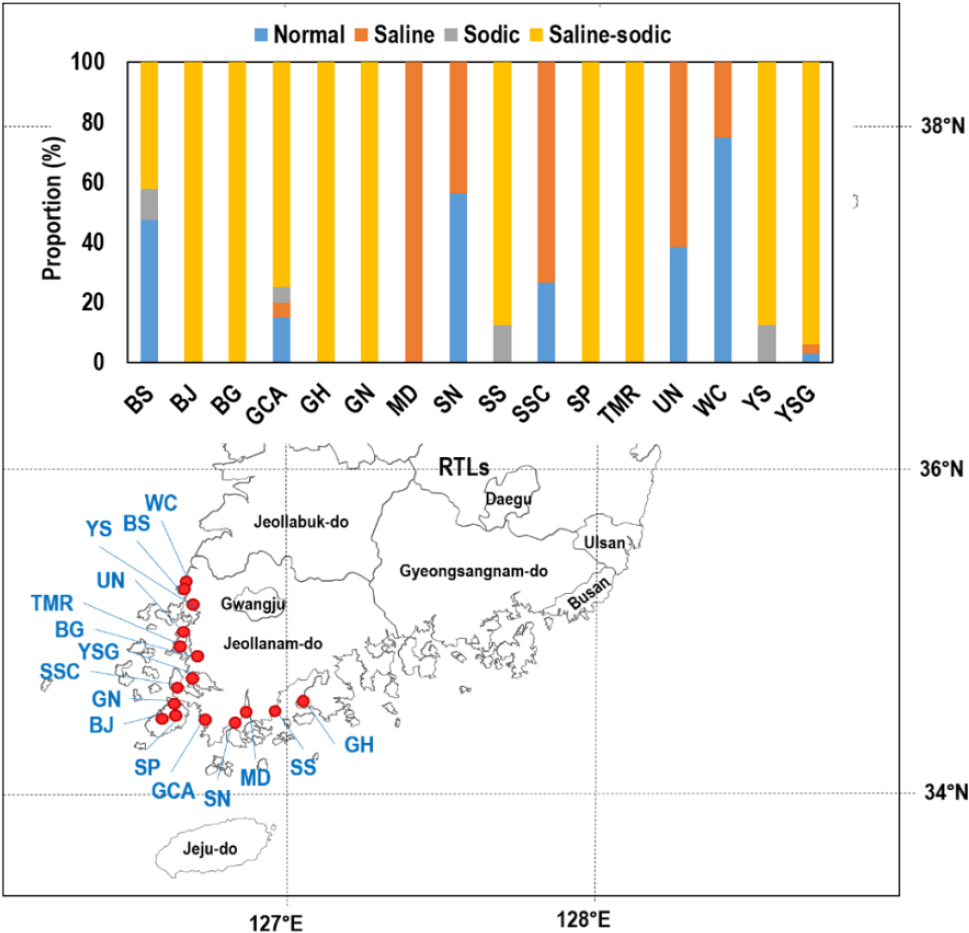
Fig. 1.
Geographical distribution of the studied reclaimed tidelands (RTL) (n = 16) along the coastal area in southern and western regions of South Korea. Locations of the studied RTLs were indicated by red circle symbols and details of the tidelands are provided in Table 1.
In March of 2019 - 2021, before rice planting, surface soil (0 - 20 cm) of selected paddy fields were sampled (Table 1). The number of study fields (totally 241 fields) was determined with the consideration of the area of RTLs to account for the site heterogeneity. The samples were brought to the laboratory and air-dried followed by sieving using a 2-mm sieve.
Table 1.
Information of 16 reclaimed tideland (RTL) districts investigated in this study.
| No. | RTLs (Code)† | Reclamation period | Reclaimed area (ha) | Sampling year | Number of soil samples |
| 1 | Baiksoo (BS) | 1940s | 377 | 2021 | 19 |
| 2 | Bojeon (BJ) | 1987 - 1996 | 298 | 2020 | 10 |
| 3 | Bokgil (BG) | Unknown‡ | 500 | 2021 | 10 |
| 4 | Gocheonam (GCA) | 1985 - 2003 | 3,020 | 2021 | 20 |
| 5 | Goheung (GH) | 1991 - 2005 | 3,100 | 2020 | 18 |
| 6 | Gunnae (GN) | 1990 - 2005 | 1,381 | 2020 | 14 |
| 7 | Mandeog (MD) | 1989 - 1998 | 316 | 2019 | 10 |
| 8 | Sanae (SN) | 1989 - 2002 | 822 | 2019 | 16 |
| 9 | Samsan (SS) | 1997 - 2005 | 420 | 2020 | 16 |
| 10 | Seosimcheon (SSC) | Unknown | 238 | 2019 | 15 |
| 11 | Sopo (SP) | 1982 - 1985 | 1,323 | 2021 | 10 |
| 12 | Topmeori (TMR) | Unknown | 1,633 | 2021 | 8 |
| 13 | Unnam (UN) | Unknown | 648 | 2019 | 13 |
| 14 | Wolcheon (WC) | 1978 - 1984 | 400 | 2019 | 20 |
| 15 | Youmsan (YS) | Unknown | 667 | 2021 | 8 |
| 16 | Youngsangang (YSG) | 1985 - 2003 | 20,249 | 2020 | 34 |
†See Fig. 1 for the geographic location.
Soil analyses
The sieved samples were analyzed for electrical conductivity of saturated paste extracts (ECe) following the method describe in Rhoades (1996) and Seo et al. (2022) using a conductivity meter (Orion 3 STAR, Thermo Fisher Scientific, USA). The pH of the soils were measured using 1:5 of soil:water extracts using a glass-electrode pH meter (Orion 3 STAR, Thermo Fisher Scientific, USA). Cation exchange capacity (CEC) of the soils was determined with the ammonium acetate method (pH 7.0) (Sumner and Miller, 1996). Exchangeable sodium (Na+), potassium (K+), calcium (Ca2+), and magnesium (Mg2+) concentrations were determined using an atomic absorption spectrometer (Analyst 800, Perkin Elmer, Waltham, USA). The exchangeable sodium percentage (ESP) was calculated as % of Na+ concentration to CEC.
Sodicity of the soils was classified using ESP. Though sodium adsorption ratio (SAR) is also used as an indicator of sodicity of soils, in the present study, we used ESP because SAR is an approximation of ESP, which is a better measure for soil sodicity (Lim et al., 2020). SAR is less labor- and time-intensive measure than ESP; however, SAR represents sodicity of soil solution while ESP reflect sodicity of soils (Gharaibeh et al., 2021).
Statistical analysis
All data sets were tested for homogeneity of variance and normality of distribution using Levene's test and Kolmogorov-Smirnov test, respectively. Data transformation was not needed as no heterogeneity was detected and the distribution was normal. Differences in soil variables between 16 RTLs were explored with the analysis of variance (ANOVA) using data for individual fields in each RTL as replicates, and the mean values of soil variables of 16 RTLs separated using the Duncan’s multiple range test at α = 0.05.
Results and Discussion
Distribution of ECe, ESP, and pH of the RTL soils
The ECe (range of average: 2.5 - 15.8 dS m-1), ESP (1.6 - 67.2%), and pH1:5 (6.6 - 9.0) of the RTL soils differed (P < 0.001) with RTL districts (Fig. 2). Of the 16 RTLs, the mean ECe of BS (3.6 ± 2.5 dS m-1) and WC (2.5 ± 1.7 dS m-1) was lower than 4.0 dS m-1, which is a threshold for normal soil classification (Lim et al., 2020) (Fig. 2a). Regarding ESP, MD (3.6 ± 1.2%), SN (4.8 ± 3.1%), SSC (3.3 ± 0.9%), and WC (1.6 ± 0.7%) had lower ESP compared to others (ESP range: 25.4 ± 12.5 - 67.2 ± 26.7%) (Fig. 2b). Except for SN (8.5 ± 0.7) and UN (9.0 ± 0.3), soil pHs were lower than 8.5, ranging from 6.6 ± 0.6 to 7.9 ± 0.2 (Fig. 2c).
It has been reported that ECe and ESP tend to decrease with years after reclamation (Lim et al., 2020; Park et al., 2022) due to desalinization by rice cultivation using less saline irrigation water (Lim et al., 2020; Park et al., 2022). In South Korea, EC of irrigation water has been reported to be 1.6 - 3.6 dS m-1 (Park and Choi, 2023), which is lower than the ECe of most of the study fields (Fig. 2a). However, in the present study, ECe and ESP of the soils did not show statistical significant patterns with reclamation year, rejecting our hypothesis. Despite this, it is notable that there is an indication of desalinization (Fig. 3a), desodification (Fig. 3b), and acidification (Fig. 3c) with rice cultivation years after reclamation. This result suggests that desalinization and desodification are slow in the study RTLs and thus more active land management practices such as liming, organic amendment, and active drainage are required to facilitate land improvement (Lim et al., 2020).

Fig. 2.
Box plots of the distribution of (a) electrical conductivity of saturated paste extract (ECe), (b) exchangeable sodium percentage (ESP), and pH1:5 of 16 reclaimed tidelands (RTLs). Details of RTLs are described in Table 1. Boxes represent interquartile ranges (IQRs) and horizontal lines and x marks within boxes indicate median and average values, respectively, and the upper and lower whiskers indicate 75 percentile plus 1.5 IQR and 25 percentile minus 1.5 IQR, respectively. Different lower-case letters above the bars indicate that the values are statistically different at α = 0.05.

Fig. 3.
Changes in (a) the electrical conductivity of saturated paste extract (ECe), (b) exchangeable sodium percentage (ESP), and pH1:5 of paddy soils from 10 reclaimed tidelands (RTLs) of which information on the exact reclamation years are available as presented in Table 1. Values are the mean of measured for paddy fields in each RTL, and vertical lines are standard deviation of the mean.
Salinity-sodicity types of soils of the RTL districts
The linear correlation (r2 = 0.71) between ESP and ECe (Fig. 4) indicates a substantial contribution of Na+ to the increased ECe of the soils (Lim et al., 2020). This is because the affinity of Na+ to cation-exchange sites is low compared to other cations thus Na+ is likely to be desorbed from the charged sites to soil solution, contributing to increased ECe (Robbins and Carter, 1983). When ESP and ECe of the soils were plotted, only one RTL (WC) had ECe < 4.0 dS m-1, ESP < 15%, and pH1:5 < 8.5, which are the criteria for normal soil classification (Lim et al., 2020) (Fig. 4). Two RTLs (MD and SSC) were classified as saline soils with ECe > 4.0 dS m-1, ESP < 15%, and pH1:5 < 8.5, and the other two RTLs (SN and UN) with ECe > 4.0 dS m-1 and ESP < 15% had a pH1:5 > 8.5. Though one RTL (BS) had sodic soil property (ECe < 4.0 dS m-1 and ESP > 15%), pH1:5 was lower than 8.5. Of 16 RTLs, 10 RTLs had saline-sodic properties with ECe > 4.0 dS m-1, ESP > 15%, and pH1:5 < 8.5.
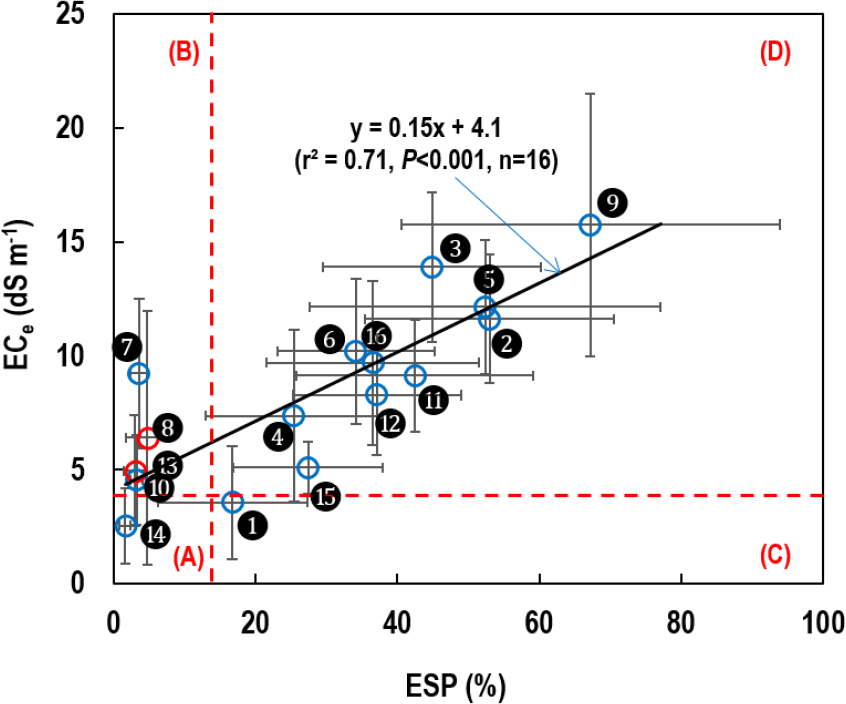
Fig. 4.
Bi-plots of the mean values of exchangeable sodium percentage (ESP) vs. electrical conductivity of saturated paste extract (ECe) of 16 reclaimed tidelands (RTLs): (A) ECe < 4.0 dS m-1 and ESP < 15% (normal), (B) ECe > 4.0 dS m-1 and ESP < 15% (saline), (C) ECe < 4.0 dS m-1 and ESP > 15% (sodic), and (D) ECe > 4.0 dS m-1 and ESP > 15% (saline-sodic). Numbers besides the symbols correspond to the RTLs number in Table 1. Vertical and horizontal lines are standard deviation of the mean. RTLs with pH > 8.5 are indicated with red symbols. The regression analysis between ESP and ECe was also depicted.
When the salinity and sodicity of all investigated paddy fields in each RTL district were classified, all fields in GH, GN, BJ, BG, SP, and TMR were saline-sodic soils (Fig. 5). Sodic soils were occasionally observed in SS, GCA, and YS; whereas saline soils were located in MD, SN, SSC, UN, WC, and GCA (Fig. 5). Normal soils were found in BS (47%), GCA (15%), SN (56%), SSC (27%), UN (38%), WC (75%), and YSG (3%). Therefore, paddy fields in WC, SN, and BS are more suitable for upland crop cultivation than other RTLs judging from the soil salinity and sodicity. The construction years of WC, SN, and BS are 1984, 2002, and 1940s, respectively (Table 1), and thus this results indicate again that desalinization and desodification are not solely dependent on rice cultivation years after reclamation. For upland crop cultivation in WC, SN, and BS, however, soil texture and groundwater levels of the RTLs need to be further investigated to utilize RTLs for upland crop cultivation because yields of upland crops are susceptible to excess soil moisture stress and poor aerations (Yamauchi et al., 2018; Jeong et al., 2020).

Fig. 5.
Distribution of normal, saline, sodic, and saline-sodic soils for paddy fields in 16 reclaimed tidelands (RTLs) using electrical conductivity of saturated paste extract (ECe), exchangeable sodium percentage (ESP), and pH1:5 of the soils. The criteria of ECe, ESP, and pH1:5 are < 4.0 dS m-1, < 15%, and < 8.5 for normal, > 4.0 dS m-1, < 15%, and < 8.5 for saline, < 4.0 dS m-1, > 15%, and > 8.5 for sodic, and > 4.0 dS m-1, > 15%, and < 8.5 for saline-sodic soils (Lim et al., 2020). Details of RTLs are described in Table 1.
Conclusions
Our results show that the salinity and sodicity of 16 RTLs located in the southwestern coastal area of South Korea is not affected by rice cultivation years after reclamation though there are indications of decreased ECe and ESP with rice cultivation years. Therefore, active land management practices such as liming, organic matter application, and drainage are required to facilitate desalinization and desodification. Of 16 RTLs, three RTLs (WC, SN, and BS) had relatively higher portion of normal soils with ECe < 4.0 dS m-1, ESP < 15%, and pH1:5 < 8.5. Therefore, these RTLs are considered to be more suitable for upland crop cultivation than other RTLs. However, for successful upland crops cultivation, more information such as groundwater levels and soil drainage is required to make a decision on the change of land use from rice paddies to uplands.
