Comparative Analysis of Microbial Community Characteristic of Acidic and Neutral Soils in Korean Orchards
1Researcher, Agricultural Microbiology Division, Department of Agricultural Biology, National Institute of Agricultural Sciences, RDA, Wanju 55365, Korea
2Researcher, Organic Microorganism Research Center, Gyeonggi-do Agricultural Research & Extension Services (ARES), Hwaseong 18388, Korea
3Researcher, Agricultural Environmental Research Section, Gangwon-do ARES, Chuncheon 24203, Korea
4Researcher, Division of Agricultural Environment Research, Chungcheongbuk-do ARES, Cheongju 28130, Korea
5Researcher, Environmentally Friendly Agriculture Division, Chungcheongnam-do ARES, Yesan 32418, Korea
6Researcher, Agricultural Environment Division, Jeollabuk-do ARES, Iksan 54591, Korea
7Researcher, Environment-Friendly agricultural Research Institute, Jeollanam-do ARES, Naju 58213, Korea
8Ph.D. Researcher, Division of Agricultural Environment Research, Gyeongsangbuk-do ARES, Daegu 41404, Korea
9Researcher, Environmental Agriculture Research Department, Gyeongsangnam-do ARES, Jinju 52733, Korea
10Professor, Department of Agricultural Chemistry & Interdisciplinary Program in IT-Bio Convergence System, Sunchon National University, Sunchon 57922, Korea
11Ph.D. Researcher, Soil and Fertilizer Division, Department of Agricultural Environment, National Institute of Agricultural Sciences, RDA, Wanju 55365, Korea
12Ph.D. Researcher, Agricultural Microbiology Division, Department of Agricultural Biology, National Institute of Agricultural Sciences, RDA, Wanju 55365, Korea
13Professor, Department of Agricultural Biology, College of Agricultural and Life Science, Jeonbuk National University, Jeonju 54896, Korea
ABSTRACT
Introduction
Materials and Methods
토양 시료 채취
토양 화학성 분석
DNA 추출 및 시퀀싱
MiSeq 시퀀싱 데이터 분석
미생물 군집 분석
통계 분석
Results and Discussion
PCoA 분석
ANCOM-BC
Network analysis
Conclusions
Introduction
미생물은 토양 입단화를 유도하고 (Tisdall and Oades, 1982) 유기물 분해를 통해 탄소 순환에 기여하며 (Miltner et al., 2012; Hemkemeyer et al., 2021) 인산 가용화 (Khan et al., 2016) 및 토양 비옥도에 관여하는 등 토양 생태계에서 다양하고 중요한 역할을 하는 것으로 알려져 있다 (Lynch and Bragg, 1985; Marschner et al., 2004; Hemkemeyer et al., 2021). 토양 뿐만 아니라 식물에도 큰 영향을 미치는데, 식물이 사용 가능한 형태로 질소를 변환시키는 등 토양 질소 순환에 중요한 역할을 한다 (Bohlool et al., 1992). 또한 식물 생장에 간접적으로 도움을 주기도 하며 식물의 병 저항성을 유도하거나 미생물 간 상호작용으로 병을 억제하기도 한다 (Compant et al., 2010; Cha et al., 2016; Dewen et al., 2017; Vlot et al., 2021). 따라서 토양 건전성을 증가시키고 지속가능한 농업을 이루기 위해 최근 토양 미생물에 대한 연구가 활발히 이루어지고 있다. 그러나 토양 미생물은 흙 1 g에 수 천 개 이상의 종이 존재하며 복잡한 군집을 이루고 있어 아직까지 알려지지 않은 부분이 많다 (Whitman et al., 1998; Torsvik et al., 2002; Fierer, 2017).
일반적으로 미생물이 풍부하고 군집의 구성이 다양할수록 토양과 작물에 긍정적인 영향을 미치는 것으로 알려져 있다 (Matos et al., 2005; Lamb et al., 2011). 여러 요인들이 토양미생물의 군집에 영향을 미치는데, 그 중 하나로 식물 뿌리 주변에 형성되는 근권 (rhizosphere)이 있으며 식물 뿌리는 다양한 생리활성 화합물을 근권으로 배출하고 이 삼출물에 이끌려 미생물들이 모여들게 된다 (Sørensen, 1997; Brimecombe et al., 2000; Bais et al., 2006). 따라서 식물의 종류에 따라 미생물 군집이 변화하며 근권은 특정 미생물의 비율이 높은 반면 비근권 토양은 균일하고 풍부한 미생물 군집 형태를 나타낸다 (Schreiter et al., 2014; Bakker et al., 2015). 그러나 근권이 아닌 서식지 유형이나 토지 이용 형태 등에 따라 미생물 분포 또한 크게 변화된다. 최근 연구에 따르면 프랑스나 뉴질랜드에서 산림, 초원 등 토양 유형에 따라 토양 특성과 미생물 간 상관관계가 있었고 미생물 풍부도와 네트워크에 차이가 있었다 (Hermans et al., 2017; Karimi et al., 2019). 담수 환경인 우리나라 벼논은 혐기 조건에서 많이 발견되는 Chloroflexota의 상대풍부도가 높았고 밭, 과수원, 시설재배지에 비해 미생물 네트워크가 더 많이 형성되는 것으로 밝혀졌다 (Petriglieri et al., 2018; Lee et al., 2020). 토양 유형 뿐만 아니라 토양 관리 방법에 따라 달라지는 토양 화학성은 미생물 군집 변화에 상당한 영향을 미친다고 잘 알려져 있다 (Aziz et al., 2013; Bartram et al., 2014; Yoon et al., 2022; Kim et al., 2023). 이전 연구들은 pH, 전기 전도도, 유기물 함량, 가용성 인산 등 변화에 따라 미생물 군집 구성이 달라지는 것을 확인하였고 (Chodak et al., 2015; Kim et al., 2016; Xu et al., 2020), 특히 pH는 다른 이화학성에 비해 미생물 군집 구조와 다양성에 큰 영향을 미친다 (Lauber et al., 2009; Rousk et al., 2010; Kim et al., 2016; Lee et al., 2020). 토양 pH는 산성비와 같은 기후 요인에 의해 감소하거나 농경지의 경우 암모늄 비료 사용에 의해 산성화되기도 하는데 (Tian and Niu, 2015; Goulding, 2016), Tripathi et al. (2018)의 연구에 따르면 토양 pH가 산성 또는 염기성일수록 하나의 환경 필터로 작용하여 특정 계통으로 분화를 유도하지만 pH가 중성일수록 미생물 군집의 분포 비율은 균등해진다 (Lauber et al., 2009; Tripathi et al., 2018). 또한 공간적 거리보다 pH 차이가 미생물 군집에 더 큰 영향을 주었다. 현재까지 토양 pH가 미생물 군집 변화에 영향을 미치며 문 (phylum) 수준에서 미생물 변화에 대한 많은 연구가 이루어졌지만 pH에 따른 속 (genus) 수준에서의 핵심 미생물에 관한 연구는 미미하다. 따라서 본 연구는 속 수준에서 전국 과수원의 중성 토양과 산성 토양을 비교하여 미생물 군집 분석을 수행하였고, 이를 통해 우리는 토양 pH에 따라 민감하게 반응하는 미생물 군집 특성을 활용하여 토양 건전성 평가 지표 개발을 위한 기반을 마련하고자 한다.
Materials and Methods
토양 시료 채취
본 연구를 위해 제주를 포함한 전국 과수원 199지점을 선정하였다. 토양 시료는 2022년 4 - 6월에 과수원 내 비근권 토양 3곳의 표토 (0 - 15 cm)를 채취하여 하나로 혼합하였으며, 온도변화에 따른 토양 시료의 변화를 최소화하기 위해 스티로폼박스에 보관하여 실험실로 운반하였다. 수집된 토양 시료는 2 mm 체로 거른 뒤 미생물 활성의 균일화를 위해 22°C에서 6 - 7일간 배양하였다. 미생물 군집분석을 위한 토양은 -80°C 냉동고에 보존하면서 사용하였다.
토양 화학성 분석
토양 화학성은 풍건 후 2 mm 체로 거른 후 농촌진흥청 분석법에 따라 분석하였다 (NAAS, 2010). 토양 pH와 EC는 1:5법 (w/w)을 이용하여 pH meter, EC meter로 측정하였고, EC값은 측정값에 5를 곱하여 구하였다. 토양 유기물 함량은 Tyurin법에 따라 0.4 N K2Cr2O7 용액으로 분해 후 0.2 N Fe(NH4)2(SO4)2 ‧ 6H2O 용액으로 역적정하여 토양 탄소함량을 구하고 보정계수 (1.724)를 곱하였다. 유효인산은 Lancaster법으로 추출 및 발색 후 비색계로 흡광도를 측정하여 분석하였다. 치환성 양이온 함량은 1 N NH4CH3CO2 (pH 7.0) 1:10 (w/v) 추출액을 inductively coupled plasma optical emission spectroscopy (ICP-OES)로 측정하였다.
DNA 추출 및 시퀀싱
토양시료로부터 DNeasyPowerSoil kit (Qiagen, Germany)를 사용하여 제조사 프로토콜에 따라 토양 미생물 DNA를 추출하였다. 추출된 DNA는 Quant-IT PicoGreen (Invitrogen, USA)을 이용하여 정량하였다.
시퀀싱 라이브러리 구축은 Illumina 16S Metagenomic Sequencing Library 프로토콜에 따라 진행하였다. 5X reaction buffer, 1 mM의 dNTP, 500 nM의 Forward/Reverse PCR 프라이머와 Heruclase II fusion DNA polymerase (Agilent Technologies, USA)를 이용하여 2 ng의 genomic DNA를 증폭하였다. 세균 분석을 위해 V3 - V4 영역의 16S rRNA을 대상으로 하는 프라이머 쌍 (V337F: 5’-T TCGTCGGCAGCGTCAGATGTGTATAAGAGACAGCCTACGGGNGGCWGCAG-3’, V805R: 5’- GTCTCGTGGGCTCGGAGATGTGTATAAGAGACAGGACTACHVGGGTATCTAATCC-3)을, 진균 분석을 위해 ITS3 - ITS4 영역을 대상으로 하는 프라이머 쌍 (ITS3-F: 5’-CCTACGGGNGGCWGCAG-3’, ITS4-R: 5’-GACTACHVGGGTATCTAATCC-3’)을 사용하였으며 PCR 조건은 다음과 같다. 첫 변성은 95°C에서 3분 수행하였고 95°C에서 30초, 55°C에서 30초, 72°C에서 30초의 25사이클 반복 후 72°C에서 5분간 수행하였다. 이렇게 얻어진 PCR 산물은 AMPure 비드 (Agencourt Bioscience, USA)를 사용하여 정제하였고, 정제한 PCR 산물 2 µL를 인덱스가 포함된 최종 라이브러리를 구축하기 위해 NexteraXT Indexed Primer를 사용하여 앞선 PCR 조건의 25사이클 대신 10사이클 조건으로 변경하여 2차 PCR 증폭하였다. 2차 PCR 산물도 동일한 AMPure 비드로 정제하였으며, 최종 정제 산물은 Illumina Sequencing 플랫폼용 KAPA 라이브러리 정량 키트의 프로토콜에 따라 정량 하였다. 2 × 300 bp Paired-end 시퀀싱은 Macrogen Inc. (Republic of Korea)에서 MiSeq™ 플랫폼 (Illumina, USA)을 이용하였다.
MiSeq 시퀀싱 데이터 분석
토양 시료 내 미생물 분석을 위해 16S rRNA 유전자와 ITS 영역의 염기서열 판독은 operational taxonomic unit (OTU)를 기반으로 UPARSE 파이프라인을 사용하여 수행하였다 (Edgar, 2013). 두 쌍의 염기서열을 병합하고 300 bp 이하의 짧은 염기서열은 제거하였다. 이후 중복 염기서열을 제거하였으며, UPARSE-OTU 알고리즘 (https://www.drive5.com)을 통해 상동성 97%를 기준으로 클러스터링하고 키메라를 제거하였다. 위 과정은 USERACH9.1.13_i86linux64을 사용하여 수행하였다. 정제한 OTU 파일은 Mothur 1.46.1 프로그램 (Schloss et al., 2009)을 이용하여 가장 적은 염기서열 수를 기준으로 표준화 하였으며, 종 풍부도 (Chao1, ACE)와 종 균등도 그리고 종 다양성 (Shannon, Invsimpson)을 계산하였다. 또한 생물학적 분석을 위해 세균과 진균은 각각 Ribosomal Database Project (RDP, 062020 version)와 UNITE (10.05.2021 version) 데이터베이스를 사용하여 Mothur 프로그램으로 분류하였다.
미생물 군집 분석
과수원 토양의 세균과 진균의 생명정보분석을 위해 R 프로그램 (4.1.3 version)을 사용하였다. 농촌진흥청 흙토람 플랫폼에서 제공하는 과수원 토양의 적정 pH 기준을 참고하여 중성 범위 (pH 6 - 7)와 산성 범위 (pH 3 - 5)로 나누어 각각 33개, 56개를 선발하여 분석하였다. pH의 중성 범위와 산성 범위에 해당하는 과수원 토양의 미생물 군집 차이를 확인하고자 OTU를 이용한 Bray-Curtis 거리를 기반으로 vegan 패키지의 principal coordinate analysis (PCoA)를 사용하여 측정하였다. 시각화를 위해서는 ggplot2 패키지 (3.3.5 version)를 이용하였다. 두 pH 범위 간 서로 다르게 분포하는 미생물을 탐색하기 위해 analysis of composition of microbiomes with bias correction (ANCOM-BC)를 사용하여 계산하였다 (Lin and Peddada, 2020). 그 전에 계산이 용이하도록 Phyloseq 패키지를 이용하여 OTU 데이터, 생물학적 분류 데이터 그리고 시료 변수 정보 데이터를 병합 및 전처리 하였다 (McMurdie and Holmes, 2013). 결과는 ggplot2 패키지의 volcano plot으로 시각화 하였다. 두 pH 범위 간 다르게 분포하는 미생물들의 상대풍부도는 ANCOM-BC 결과를 기반으로 differential abundance (DA)를 통해 분석하였다. 군집 내 미생물 간 상관관계를 기반으로 영향력을 분석하기 위한 네트워크 분석은 로그 치환된 구성요소 간의 선형 Pearson 상관을 추정하는 sparse correlations for compositional data (SparCC)를 사용하였다. 마찬가지로 ANCOM-BC 결과에서 서로 다른 토양 pH 범위에 유의한 차이를 나타내는 미생물에 한하여 상관 관계를 추론하였다.
통계 분석
통계분석은 R 프로그램 (4.1.3 version)을 사용하여 수행하였다. 알파다양성 수치의 정규분포 여부를 확인하기 위해 샤피로 검정 (Shapiro test)을 하였고, 정규 분포일 때 등분산 검정 (F test)을 하였다. 모집단의 분산이 같을 때와 같지 않을 때 각각 Student T test와 Welch’s T test를 수행하였다. 정규 분포이지 않을 때 비모수 검정으로 Wilcoxon test를 수행하였다. PCoA의 유의성 검정을 위해 vegan 패키지의 adonis 기능을 사용하여 permutational multivariate analysis of variance (PERMANOVA)를 수행하였다.
Results and Discussion
토양의 이화학성 중에 토양 미생물 군집에 가장 큰 영향을 미치는 요인은 pH로 알려져 있다 (Fierer and Jackson, 2006; Constancias et al., 2015). 본 연구는 농촌진흥청 흙토람 플랫폼에서 제공하는 과수원 토양의 화학성 기준을 토대로 적정 pH인 중성 범위와 산성 범위의 두 개 pH범위를 선정하였다. 전국 과수원 토양 199지점 중 중성 범위 63지점과 산성 범위 26지점을 선별하여 토양 내 세균과 진균의 알파다양성을 비교하였다 (Fig. 1). 그 결과, 중성 범위의 세균 종 풍부도 (Chao1 지수, Welch T test, P < 0.001***)와 종 다양성 (Shannon 지수,Wilcoxon test, P < 0.001***) 평균치는 각각 4,583과 6.7로 산성 범위의 3,079와 6.1에 비해 유의성 있게 높았다. 진균의 경우는 중성 범위의 종 풍부도 평균치는 879로 산성 범위 701에 비해 유의성 있게 높은 반면 Shannon 지수 (Student T test, P = 0.3)는 유의한 차이가 없었다. 이는 선행 연구에서 토양 pH가 중성에서 세균의 종 풍부도와 종 다양성이 산성일 때보다 높다라는 결과와 유사하다 (Fierer and Jackson, 2006; Lee et al., 2020). 세균의 경우 대부분이 세포 내 pH가 중성에 가깝기 때문에 토양의 산성 pH는 특정 세균을 제외한 대부분의 세균에 상당한 스트레스를 줄 수 있다 (Lauber et al., 2009). 따라서 산성 pH 범위에서 미생물의 성장과 활성이 감소하여 종 풍부도와 종 다양성이 낮았던 것으로 판단된다. 작물 또한 중성 토양에서 생육이 활발하기 때문에 (Läuchli and Grattan, 2012), 중성 pH에서 미생물 특성이 작물과 직접적인 연관성이 있는 지 근권 토양에 대한 추가적인 연구를 통해 확인할 필요가 있다. 그러나 비근권 토양이더라도 토양 내 미생물이 풍부하고 다양할수록 토양 탄소 및 질소의 순환이 원활하고 토양 병이 억제되는 등 긍정적인 간접 효과가 있기 때문에 pH에 따른 미생물 군집의 알파 다양성 변화는 충분히 토양 건전성을 평가할 수 있을 것으로 판단된다.
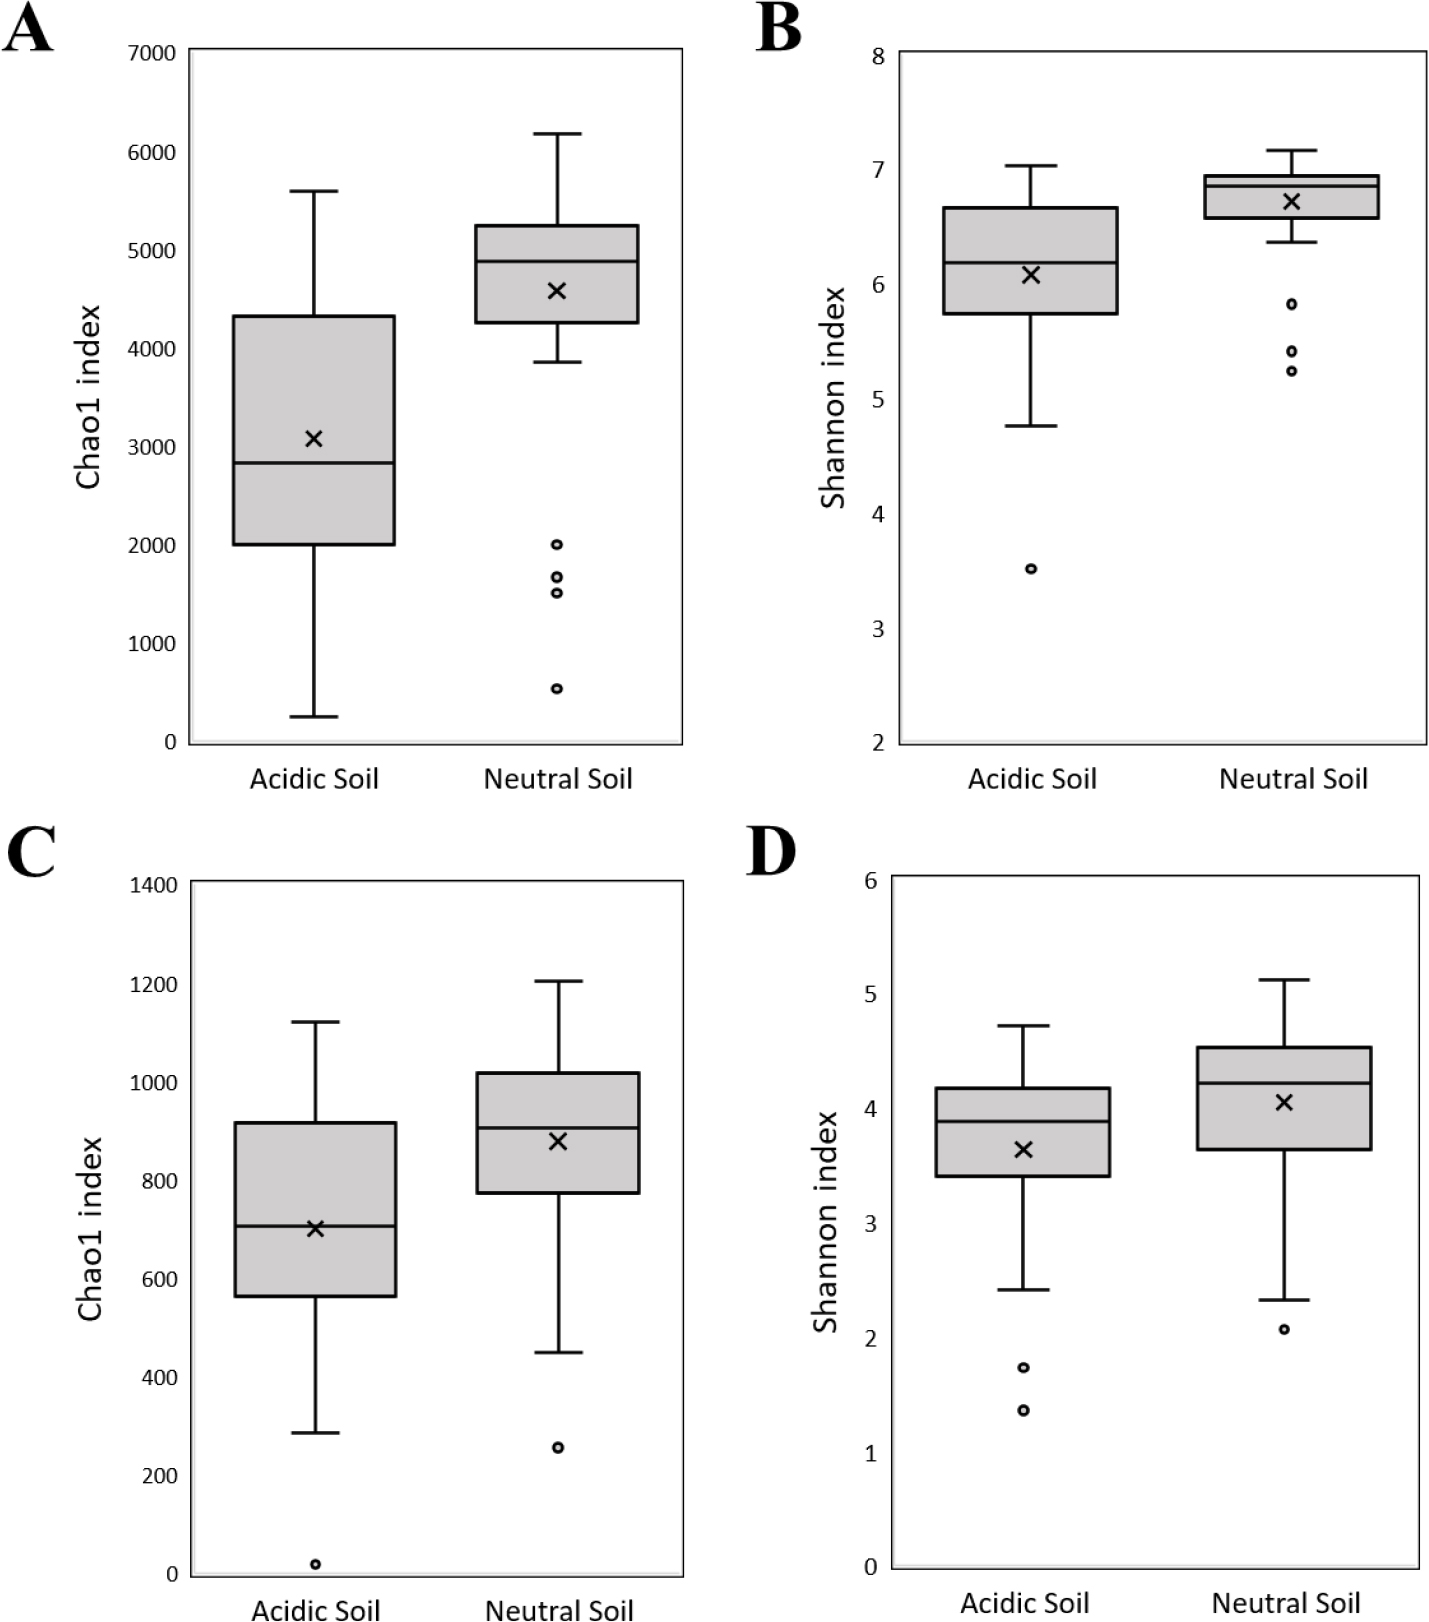
Fig. 1.
Comparison of microbial alpha diversity in orchard soils according to pH range. Box plots represent richness and diversity of microorganisms in the range of soil pH 3 - 5 (acidic Soil) and 6 - 7 (neutral Soil). Chao1 and Shannon index indicate microbial richness and diversity, respectively. (A) Chao1, (B) Shannon of bacteria and (C) Chao1 of fungi were significantly higher in the neutral soil (P < 0.001***), but (D) Shannon of fungi was not (P = 0.3).
PCoA 분석
토양 내 미생물 분포를 비교하고 차이를 파악하기 위해 PCoA를 사용하여 세균과 진균의 과 (family) 수준에서 두 pH 그룹 간 군집 조성과 거리를 측정하였다 (Fig. 2). 두 그룹은 세균의 경우 첫 번째 요인 (PCo1: 15.2%)에 의해 분리되었고, 진균의 경우 마찬가지로 첫 번째 요인 (PCo1: 4%)에 의해 분리되었다. 이 결과는 adonis 기능을 이용한 PERMANOVA (P = 0.001***)에서 통계적으로 유의한 차이가 있는 것으로 나타났다. 따라서 토양 pH에 따라 세균과 진균 군집이 달라지는 것을 확인하였고 이전 연구 결과와 유사한 경향을 보였다 (Fierer and Jackson, 2006). 본 연구는 수종의 영향이 매우 적을 것으로 판단되나 조사 대상 지점 중 귤을 재배하는 제주 토양의 경우, 제주 화산회 토양이 내륙 토양과 달라 미생물 군집 구조에 영향을 주었을 것으로 추정된다.
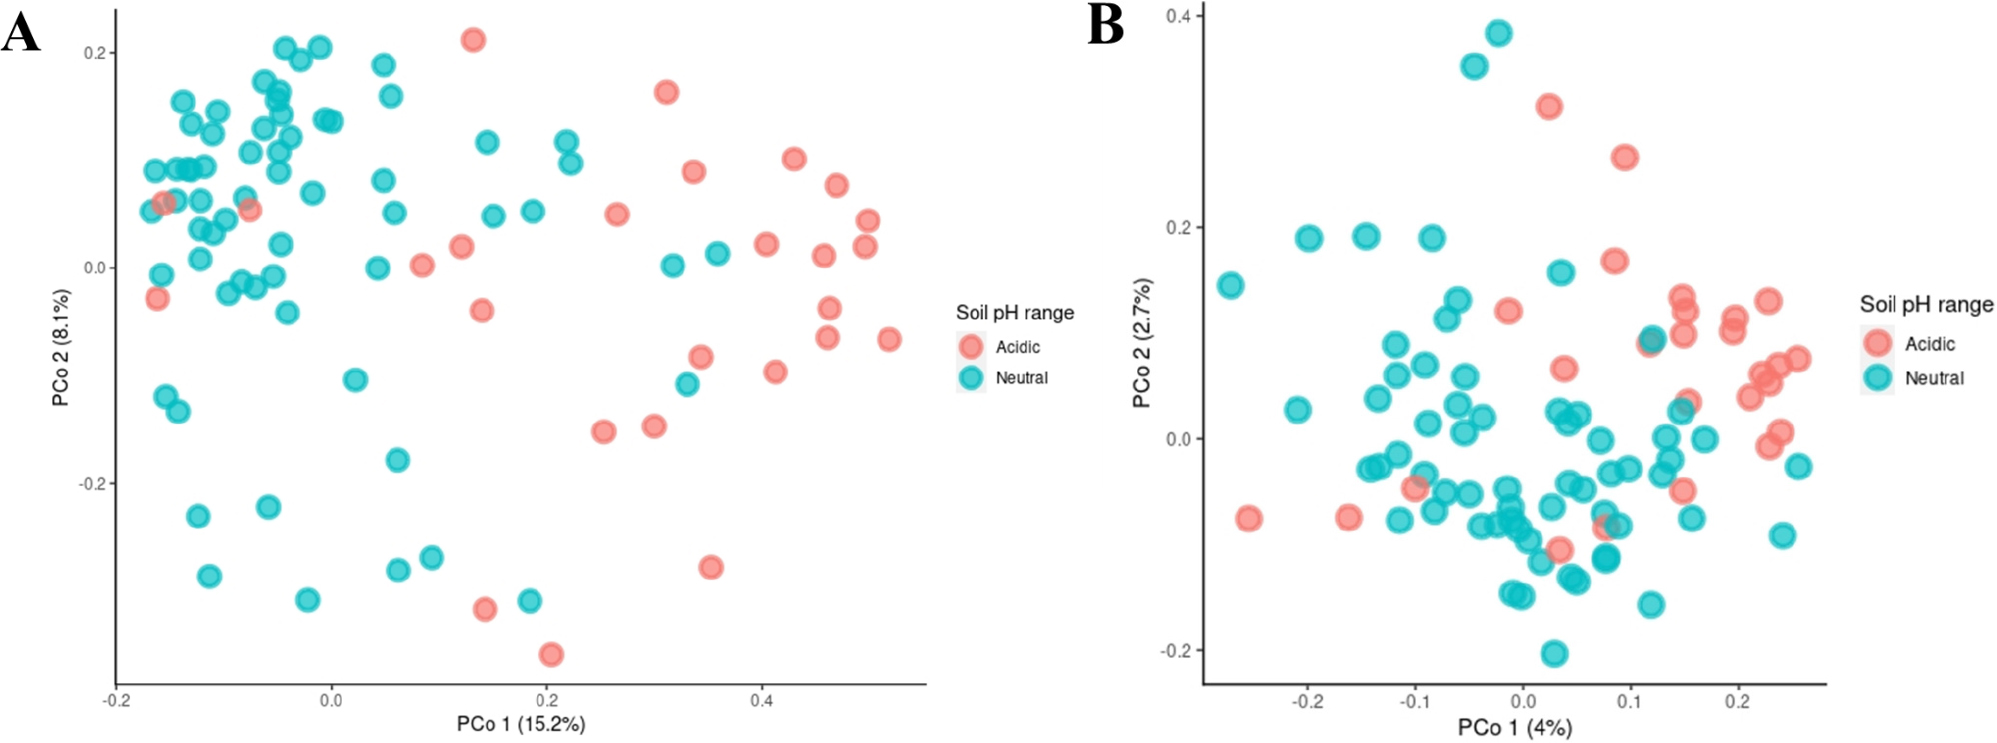
Fig. 2.
PCoA for the analysis of differences in microbial communities according to pH range. The red and blue nodes represent microbial communities at the family level in the acidic and neutral soil, respectively. Both (A) bacteria and (B) fungi showed a significant difference between the soil pH range as a result of the PERMANOVA test (P = 0.001).
ANCOM-BC
우리는 PCoA를 통해 과수원 토양 pH에 따른 두 그룹의 미생물 군집이 유의한 차이가 있는 것을 확인하였고, 두 그룹 토양 내 서로 다르게 분포하는 미생물들을 파악하기 위해 속 (genus) 수준에서 ANCOM-BC를 수행하였다 (Fig. 3). 그래프의 x축은 Log Fold Change (LFC) 값으로, 판별 효과를 나타내며 y축은 유의성을 나타내는 q값 (adjust p value)이다. 붉은 선은 결과 해석을 용이하게 하기 위한 한계 값이며, LFC 값은 세균의 경우 ±2, 진균의 경우 ±1로 설정하였고 q값은 세균과 진균 모두 0.01로 설정하였다. LFC 값이 클수록 즉, 양쪽으로 멀리 떨어질수록 두 그룹 간 다르게 분포하는 미생물로 해석할 수 있다. 그 결과, 세균은 Chujaibacter, Streptococcus, Ktedonobacter 등 8개 속이 중성 범위에 비해 산성 범위에서 많이 분포하였고, Acidobacteria에 속하는 Gp4_unclassified와 Gp11_unclassified 그리고 Povalibacter와 Chryseolinea 등 16개 속이 산성 범위에 비해 중성 범위에서 많이 분포하였다. 진균은 Saitozyma, Umbelopsis, Penicillium을 비롯한 10개 속이 중성 범위에 비해 산성 범위에서 많이 분포하였고, Gibellulopsis, Titaea, Mrakia을 비롯한 15개 속이 산성 범위에 비해 중성 범위에서 많이 분포하였다.
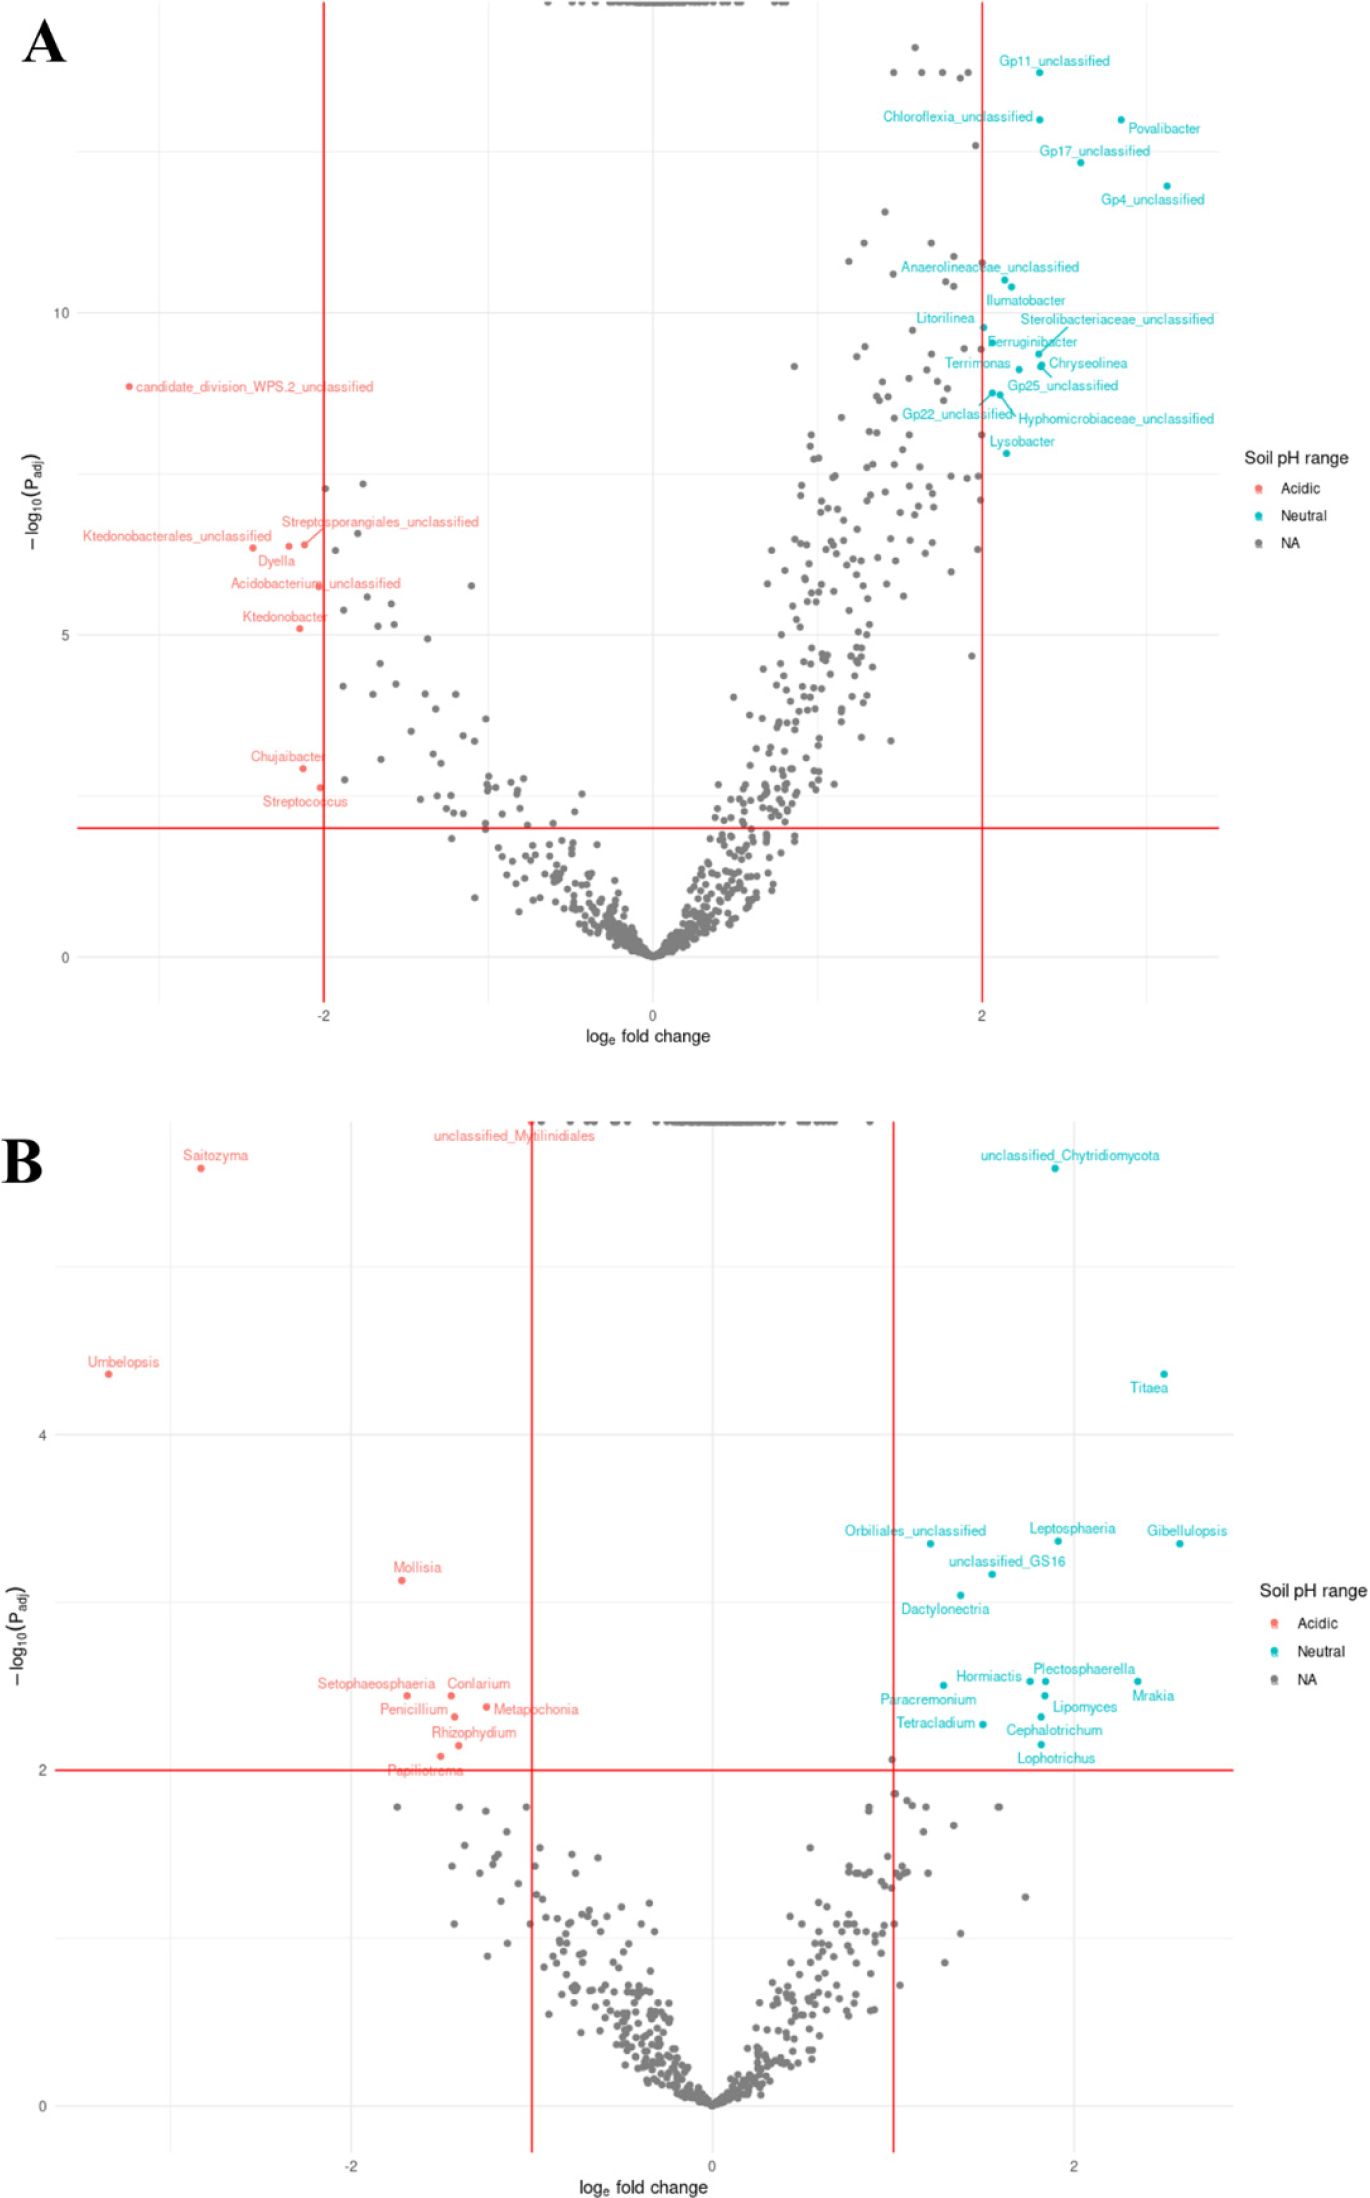
Fig. 3.
Volcano plot to identify differences in microorganisms of soil pH range at the genus level. The plots based on ANCOM-BC analysis of (A) bacteria and (B) fungi in orchard soils. The red line represents the difference in expression of microorganisms in the pH range and regulation according to significance (q < 0.001). Red and blue nodes suggest genus of microorganism significantly abundant in the acidic and neutral soil, respectively, by the red line.
ANCOM-BC를 통해 도출된 미생물 속의 해당 pH 범위 토양 내 분포 비율을 확인하고자 DA 분석을 수행하였다 (Fig. 4). 이를 통해 실제 토양에선 분포 비율이 매우 낮더라도 ANCOM-BC 결과에서 높은 LFC와 유의성을 나타내어 큰 영향을 미치는 주요 미생물로 잘못 해석할 수 있는 오류를 방지하였다. 그 결과, 토양 내 세균 및 진균의 상대풍부도가 0.5% 이상인 속은 각각 Povalibacter, Chujaibacter, Saitozyma, Lophotrichus 등이고, 이들은 중성 pH 범위와 산성 범위 간 최소 약 2배에서 최대 10배 이상 차이가 났다. 흥미롭게도 세균 속인 Streptococcus와 진균 속인 Umbelopsis는 중성 pH 범위 대비 산성 범위에서 각각 34배, 15배 이상 많이 존재하였다. 이 결과는 Streptococcus 일부 종의 풍부도가 토양 pH와 음의 상관관계를 나타낸다는 이전 연구와 유사하였다 (Zhao et al., 2015). 또한 Streptococcus는 대장균과 함께 토양 및 수질오염의 지표 역할을 하는데 (Van Donsel et al., 1967; Kibbey et al., 1978; Massa et al., 2001; Zhao et al., 2015; Al-Taai, 2021), 본 연구의 산성 토양 pH 범위에서 많이 분포하는 결과의 원인은 해당 지점의 사용 비료 종류 및 시용량의 영향이 있을 것으로 추정된다. 하지만 pH 외의 많은 환경 변수가 영향을 미치기 때문에 자세한 연구를 통한 원인 분석이 필요하다.
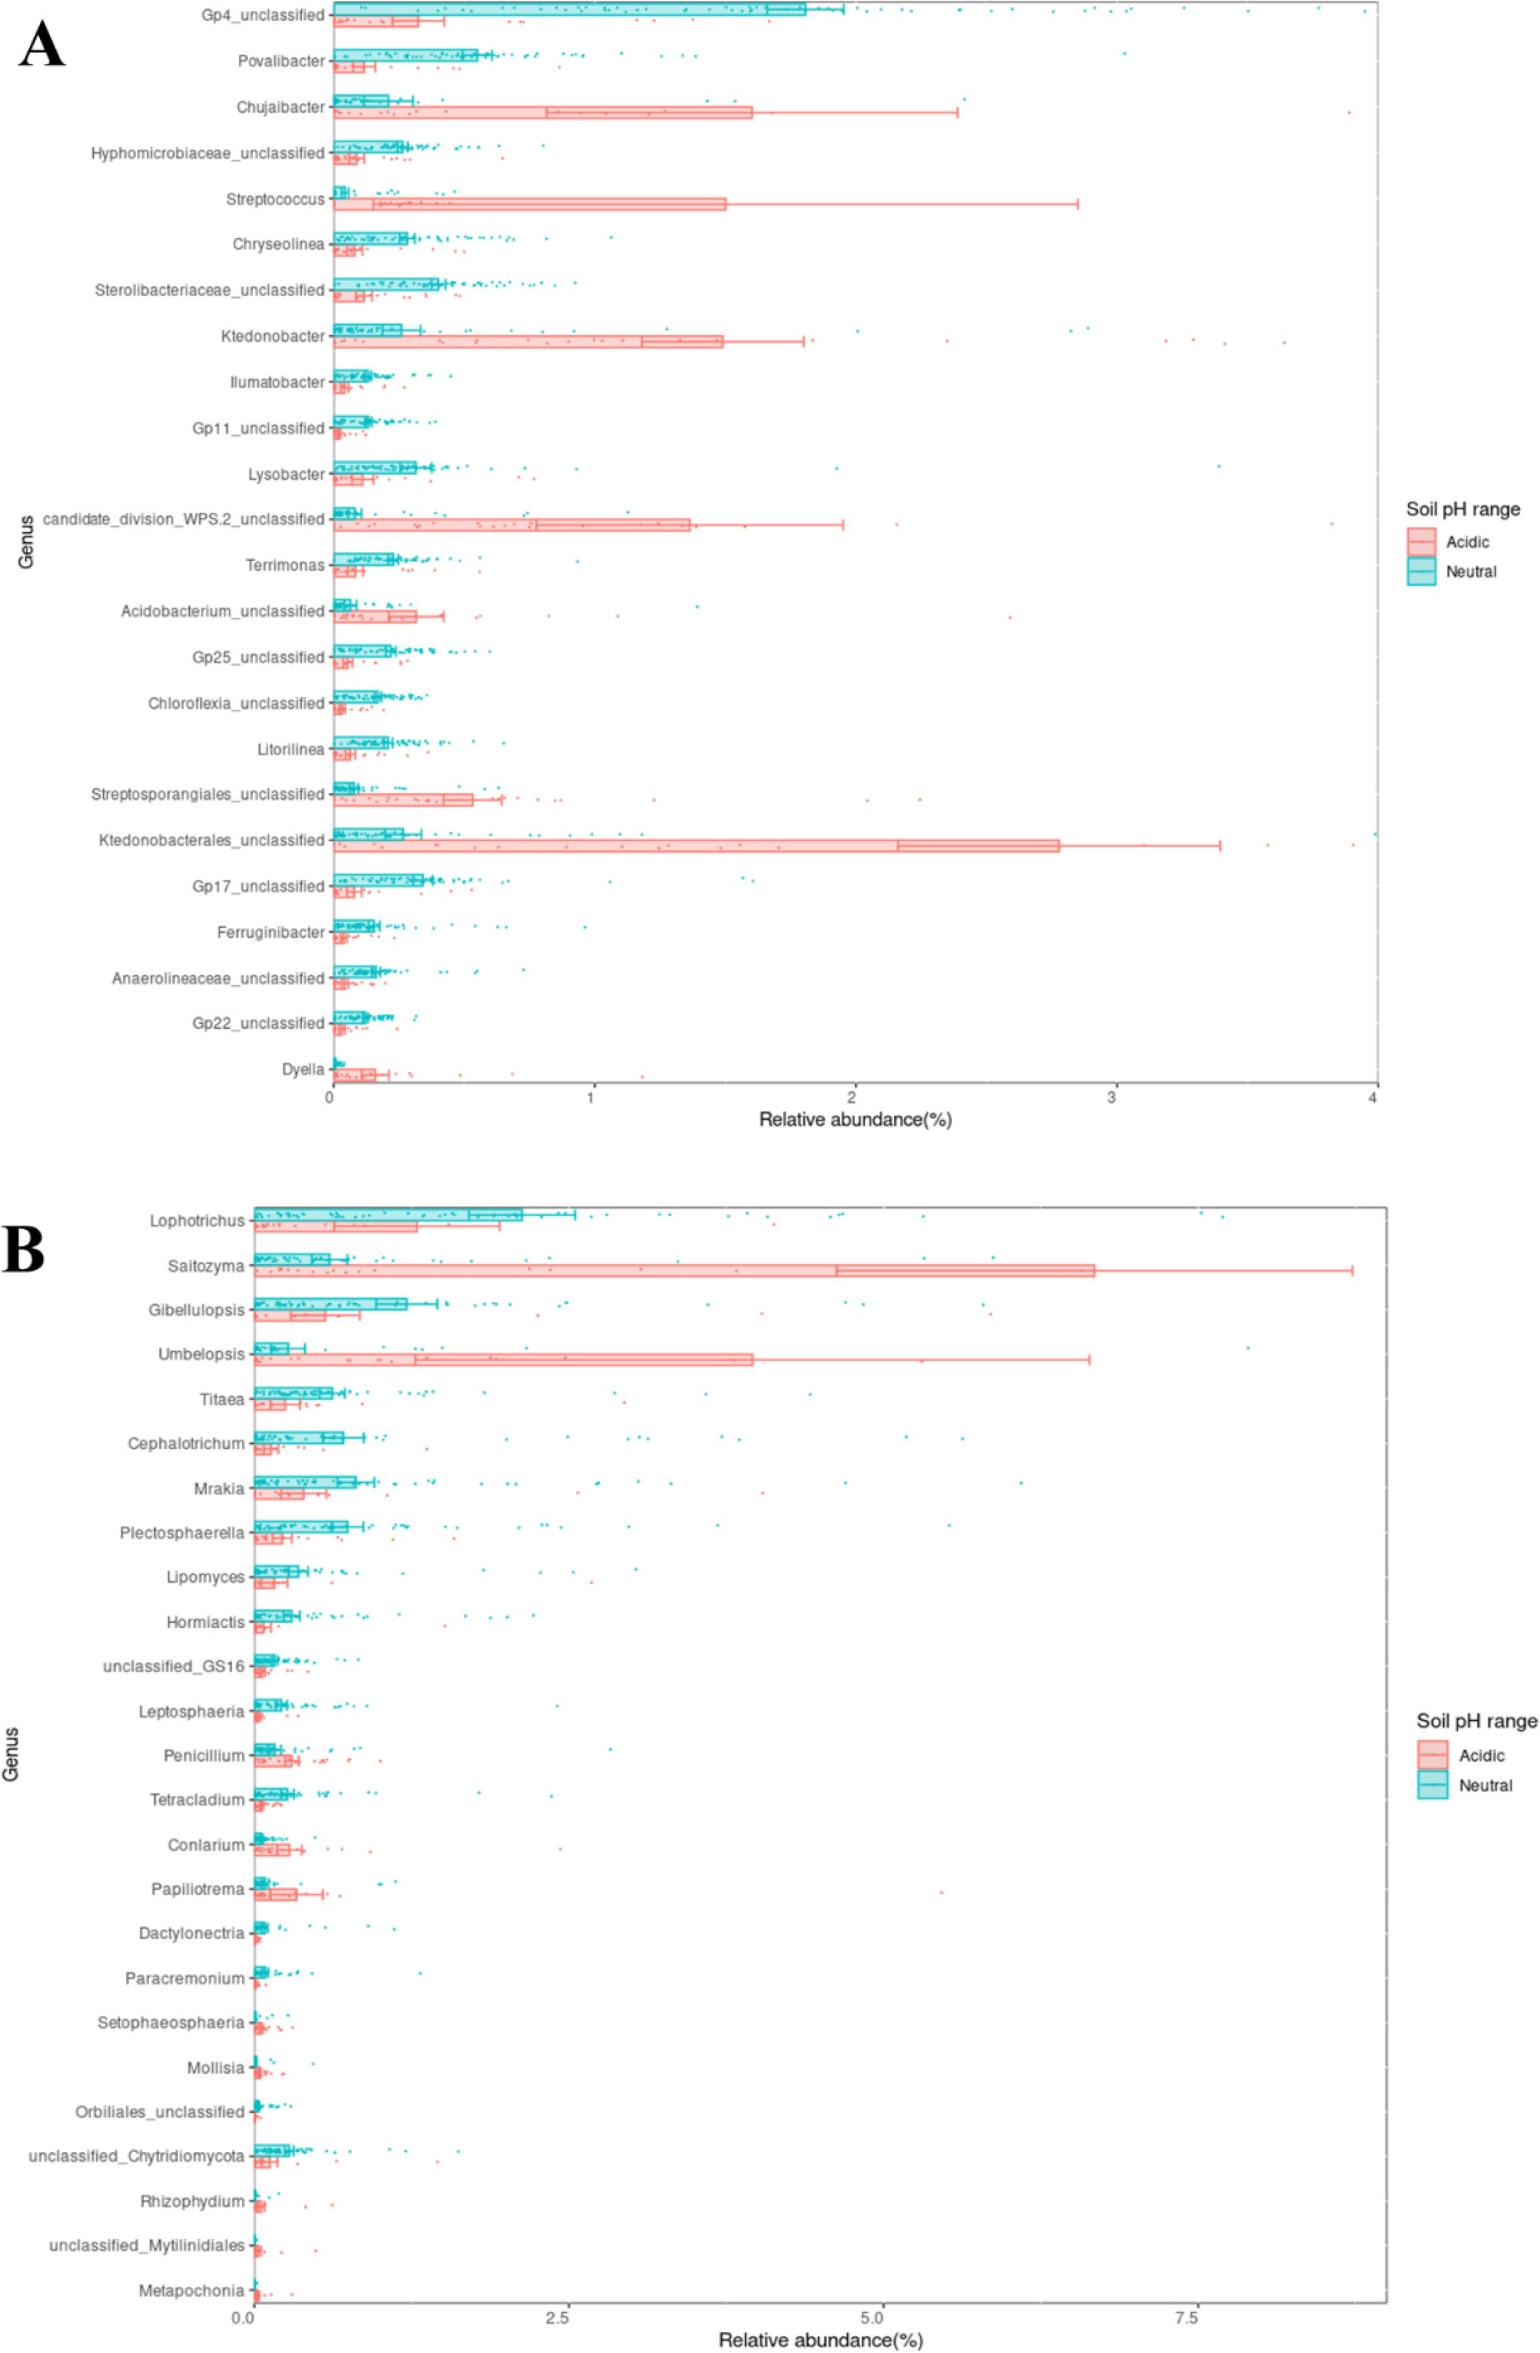
Fig. 4.
Differential abundance (DA) analysis based on ANCOM-BC. It shows the distribution of microbial genera with significant differences in each soil pH range. Red and blue bars mean the distribution ratio (%) of microorganisms, which are (A) bacteria and (B) fungi, in the acidic and neutral soil, respectively.
Network analysis
미생물 keystone 분류군은 시공간적으로 항상 존재하면서 미생물 군집 구조와 기능에 상당한 영향을 미치는 분류군으로 정의된다 (Banerjee et al., 2018; Mamet et al., 2019). 따라서 특정 미생물이 두 pH 범위 간 유의한 차이로 존재하며 상대풍부도가 높고 미생물 간 상관관계가 높으면 토양 pH에 따른 주요 미생물일 것이라는 가정 하에 SparCC 네트워크 분석을 하였다 (Fig. 5). 초록 선은 정의 상관관계를, 두께는 상관관계 값을 나타낸다 (|Correlation| > 0.7, P value < 0.001). 반면 주황 선은 부의 상관관계를 의미하지만 존재하지 않았다. 파란 원형 노드는 ANCOM-BC 기반 중성 pH 범위에 유의적으로 분포하는 분류군이며 빨간 원형 노드는 산성 pH 범위에 분포하는 분류군이다. Eigenvector centrality는 노드의 전이적 영향을 측정하는 알고리즘으로, 네트워크 연결을 점수로 할당하여 해당 노드의 영향을 측정하는 개념이다 (Bonacich, 2007; Lee et al., 2022). 노드의 크기는 Eigenvector centrality의 수치 (0.00 - 1.00)를 반영하는데, 클수록 더 많은 네트워크를 형성하는 분류군 임을 의미하며 빨간 테두리로 표시하였다 (Eigenvector centrality > 0.6). 그 결과, 세균의 경우 146개 속의 네트워크를 확인하였다. 중성 범위와 산성 범위에 분포하는 속은 각각 16개, 7개였으며 주요 속 (keystone taxa)은 15개였다. 진균의 경우 62개 속의 네트워크를 확인하였다. 중성 범위와 산성 범위에 분포하는 속은 각각 12개, 3개였으며 주요 속은 6개였다. 이 중에서 중성 범위 토양의 주요 세균 속은 9개 (Terrimonas, Povalibacter, Gp11_unclassified, Gp22_unclassified, Chloroflexia_unclassified, Sterolibacteriaceae_unclassified, Hyphomicrobiaceae_unclassified, GP17_unclassified, Gp4_unclassified)가 확인되었지만 산성 범위 토양의 주요 세균 속은 확인되지 않았다. 또한 진균은 중성 및 산성 범위 모두 주요 속은 확인되지 않았다. 미생물 간 많은 네트워크를 형성하는 미생물은 핵심 분류군으로서 많은 영향을 미칠 것이라는 이전 연구에 의하면 (Layeghifard et al., 2017; Mamet et al., 2019), Terrimonas와 Povalibacter를 비롯한 9개의 세균 속은 과수원 토양에서 적절한 pH 범위의 주요 미생물로 판단된다. 비록 분류는 되지 않았지만 Acidobacteria 문에 속하는 Gp 분류군 중 Gp1 - 3은 pH 3.5 - 5.0인 산림 토양에서 풍부한 반면 Gp4 - 7 및 Gp10은 pH 4.5 - 9.5에서 우세하다는 Kim et al. (2021)의 연구 결과와 유사한 경향이었다. 특히 Bacteroidota에 속하는 Terrimonas는 산림 토양에 풍부하여 다른 분류군과 많이 상호 작용하는 것으로 알려져 있는그람 음성, 호기성 균이다 (Fierer et al., 2007). Lu et al. (2023)에 따르면 높은 토양 유기 탄소 농도는 Terrimonas를 풍부하게 하는 경향이 있었고, Karimi et al. (2019)은 Terrimonas를 비교적 유기물 함량이 높고 미생물 네트워크 형성이 많은 산림과 초원 토양의 핵심 미생물로 보고한 바 있다. Gammaproteobacteria에 속하는 Povalibacter는 Siles and Margesin (2017)에 의하면 토양 유기물 (soil organic matter, SOM)과 토양 유기 탄소가 통계적으로 유의하게 높은 토양에서 풍부하였다. 이전 연구와 더불어 본 연구 결과에 따르면 Terrimonas와 Povalibacter가 이화학적 측면에서 안정적인 토양의 미생물 지표로 활용될 수 있음을 시사한다. 게다가 산성 토양일수록 칼슘, 아연 등 작물이 이용하는 이온 수가 적어지며 작물의 원소 불균형을 초래하는 점을 고려하였을 때 (Sims, 1986; Zhao et al., 2011), 중성 토양의 주요 미생물 9개는 과수원 토양의 좋은 세균 지표가 될 것으로 판단된다. 앞으로 데이터베이스 최신화에 따라 미분류군의 동정을 통한 자세한 분류가 필요하며 미생물의 역할과 기능에 관한 추가적인 연구가 필요하다.
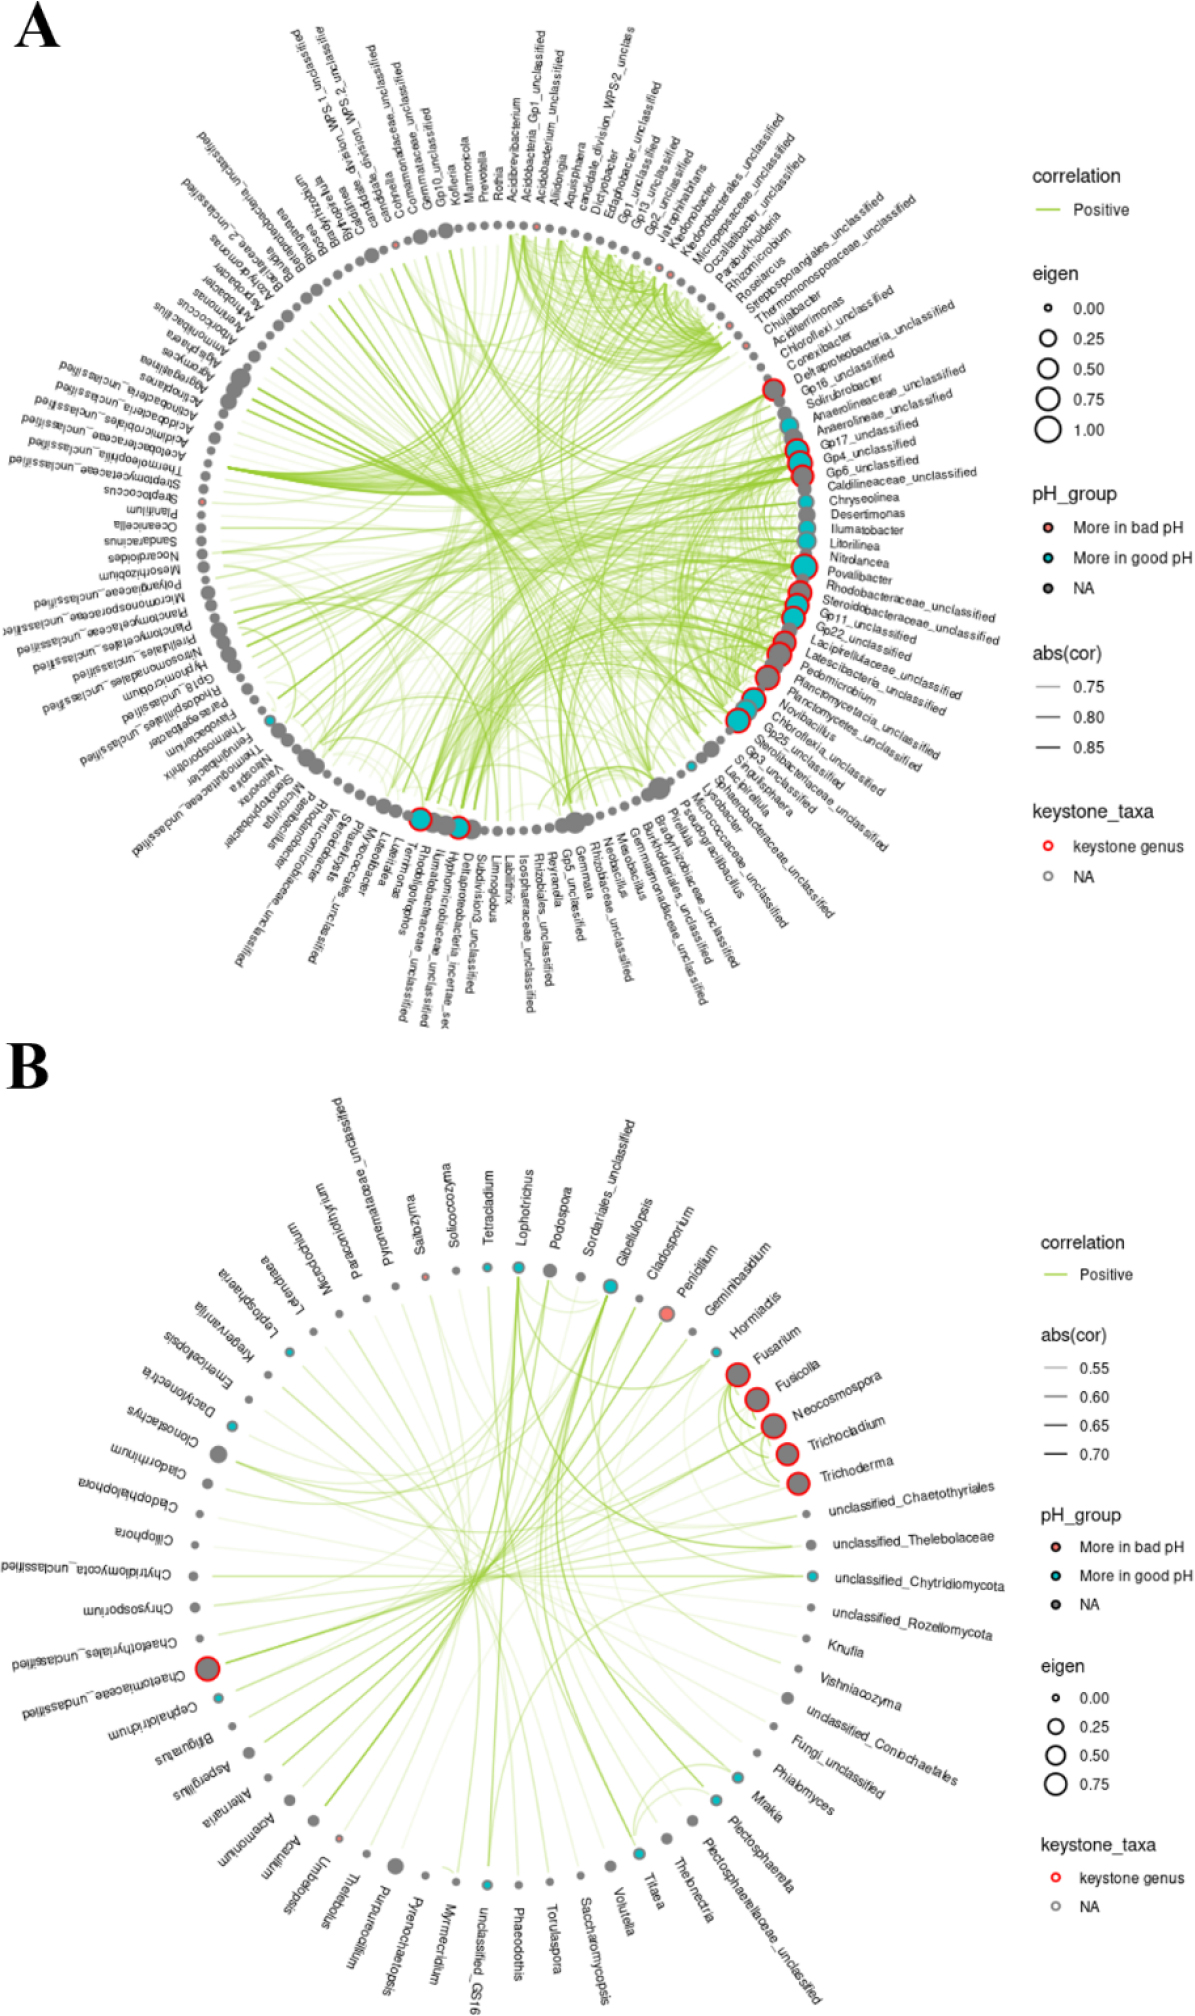
Fig. 5.
Network analysis based on ANCOM-BC and DA analysis to explore key microorganism genera in acidic and neutral soils. In the community network of (A) bacteria and (B) fungi, red and blue nodes represent of microorganisms distributed in the acidic and neutral soil, respectively. The node size appears larger as the eigenvector centrality is higher, and 0.7 or more is marked with a red border.
Conclusions
본 연구는 토양 미생물과 토양 pH 간의 관계를 분석하기 위하여 전국 과수원의 중성 pH 범위 토양 56개와 산성 pH 범위 토양 23개의 미생물 군집을 비교 분석하였다. 중성 범위의 세균 풍부도와 다양성, 진균 풍부도는 산성 범위에 비해 통계적으로 유의하게 높았다 (P < 0.001). PCoA와 PERMANOVA에 따르면 두 범위 간 미생물 군집 조성과 거리는 크게 달랐으며 (P < 0.001), ANCOM-BC는 중성 토양에서 16개 세균과 15개 곰팡이 속의 높은 풍부도를 나타냈다. 마지막으로 Terrimonas와 Povalibacter를 포함한 9개 속이 중성 범위에서 다른 미생물 분류군에 중요한 영향을 미치는 핵심 미생물로 확인되었다. 앞으로 토양 pH 외 물리화학성 또는 작물 생육 등의 요인을 기준으로 적합 또는 부적합 토양을 나누어 토양 미생물 군집을 분석하고, 단일 요인 또는 다중 요인 별 핵심 미생물을 탐색한다면 보다 정확한 토양질을 평가하는 미생물 지표를 개발할 수 있을 것으로 판단된다.
Acknowledgements
This work was supported by Rural Development Administration (Project No. RS-2021-RD009707), Republic of Korea.
References
Al-Taai, S.H.H. 2021. Soil pollution-causes and effects. IOP Conf. Ser.: Earth Environ. Sci. 790:012009.
10.1088/1755-1315/790/1/012009Aziz, I., T. Mahmood, and K.R. Islam. 2013. Effect of long term no-till and conventional tillage practices on soil quality. Soil Tillage Res. 131:28-35.
10.1016/j.still.2013.03.002Bais, H.P., T.L. Weir, L.G. Perry, S. Gilroy, and J.M. Vivanco. 2006. The role of root exudates in rhizosphere interactions with plants and other organisms. Annu. Rev. Plant Biol. 57:233-266.
10.1146/annurev.arplant.57.032905.10515916669762Bakker, M.G., J.M. Chaparro, D.K. Manter, and J.M. Vivanco. 2015. Impacts of bulk soil microbial community structure on rhizosphere microbiomes of
Zea mays. Plant Soil 392:115-126.
10.1007/s11104-015-2446-0Banerjee, S., K. Schlaeppi, and M.G. van der Heijden. 2018. Keystone taxa as drivers of microbiome structure and functioning. Nat. Rev. Microbiol. 16:567-576.
10.1038/s41579-018-0024-129789680Bartram, A.K., X. Jiang, M.D. Lynch, A.P. Masella, G.W. Nicol, J. Dushoff, and J.D. Neufeld. 2014. Exploring links between pH and bacterial community composition in soils from the Craibstone Experimental Farm. FEMS Microbiol. Ecol. 87:403-415.
10.1111/1574-6941.1223124117982Bohlool, B.B., J.K. Ladha, D.P. Garrity, and T. George. 1992. Biological nitrogen fixation for sustainable agriculture: A perspective. Plant Soil 141:1-11.
10.1007/BF00011307Bonacich, P. 2007. Some unique properties of eigenvector centrality. Soc. Networks 29:555-564.
10.1016/j.socnet.2007.04.002Brimecombe, M.J., F.A. De Leij, and J.M. Lynch. 2000. The effect of root exudates on rhizosphere microbial populations. p. 95-140. In R. Pinton et al. (ed.) The rhizosphere: Biochemistry and organic substances at the soil-plant interface. CRC Press, Boca Raton, FL, USA.
Cha, J.Y., S. Han, H.J. Hong, H. Cho, D. Kim, Y. Kwon, S.K. Kwon, M. Crüsemannr, Y.B. Lee, J.F. Kim, G. Giaever, C. Nislow, B.S. Moore, L.S. Thomashow, D.M. Weller, and Y.S. Kwak. 2016. Microbial and biochemical basis of a Fusarium wilt-suppressive soil. ISME J. 10:119-129.
10.1038/ismej.2015.9526057845PMC4681868Chodak, M., M. Gołębiewski, J. Morawska-Płoskonka, K. Kuduk, and M. Niklińska. 2015. Soil chemical properties affect the reaction of forest soil bacteria to drought and rewetting stress. Ann. Microbiol. 65:1627-1637.
10.1007/s13213-014-1002-026273241PMC4529456Compant, S., M.G. Van Der Heijden, and A. Sessitsch. 2010. Climate change effects on beneficial plant-microorganism interactions. FEMS Microbiol. Ecol. 73:197-214.
10.1111/j.1574-6941.2010.00900.x20528987Constancias, F., S. Terrat, N.P. Saby, W. Horrigue, J. Villerd, J.P. Guillemin, L. Biju-Duval, V. Nowak, S. Dequiedt, L. Ranjard, and N.C. Prévost-Bouré. 2015. Mapping and determinism of soil microbial community distribution across an agricultural landscape. MicrobiologyOpen 4:505-517.
10.1002/mbo3.25525833770PMC4475391Dewen, Q., D. Yijie, Z. Yi, L. Shupeng, and S. Fachao. 2017. Plant immunity inducer development and application. Mol. Plant-Microbe Interact. 30:355-360.
10.1094/MPMI-11-16-0231-CR28323528Edgar, R.C. 2013. UPARSE: Highly accurate OTU sequences from microbial amplicon reads. Nat. Methods 10:996-998.
10.1038/nmeth.260423955772Fierer, N. 2017. Embracing the unknown: Disentangling the complexities of the soil microbiome. Nat. Rev. Microbiol. 15:579-590.
10.1038/nrmicro.2017.8728824177Fierer, N. and R.B. Jackson. 2006. The diversity and biogeography of soil bacterial communities. Proc. Natl. Acad. Sci. 103:626-631.
10.1073/pnas.050753510316407148PMC1334650Fierer, N., M.A. Bradford, and R.B. Jackson. 2007. Toward an ecological classification of soil bacteria. Ecology 88:1354-1364.
10.1890/05-183917601128Goulding, K.W.T. 2016. Soil acidification and the importance of liming agricultural soils with particular reference to the United Kingdom. Soil Use Manage. 32:390-399.
10.1111/sum.1227027708478PMC5032897Hemkemeyer, M., S.A. Schwalb, S. Heinze, R.G. Joergensen, and F. Wichern. 2021. Functions of elements in soil microorganisms. Microbiol. Res. 252:126832.
10.1016/j.micres.2021.12683234508963Hermans, S.M., H.L. Buckley, B.S. Case, F. Curran-Cournane, M. Taylor, and G. Lear. 2017. Bacteria as emerging indicators of soil condition. Appl. Environ. Microbiol. 83:e02826-16.
10.1128/AEM.02826-1627793827PMC5165110Karimi, B., S. Dequiedt, S. Terrat, C. Jolivet, D. Arrouays, P. Wincker, C. Cruaud, A. Bisop, N.C. Prévost-Bouré, and L. Ranjard. 2019. Biogeography of soil bacterial networks along a gradient of cropping intensity. Sci. Rep. 9:3812.
10.1038/s41598-019-40422-y30846759PMC6405751Khan, K.S., R. Mack, X. Castillo, M. Kaiser, and R.G. Joergensen. 2016. Microbial biomass, fungal and bacterial residues, and their relationships to the soil organic matter C/N/P/S ratios. Geoderma 271:115-123.
10.1016/j.geoderma.2016.02.019Kibbey, H.J., C. Hagedorn, and E.L. McCoy. 1978. Use of fecal streptococci as indicators of pollution in soil. Appl. Environ. Microbiol. 35:711-717.
10.1128/aem.35.4.711-717.1978417673PMC242911Kim, H.S., S.H. Lee, H.Y. Jo, K.T. Finneran, and M.J. Kwon. 2021. Diversity and composition of soil
Acidobacteria and
Proteobacteria communities as a bacterial indicator of past land-use change from forest to farmland. Sci. Total Environ. 797:148944.
10.1016/j.scitotenv.2021.14894434298360Kim, J.M., A.S. Roh, S.C. Choi, E.J. Kim, M.T. Choi, B.K. Ahn, S.K. Kim, Y.H. Lee, J.H. Joa, S.S. Kang, S.A. Lee, J.H. Ahn, J. Song, and H.Y. Weon. 2016. Soil pH and electrical conductivity are key edaphic factors shaping bacterial communities of greenhouse soils in Korea. J. Microbiol. 54:838-845.
10.1007/s12275-016-6526-527888456Kim, J.W., Y.K. Hong, C.R. Lee, and S.C. Kim. 2023. Comparison of physicochemical and biological soil properties in organic and conventional upland fields. Korean J. Soil Sci. Fert. 56:77-89.
10.7745/KJSSF.2023.56.1.077Lamb, E.G., N. Kennedy, and S.D. Siciliano. 2011. Effects of plant species richness and evenness on soil microbial community diversity and function. Plant Soil 338:483-495.
10.1007/s11104-010-0560-6Lauber, C.L., M. Hamady, R. Knight, and N. Fierer. 2009. Pyrosequencing-based assessment of soil pH as a predictor of soil bacterial community structure at the continental scale. Appl. Environ. Microbiol. 75:5111-5120.
10.1128/AEM.00335-0919502440PMC2725504Läuchli, A. and S.R. Grattan. 2012. Soil pH extremes. p. 194-209. In S. Shabala (ed.) Plant stress physiology. CABI, Wallingford, CT, USA.
10.1079/9781845939953.0194Layeghifard, M., D.M. Hwang, and D.S. Guttman. 2017. Disentangling interactions in the microbiome: A network perspective. Trends Microbiol. 25:217-228.
10.1016/j.tim.2016.11.00827916383PMC7172547Lee, K.K., H. Kim, and Y.H. Lee. 2022. Cross-kingdom co-occurrence networks in the plant microbiome: Importance and ecological interpretations. Front. Microbiol. 13:953300.
10.3389/fmicb.2022.95330035958158PMC9358436Lee, S.A., J.M. Kim, Y. Kim, J.H. Joa, S.S. Kang, J.H. Ahn, M. Kim, J. Song, and H.Y. Weon. 2020. Different types of agricultural land use drive distinct soil bacterial communities. Sci. Rep. 10:17418.
10.1038/s41598-020-74193-833060673PMC7562711Lin, H. and S.D. Peddada. 2020. Analysis of compositions of microbiomes with bias correction. Nat. Commun. 11:3514.
10.1038/s41467-020-17041-732665548PMC7360769Lu, T., N. Xu, C. Lei, Q. Zhang, Z. Zhang, L. Sun, F. He, N.Y. Zhou, J. Peñuelas, Y.G. Zhu, and H. Qian. 2023. Bacterial biogeography in China and its association to land use and soil organic carbon. Soil Ecol. Lett. 5:230172.
10.1007/s42832-023-0172-8Lynch, J.M. and E. Bragg. 1985. Microorganisms and soil aggregate stability. p. 133-171. In B.A. Stewart (ed.) Advances in soil science: Volume 2. Springer, Manhattan, NY, USA.
10.1007/978-1-4612-5088-3_3Mamet, S.D., E. Redlick, M. Brabant, E.G. Lamb, B.L. Helgason, K. Stanley, and S.D. Siciliano. 2019. Structural equation modeling of a winnowed soil microbiome identifies how invasive plants re-structure microbial networks. ISME J. 13:1988-1996.
10.1038/s41396-019-0407-y30926920PMC6776034Marschner, P., D. Crowley, and C.H. Yang. 2004. Development of specific rhizosphere bacterial communities in relation to plant species, nutrition and soil type. Plant Soil 261:199-208.
10.1023/B:PLSO.0000035569.80747.c5Massa, S., G.F. Brocchi, G. Peri, C. Altieri, and C. Mammina. 2001. Evaluation of recovery methods to detect faecal streptococci in polluted waters. Lett. Appl. Microbiol. 32:298-302.
10.1046/j.1472-765X.2001.00904.x11328493Matos, A., L. Kerkhof, and J.L. Garland. 2005. Effects of microbial community diversity on the survival of
Pseudomonas aeruginosa in the wheat rhizosphere. Microb. Ecol. 49:257-264.
10.1007/s00248-004-0179-315965723McMurdie, P.J. and S. Holmes. 2013. Phyloseq: An R package for reproducible interactive analysis and graphics of microbiome census data. PLoS ONE 8:e61217.
10.1371/journal.pone.006121723630581PMC3632530Miltner, A., P. Bombach, B. Schmidt-Brücken, and M. Kästner. 2012. SOM genesis: Microbial biomass as a significant source. Biogeochemistry 111:41-55.
10.1007/s10533-011-9658-zNAAS. 2010. Methods of soil chemical analysis. National Institute of Agricultural Sciences, RDA, Suwon, Korea.
Petriglieri, F., M. Nierychlo, P.H. Nielsen, and S.J. McIlroy. 2018. In situ visualisation of the abundant
Chloroflexi populations in full-scale anaerobic digesters and the fate of immigrating species. PLoS One 13:e0206255.
10.1371/journal.pone.020625530383873PMC6211663Rousk, J., E. Bååth, P.C. Brookes, C.L. Lauber, C. Lozupone, J.G. Caporaso, R. Knight, and N. Fierer. 2010. Soil bacterial and fungal communities across a pH gradient in an arable soil. ISME J. 4:1340-1351.
10.1038/ismej.2010.5820445636Schloss, P.D., S.L. Westcott, T. Ryabin, J.R. Hall, M. Hartmann, E.B. Hollister, R.A. Lesniewski, and C.F. Weber. 2009. Introducing mothur: Open-source, platform-independent, community-supported software for describing and comparing microbial communities. Appl. Environ. Microbiol. 75:7537-7541.
10.1128/AEM.01541-0919801464PMC2786419Schreiter, S., G.C. Ding, H. Heuer, G. Neumann, M. Sandmann, R. Grosch, S. Kropf, and K. Smalla. 2014. Effect of the soil type on the microbiome in the rhizosphere of field-grown lettuce. Front. Microbiol. 5:144.
10.3389/fmicb.2014.0014424782839PMC3986527Siles, J.A. and R. Margesin. 2017. Seasonal soil microbial responses are limited to changes in functionality at two Alpine forest sites differing in altitude and vegetation. Sci. Rep. 7:2204.
10.1038/s41598-017-02363-228526872PMC5438347Sims, J.T. 1986. Soil pH effects on the distribution and plant availability of manganese, copper, and zinc. Soil Sci. Soc. Am. J. 50:367-373.
10.2136/sssaj1986.03615995005000020023xSørensen, J. 1997. The rhizosphere as a habitat for soil microorganisms. p. 21-45. In J. Dirk van Elsas et al. (ed.) Modern soil microbiology. Marcel Dekker, NY, USA.
Tian, D. and S. Niu. 2015. A global analysis of soil acidification caused by nitrogen addition. Environ. Res. Lett. 10:024019.
10.1088/1748-9326/10/2/024019Tisdall, J.M. and J.M. Oades. 1982. Organic matter and water-stable aggregates in soils. J. Soil Sci. 33:141-163.
10.1111/j.1365-2389.1982.tb01755.xTorsvik, V., L. Øvreås, and T.F. Thingstad. 2002. Prokaryotic diversity-magnitude, dynamics, and controlling factors. Science 296:1064-1066.
10.1126/science.107169812004116Tripathi, B.M., J.C. Stegen, M. Kim, K. Dong, J.M. Adams, and Y.K. Lee. 2018. Soil pH mediates the balance between stochastic and deterministic assembly of bacteria. ISME J. 12:1072-1083.
10.1038/s41396-018-0082-429515169PMC5864241Van Donsel, D.J., E.E. Geldreich, and N.A. Clarke. 1967. Seasonal variations in survival of indicator bacteria in soil and their contribution to storm-water pollution. Appl. Microbiol. 15:1362-1370.
10.1128/am.15.6.1362-1370.196716349746PMC547201Vlot, A.C., J.H. Sales, M. Lenk, K. Bauer, A. Brambilla, A. Sommer, Y. Chen, M. Wenig, and S. Nayem. 2021. Systemic propagation of immunity in plants. New Phytol. 229:1234-1250.
10.1111/nph.1695332978988Whitman, W.B., D.C. Coleman, and W.J. Wiebe. 1998. Prokaryotes: The unseen majority. Proc. Natl. Acad. Sci. 95:6578-6583.
10.1073/pnas.95.12.65789618454PMC33863Xu, Q., N. Ling, H. Chen, Y. Duan, S. Wang, Q. Shen, and P. Vandenkoornhuyse. 2020. Long-term chemical-only fertilization induces a diversity decline and deep selection on the soil bacteria. mSystems 5:10-1128.
10.1128/mSystems.00337-2032665327PMC7363003Yoon, J.H., K.H. Kim, and J.E. Yang. 2022. Difference in soil biogeochemical properties of agricultural highland by topographical characteristic and soil management. Korean J. Soil Sci. Fert. 55:1-12.
10.7745/KJSSF.2022.55.1.001Zhao, J., Y. Dong, X. Xie, X. Li, X. Zhang, and X. Shen. 2011. Effect of annual variation in soil pH on available soil nutrients in pear orchards. Acta Ecol. Sin. 31:212-216.
10.1016/j.chnaes.2011.04.001Zhao, W., X. Liu, Q. Huang, and P. Cai. 2015.
Streptococcus suis sorption on agricultural soils: Role of soil physico-chemical properties. Chemosphere 119:52-58.
10.1016/j.chemosphere.2014.05.06024968305


