

Introduction
Materials and Methods
Experimental site and plant material
Soil properties
N Fertilizer treatments
Fertigation system and schedule
Soil EC sensor installation and measurements
Growth and yield measurements
Data analysis
Result and Discussion
Effects of soil water matric potential
Effects of soil EC sensor by distance
Effect of fertigation rate and sensor placement on soil inorganic N and EC
Influence of soil inorganic N-EC sensor guided fertigation on peach growth
Influence of fertigation on fruit weight and quality
Conclusion
Introduction
Peach (Prunus persica L. Batsch) is a major fleshy fruit crop belonging to the Rosaceae family. Peach cultivated extensively in China, South Korea, the European Union, the United States, and Turkey (FAO, 2023). Global peach cultivation plays a significant role in fruit production systems, reached approximately 24.9 MMTs in 2024, and in South Korea, with an annual production of over 201.8 k tons in 2022 (WPR, 2025). Peaches are valued not only for their economic contribution but also for their nutritional properties, as they are rich in vitamins, minerals, organic acids, carotenoids, and polyphenols, which are associated with antioxidant, anticancer, and cardioprotective benefits (Mosie et al., 2025). Korean peaches are widely recognized for their sweetness, juiciness, and high fruit quality, making them an important commodity in regional and global trade (Choi et al., 2021). However, as with other fruit crops, maintaining high yield and consistent quality depends on effective soil fertility and nutrient management. Among essential nutrients, N (N) is particularly critical for peach production because it regulates vegetative growth, canopy development, photosynthetic activity, fruit size, and sweetness (Chawla and Sharma, 2024).
Despite its importance, N management in peach orchards is often ineffective. Traditional application methods, such as broadcasting or hand application, tend to oversupply and distribute fertilizers unevenly across the orchard. This results in low N use efficiency, as a considerable proportion of applied N is lost through leaching, volatilization, or denitrification before uptake by tree roots (Bindraban et al., 2015). Excessive inorganic fertilization not only raises production costs but also leads to nutrient imbalances, reduced fruit sugar content, poor quality, and negative environmental impacts, including soil degradation and water pollution (Sainju et al., 2019; Rathinapriya et al., 2025). In South Korea, fruit orchards frequently exceed recommended fertilization levels, further highlighting the need for precision nutrient management (Lee et al., 2024).
The application of fertilizers at various phases of plant growth is essential for sustaining crop productivity, yet applying them without monitoring soil nutrient status can negatively affect plants, degrade soil fertility, and contribute to environmental pollution (PSA, 2016). Conventional farming often relies on blanket fertilization strategies that fail to match nutrient supply with plant demand, resulting in oversupply, leaching, and greenhouse gas emissions. To address these issues, high-tech and sensor-based approaches are increasingly being adopted in agriculture to improve fertilizer efficiency while minimizing environmental risks (Zhang, 2018; Willett et al., 2019). Smart-sensor technologies, including optical, spectroscopic, and electrochemical tools such as visible near-infrared, attenuated total reflectance, Raman, ion-selective electrodes, and ion-selective field-effect transistors, are being explored for their ability to provide rapid and precise nutrient information (Burton et al., 2020; Vyavahare et al., 2023). However, due to energy limitations and the lack of sensors capable of directly measuring essential nutrients such as N and potassium (K), electrical conductivity (EC) sensors have gained wide attention as indirect, low-power alternatives for real-time monitoring. Since soil EC reflects the concentration of soluble ions including nitrate (NO3-) and ammonium (NH4+) it is increasingly recognized as a reliable proxy for nutrient availability (Othaman et al., 2021; Vyavahare et al., 2023; Ahmad, 2025).
To combat nutrient losses and inefficiencies, fertigation where nutrients are delivered directly to the root zone through irrigation water has emerged as a promising strategy to synchronize nutrient supply with plant uptake, reduce leaching and volatilization losses, and allow flexible adjustments of nutrient rates throughout the growing season (Sneha et al., 2025). Studies across fruit crops have demonstrated that fertigation can reduce total N inputs while sustaining or enhancing yield and fruit quality, thus improving resource-use efficiency and reducing environmental pressure (Southwick et al., 1999; Jeyabaskaran et al., 2021). However, to fully realize these benefits, fertigation systems require precise and reliable monitoring tools that can capture dynamic changes in soil nutrient and water status.
Traditional soil testing approaches fail to reflect the rapid and spatially heterogeneous nutrient fluctuations occurring after fertigation. Under drip fertigation, nutrients concentrate in localized zones around drippers, creating steep spatial gradients that strongly influence EC sensor readings (Soulis et al., 2015). Consequently, sensor accuracy depends on their lateral and vertical positioning relative to emitters, with incorrect placement risking fertilizer mismanagement due to under- or overestimation of nutrient availability (Gong et al., 2022). Despite this, research on the optimal placement of EC sensors in peach orchards remains limited, particularly under Korean field conditions where long-term nutrient imbalances and declining soil fertility pose major challenges. Addressing this knowledge gap is critical to advancing precision fertigation practices that improve N-use efficiency, reduce environmental impacts, and ensure sustainable peach production.
Optimizing N fertigation and soil EC sensor placement offers clear benefits, including improved fertilizer-use efficiency, reduced nutrient losses, and sustained peach productivity, while supporting sustainable agriculture and food security (Reza et al., 2025; Sood et al., 2025). However, limited research has addressed the influence of sensor placement on soil nutrient monitoring under fertigation in peach orchards.
Therefore, this study 1) evaluates the effects of reduced N fertigation and 2) the optimal installation position of soil EC sensors in mature peach trees, with the goal of developing practical recommendations for precision fertigation management. Ultimately, this work aims to contribute to climate-resilient orchard systems while providing a foundation for future research on integrating smart-sensor technologies with nutrient-efficient strategies to support both farmer profitability and environmental sustainability.
Materials and Methods
Experimental site and plant material
The field experiment was conducted at the peach orchard of the National Institute of Horticultural and Herbal Science (NIHHS), Iseo-myeon, Wanju-gun, Jeollabuk-do, South Korea (35°83′ N, 127°03′ E). Eleven-year-old ‘Changhowon Hwangdo’ peach trees were planted at a spacing of 6 m × 6 m. A total of 12 trees were selected and arranged in a randomized complete block design with four treatments and three replications (one tree per replication).
Soil properties
Soil chemical properties of the experimental peach orchard were analyzed according to the methods of the National Institute of Agricultural Science and Technology, RDA, South Korea (NLAST, 2000). Soil samples were collected, air-dried in the shade, and sieved through a 2-mm mesh. The topsoil (0 - 20 cm) were analyzed at sampling sites, and the orchard soil texture was classified as loam (33% sand, 41% silt, 26% clay). Soil pH and EC were determined at a 1:5 soil-to-water ratio using an ion electrode pH meter (ORION VersaStar, Thermo Scientific, USA) and an EC meter (CM-42X, TOADKK, Japan), respectively. Organic matter (OM) content was measured by the Tyurin method, while available phosphorus (P2O5) was analyzed using the Lancaster method. Exchangeable potassium (K), calcium (Ca), and magnesium (Mg) were extracted with 1 N CH3COONH4 buffer solution (pH 7.0) and quantified using inductively coupled plasma spectrometry (Integra, GBC Scientific Equipment, Australia). The soil chemical properties were shown in Table 1.
Table 1
Chemical properties of the soil in the experimental peach orchard.
|
pH (1:5) |
O.M.1 (g kg-1) |
Avail.P2O5 (mg kg-1) | Exch. cations (cmolc kg-1) | ||
| K | Ca | Mg | |||
| 5.8 | 18 | 81 | 0.44 | 4.5 | 3.2 |
N Fertilizer treatments
N (N) treatments were established as follows: (i) Control, no irrigation and no N fertilization; (ii) Auto-irrigation, with water supplied automatically when soil water potential reached -35 kPa (spring to pre-harvest) and -50 kPa (harvest period), and N fertilizer manually applied at the recommended rate of 155 kg N ha-1; (iii) Auto-fertigation with 80% of the recommended N rate (124 kg N ha-1); and (iv) Auto-fertigation with 100% of the recommended N rate (155 kg N ha-1)(Table 2). Phosphorus and potassium were supplied at P2O5 100 kg ha-1 and K 125 kg ha-1, respectively, according to soil analysis recommendations. Phosphorus (as fused superphosphate) was applied as a basal dressing before leaf sprouting. K (as potassium chloride) was applied as 60% basal and 40% side-dressing in mid-May. All P and K fertilizers were applied manually.
Table 2
Details of chemical fertilizer supplied under different N and irrigation treatments
| S. No | Treatment |
N (kg ha-1) |
P2O5 (kg ha-1) |
K2O (kg ha-1) |
| Control | 0 | 100 | 125 | |
| Auto-irrigation | 155 | 100 | 125 | |
| 80% N fertigation | 124 | 100 | 125 | |
| 100% N fertigation | 155 | 100 | 125 |
Fertigation system and schedule
For the fertigation treatments, ammonium nitrate (NH4NO3) was used as the N source. Fertilizer solution was delivered through drip irrigation hoses (dripper spacing 50 cm), with two drip lines installed 30 cm to the left and right of each tree row. Fertigation was carried out at intervals of 10 - 15 days during the growing season on the following dates: April 17, April 27, May 12, May 22, June 3, June 12, June 23, July 2, July 17, July 27, and August 7.
Soil EC sensor installation and measurements
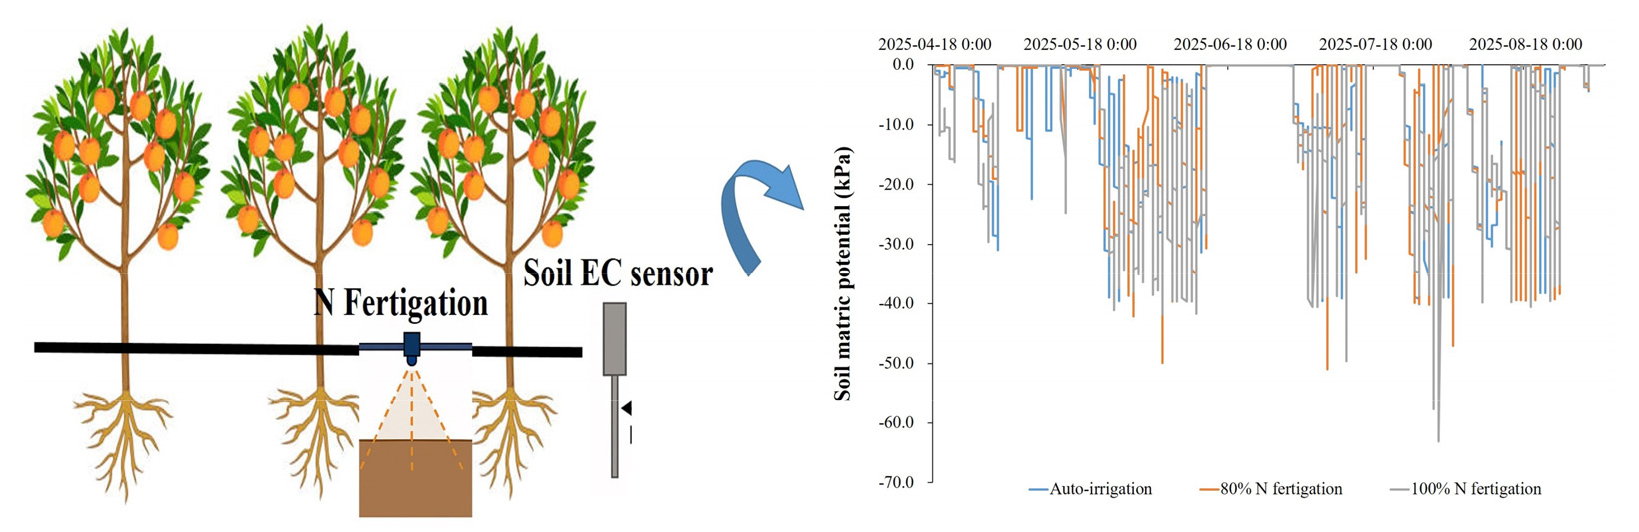
To determine the optimal positioning of soil EC sensors, Teros 12 sensors (METER Group Inc., USA) were installed at three horizontal distances (0, 12.5, and 25 cm) from a dripper in both the 80% N and 100% N fertigation treatments. Soil EC was recorded every 30 minutes using a ZL6 data logger (METER Group Inc., USA). In addition, soil samples were collected 1 - 2 days after each fertigation event to analyze soil inorganic N (NO3--N + NH4+-N) concentrations and to validate sensor data.
Growth and yield measurements
Peach growth and yield were measured across all treatments. Shoot growth was assessed in mid-July by measuring the length of 10 randomly selected shoots per replication. Fruit were harvested on September 8th, 2025 from each replication 25 fruits were collected to determine average fruit weight of peach. In addition, soluble sugar content was measured from juice extracted from seven fruits per replication using a digital refractometer (PAL-1, ATAGO, Japan).
Data analysis
Statistical analysis was conducted using SAS software (Enterprise Guide 7.1, SAS Institute, USA). The significance of differences between treatments was determined by one-way analysis of variance (ANOVA), and mean differences were analyzed using Duncan’s multiple range test (DMRT) at a 5% significance level.
Result and Discussion
Effects of soil water matric potential
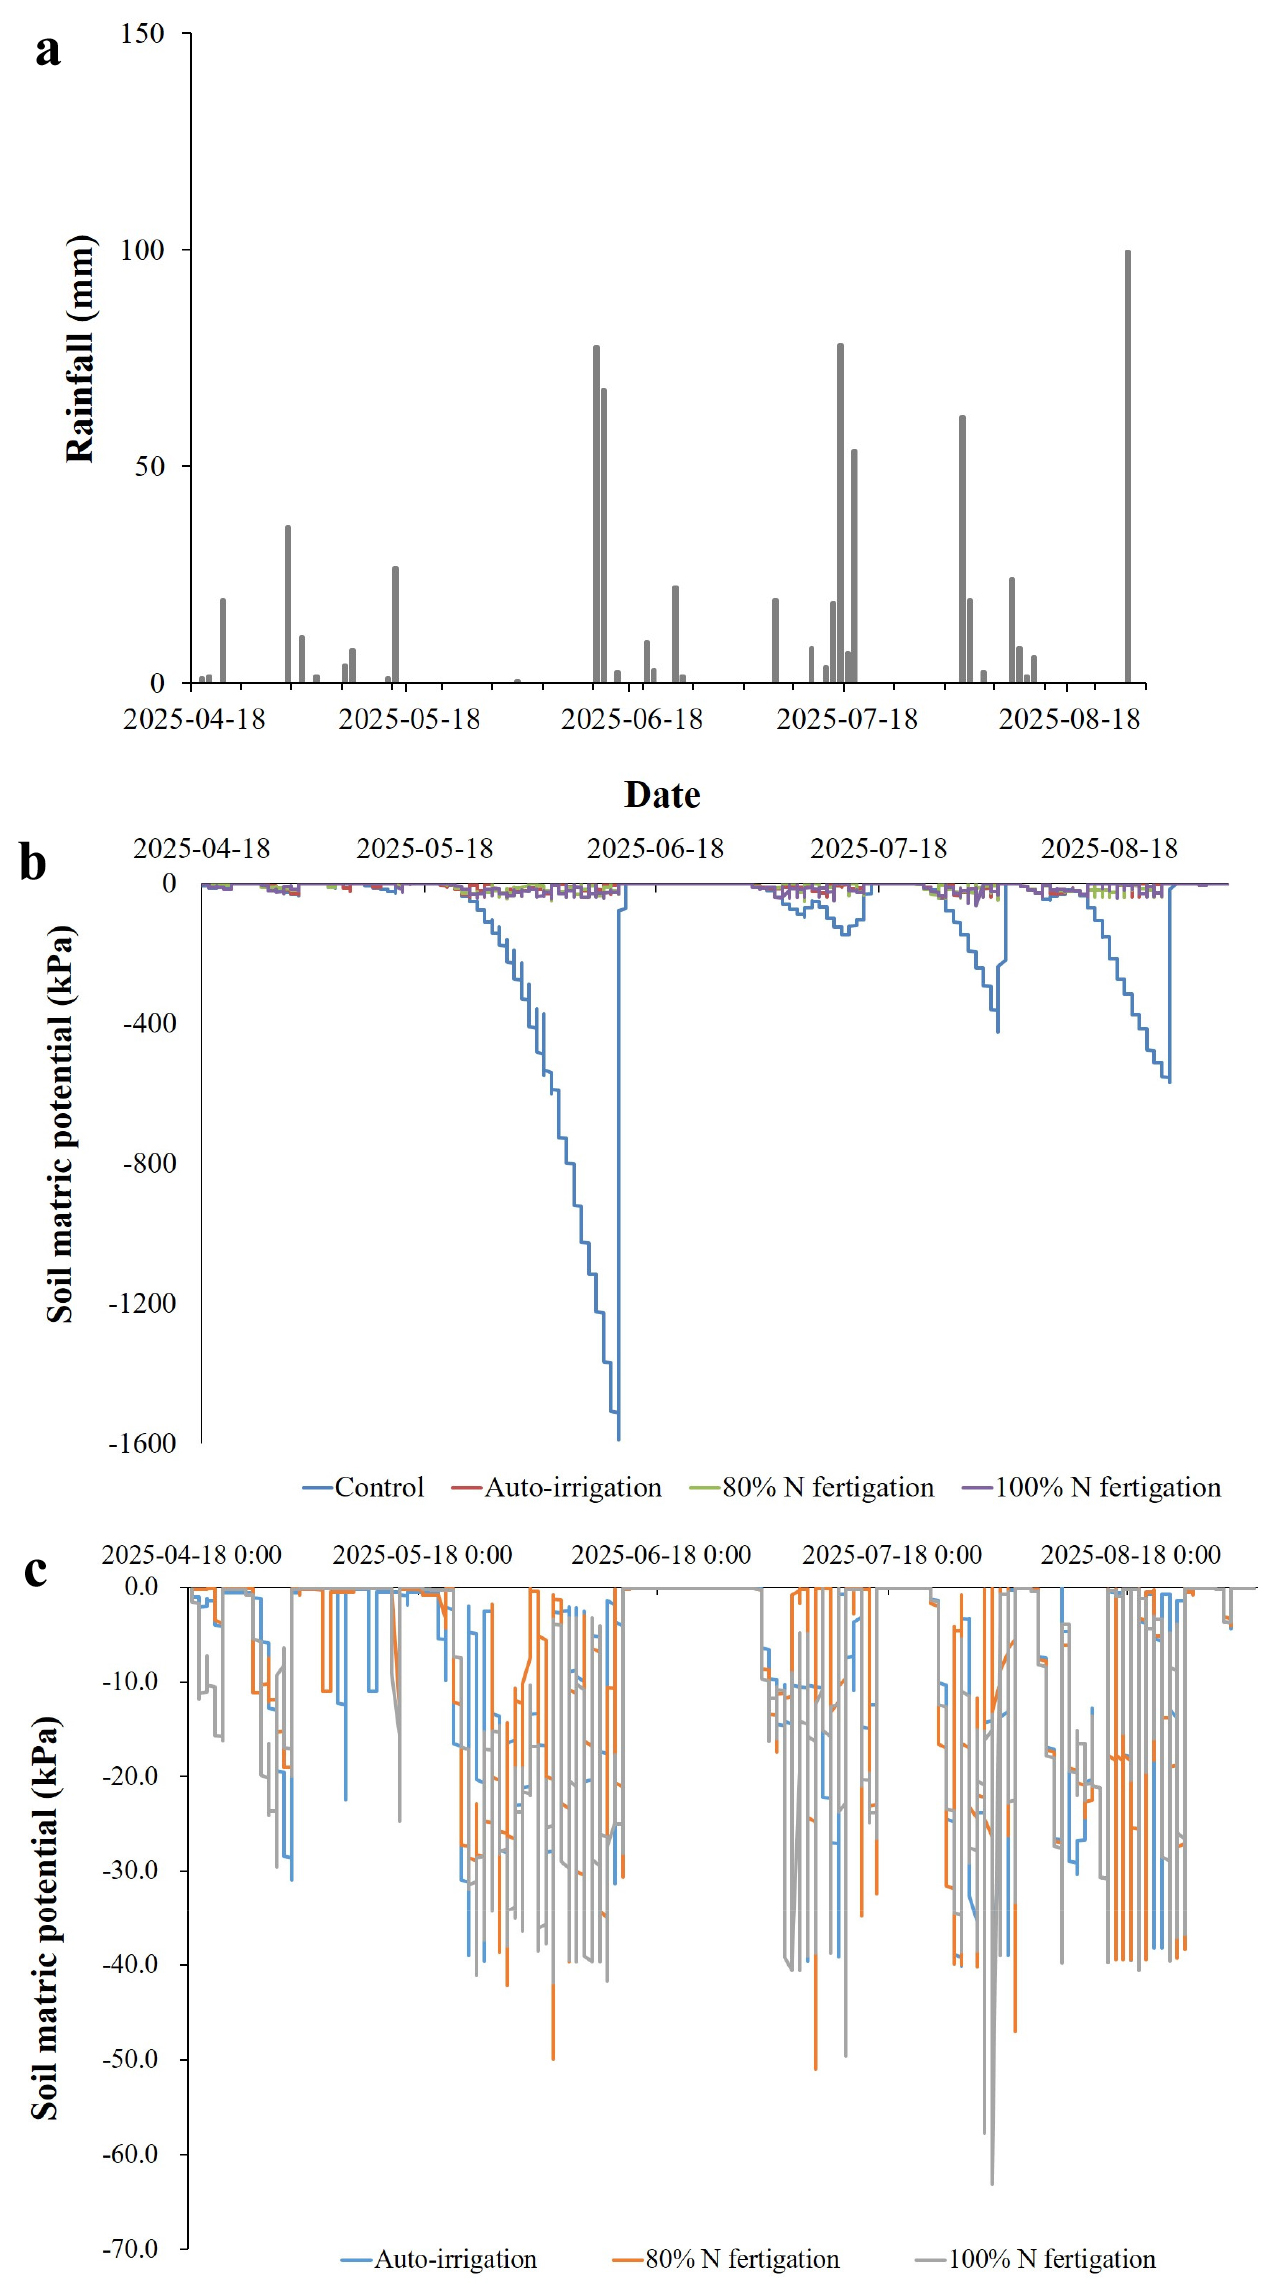
During the peach cultivation period (April-August 2025), rainfall was irregular and unevenly distributed, with several small events (<30 mm) in spring, moderate peaks in June (-70 mm) and July (-90 mm), and the largest event in late August exceeding 220 mm (Fig. 1a). Such variability indicated that natural precipitation alone was insufficient to maintain stable soil water conditions throughout the growing season. Soil water matric potential varied markedly among treatments (Fig. 1b, 1c). In the control, soil matric potential declined rapidly during dry periods and reached values below -1,500 kPa in June, indicating severe drought stress. In contrast, the auto-irrigation, 80% N fertigation, and 100% N fertigation treatments maintained soil matric potential within controlled thresholds. Automatic irrigation was triggered at -35 kPa from spring to pre-harvest and at -50 kPa near harvest, preventing excessive soil drying. As a result, soil water potential in these treatments rarely exceeded -60 kPa, even during prolonged dry periods. Previous studies have reported that rainfall variability in East Asia strongly influences soil moisture dynamics and crop productivity, making supplemental irrigation essential to prevent water stress (Ahmad et al., 2021; Volo et al., 2014).
A closer comparison of irrigation and fertigation treatments (Fig. 1c) revealed only minor differences in soil water dynamics. All irrigated treatments maintained soil water content consistently above the stress threshold, with fluctuations reflecting rainfall inputs and automatic irrigation events. These results indicate that the automated irrigation system effectively stabilized soil moisture regardless of N application rate and rainfall variability. In drip-irrigated apple orchards, automated scheduling closely matched expert decisions and effectively regulated moisture availability throughout the season (Domínguez-Niño et al., 2020). Similar outcomes were observed in plum orchards, where automated deficit irrigation prevented excessive soil drying and mimicked expert scheduling without manual input (Millán et al., 2019). Furthermore, in high-density apple orchards, sensor-based systems not only conserved water but also preserved fruit yield and quality under irregular rainfall patterns (Jiang and He, 2021). These studies support the conclusion that automated irrigation effectively stabilizes soil water dynamics under diverse and challenging environmental conditions.
Effects of soil EC sensor by distance
Soil EC varied with both fertigation level and sensor placement (Fig. 2). Under 80% N fertigation, EC values were highest at 0 cm from the dripper (0.4 - 0.6 dS m-1 early to mid-season), intermediate at 12.5 cm, and lowest at 25 cm, where values often dropped below 0.2 dS m-1. By late August, EC at 0 cm declined to -0.3 dS m-1, while at greater distances reductions were sharper. A similar pattern occurred under 100% N fertigation, although overall EC values were higher, with peaks above 0.6 dS m-1 near drippers after fertigation.
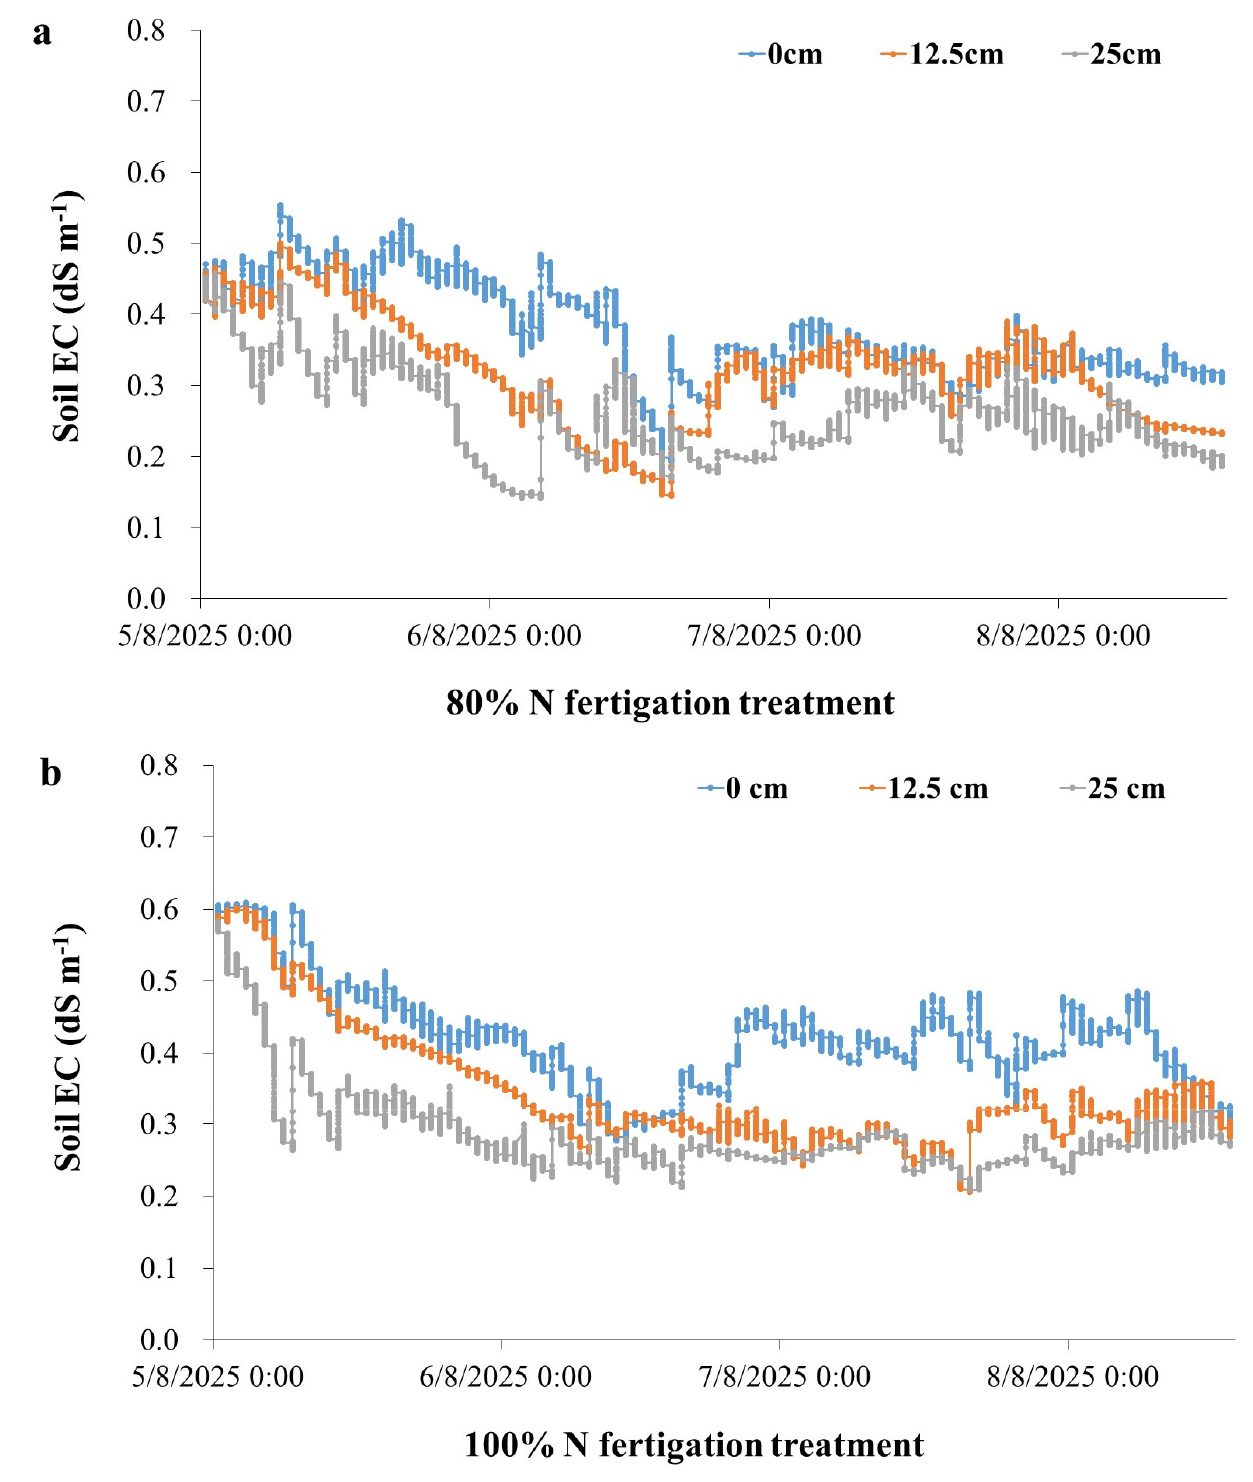
These results indicate that fertigation created localized nutrient zones, with the strongest fertilizer influence closest to emitters. Consequently, sensors placed near drippers captured more consistent responses, whereas those at 25 cm underestimated nutrient availability. This agrees with earlier studies showing that drip irrigation produces strong spatial gradients in solute distribution, and sensor placement critically affects EC readings (Soulis et al., 2015). The strong spatial gradient in EC measurements observed in our study aligns with previous findings indicating that soil EC sensors placed near drip emitters more accurately reflect real-time nutrient dynamics. Coelho and Or (1996) demonstrated that spatial solute variability around drippers makes sensor location critical to meaningful data collection (Coelho and Or, 1996). Similarly, Rogers et al. (2008) observed that EC peaks were most prominent in sensors located within 5 cm of the dripper in vineyard fertigation systems (Rogers et al., 2008). These results underscore that fertigation under drip systems creates localized zones of nutrient availability, and sensor distance from emitters significantly affects EC readings, a factor also emphasized in spring onion systems (Vyavahare et al., 2023). Therefore, to avoid underestimating nutrient availability and to optimize fertilizer management, sensor placement must be carefully aligned with the irrigation design, and future research should incorporate multi-depth monitoring to better capture vertical nutrient redistribution under fertigation.
Effect of fertigation rate and sensor placement on soil inorganic N and EC
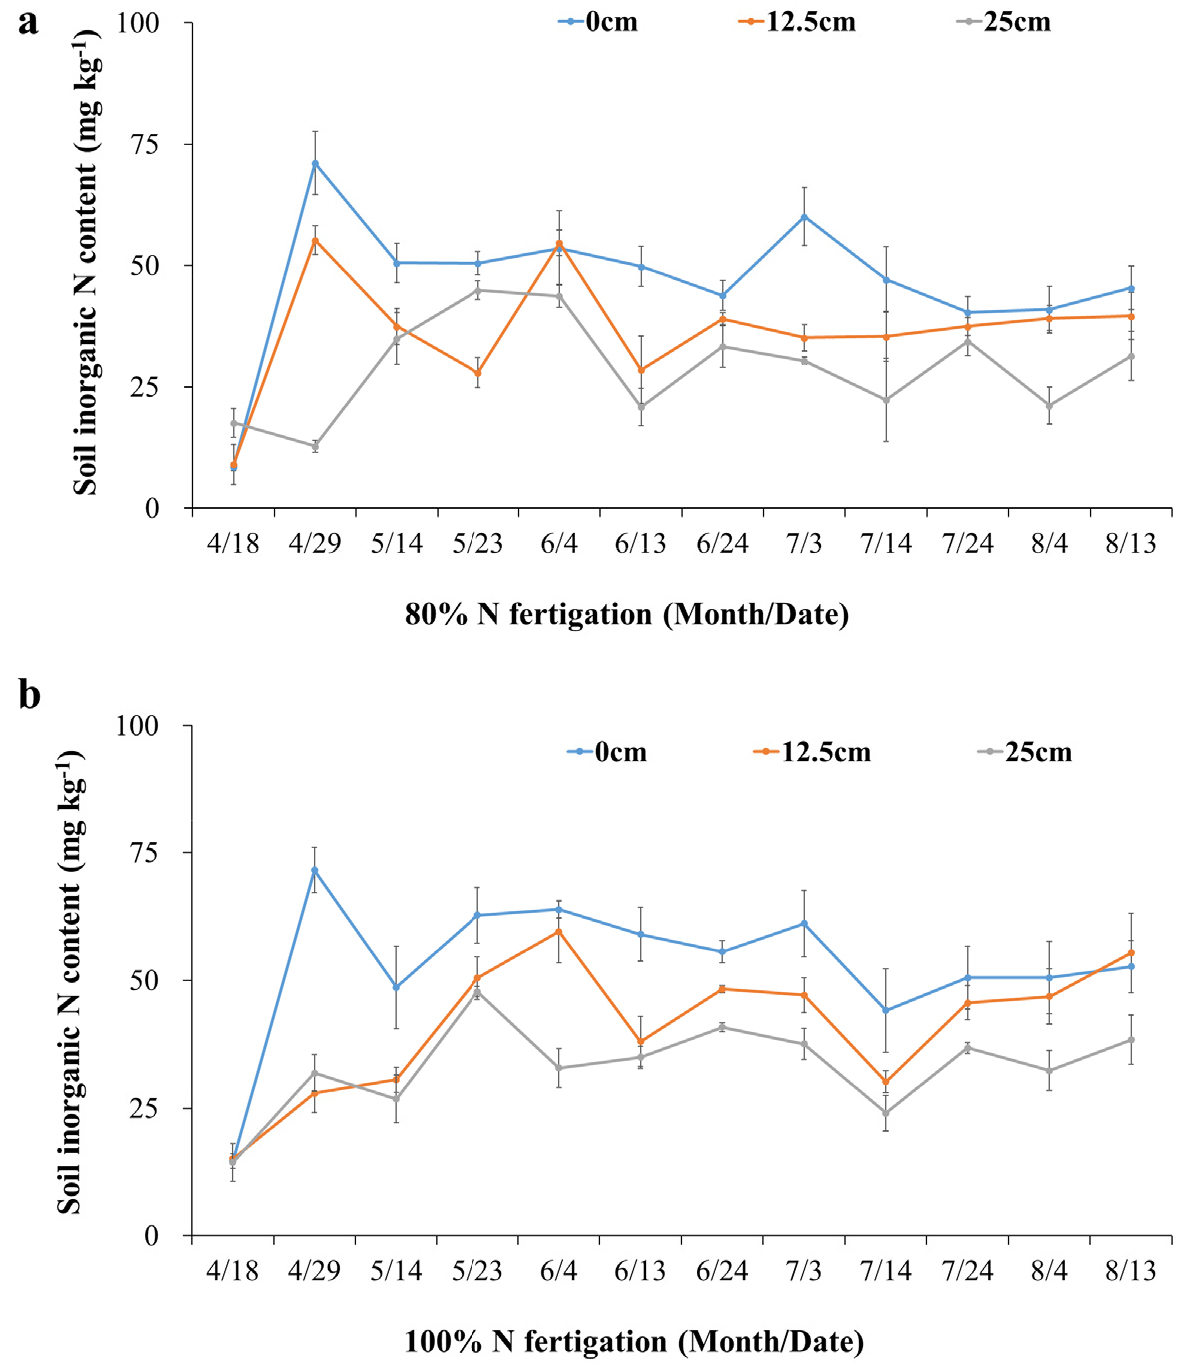
Soil inorganic N (NO3--N + NH4+-N) content varied significantly across treatments and sensor placements throughout the growing season (Fig. 3a, 3b). Under the 80% N fertigation treatment, the highest concentrations were consistently recorded at 0 cm from the dripper, followed by 12.5 cm, with the lowest values observed at 25 cm (Fig. 3a). Peak concentrations occurred shortly after fertigation events, particularly in late April and early July, and declined gradually toward late August. This trend reflects the rapid dissolution and movement of N in the wetted zone immediately surrounding the emitter.
A similar but more pronounced pattern was evident under 100% N fertigation (Fig. 3b), where inorganic N concentrations at 0 cm often exceeded 80 mg kg-1 following fertigation events in May and June. While absolute values were higher under 100% N, the spatial distribution pattern remained consistent, with a marked decrease in concentration with increasing distance from the dripper. These findings are in line with previous research demonstrating that drip fertigation creates strong spatial gradients of nutrient availability, concentrating solutes in narrow zones near the emitter (Guo et al., 2024; Bryla et al., 2010). Importantly, the relatively small difference in inorganic N content between the 80% and 100% N treatments suggests that reducing N input by 20% does not significantly compromise nutrient availability in the root zone. This supports previous findings that optimized fertigation can enhance N-use efficiency while maintaining crop productivity (Messiga et al., 2021).
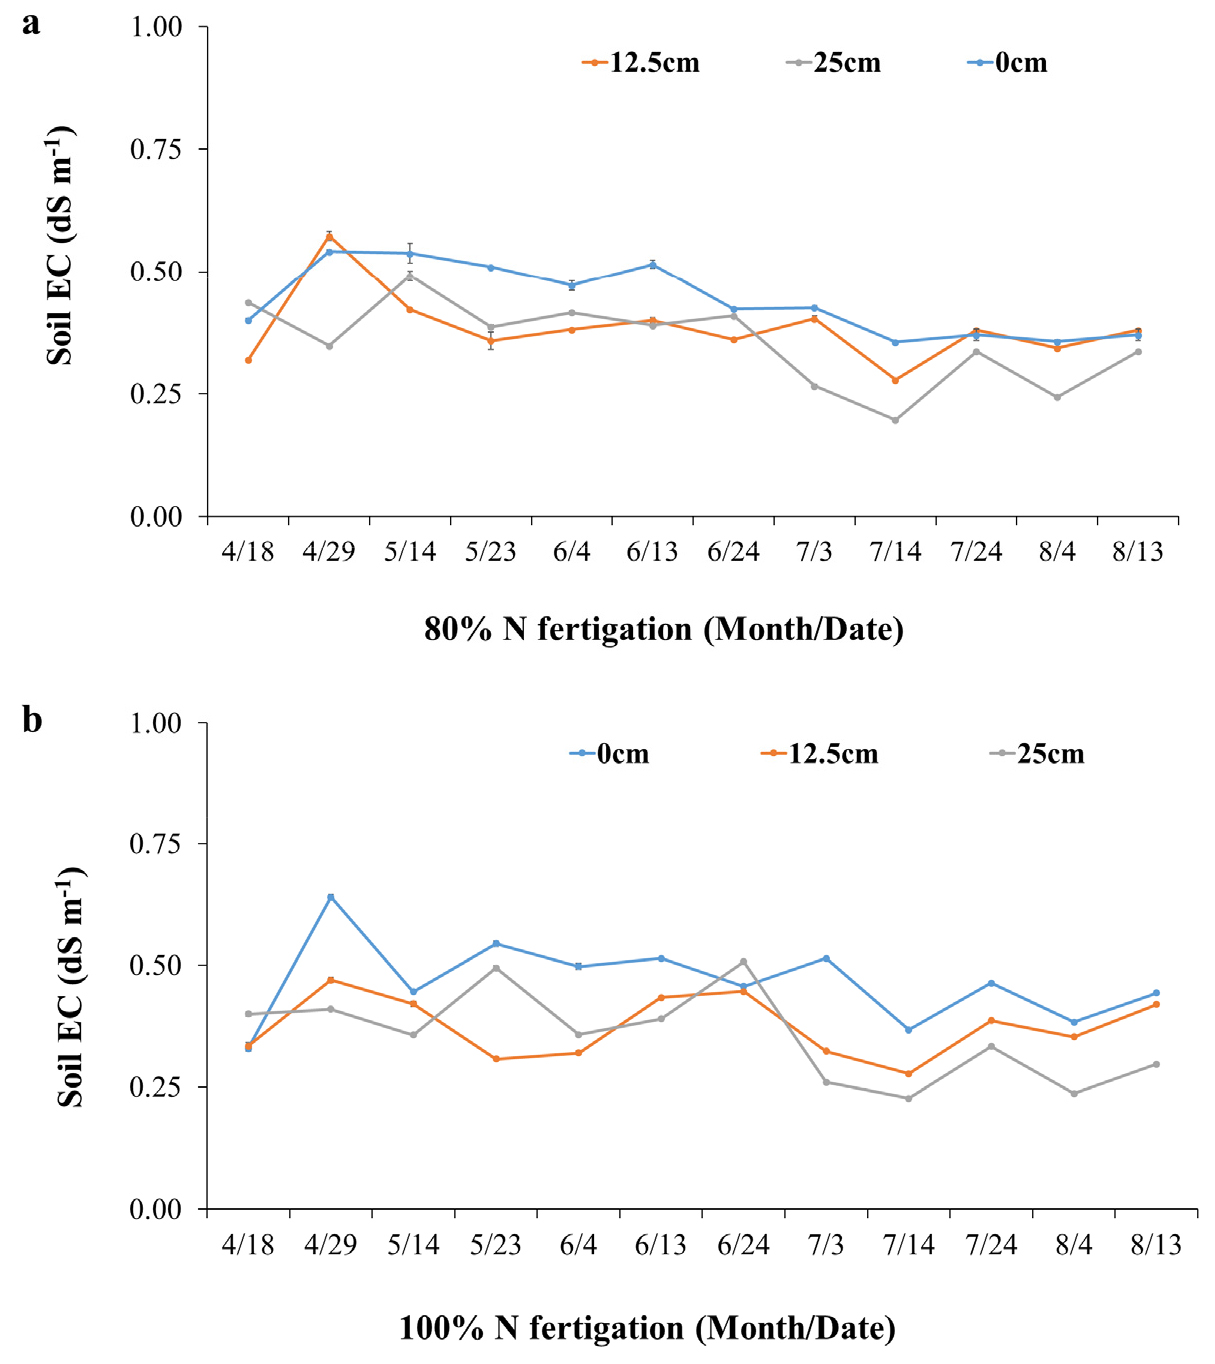
Soil EC displayed a spatial distribution closely mirroring that of inorganic N, reinforcing its role as an indirect indicator of fertigation dynamics (Fig. 4a, 4b). In the 80% N fertigation treatment (Fig. 4a), EC values peaked at 0 cm (0.45 - 0.60 dS m-1), were moderate at 12.5 cm, and lowest at 25 cm (often below 0.3 dS m-1). Notable peaks were observed shortly after fertigation, especially in April and May, suggesting a direct response to the ionic inputs from fertilizer application. Under 100% N fertigation (Fig. 4b), EC values were generally higher across all positions, with maxima near the emitter exceeding 0.6 dS m-1. The strong correspondence between EC and inorganic N content is attributable to the use of ammonium nitrate (NH4NO3), a highly soluble fertilizer that significantly increases soil solution conductivity upon dissolution. These results are supported by earlier studies demonstrating a robust correlation between EC and soil NO3- and NH4+ concentrations, particularly under controlled irrigation regimes (Zhang and Wienhold, 2002; Vyavahare et al., 2023). Although EC sensors do not measure N directly, they are frequently used as practical tools for fertigation monitoring due to their sensitivity to nutrient-induced changes in soil salinity. However, the steep spatial gradients observed highlight that EC sensors positioned at 25 cm from the dripper tend to underestimate actual root-zone nutrient levels, potentially leading to misinterpretation of soil fertility status. This finding aligns with prior reports showing that accurate fertigation monitoring depends heavily on proper sensor placement relative to the wetted zone (Coelho and Or, 1996; Rogers et al., 2008).
The results clearly demonstrate that both fertigation rate and sensor placement significantly influence soil nutrient measurements. EC and inorganic N concentrations were consistently higher near the emitter (0 - 12.5 cm), indicating that sensors placed within this range more accurately reflect nutrient availability in the root zone. Conversely, sensors at 25 cm consistently reported lower values, which could lead to underestimation of soil fertility and unnecessary fertilizer application. The finding that a 20% reduction in N input (from 100% to 80%) does not significantly reduce soil N availability supports the adoption of precision fertigation strategies. Such practices can reduce nutrient leaching risks, enhance fertilizer-use efficiency, and support sustainable orchard production. These insights reinforce the critical role of sensor-guided fertigation in achieving site-specific nutrient management goals.
Influence of soil inorganic N-EC sensor guided fertigation on peach growth
Peach tree growth, assessed by shoot length and stem diameter, was moderately influenced by fertigation treatment and nutrient management strategy (Table 3). Among the treatments, shoot length varied significantly (p < 0.05), with the fertigation-based treatments (80% and 100% N) producing the greatest shoot elongation. Specifically, average shoot lengths were 59.2 cm under 80% N fertigation and 60.5 cm under 100% N fertigation. These values were not statistically different from each other, indicating that a 20% reduction in N input did not negatively impact vegetative growth. However, both fertigation treatments significantly outperformed the control, which exhibited the shortest shoot length (53.3 cm).
Table 3
Effect of different fertigation treatments on shoot growth parameters of peach trees.
| Treatment | Shoot length (m) | Shoot diameter (mm) |
| Control | 53.3 b | 4.23 a |
| Auto-irrigation | 58.2 a | 4.35 a |
| 80% N fertigation | 58.2 a | 4.36 a |
| 100% N fertigation | 60.5 a | 4.38 a |
In contrast, shoot diameter showed relatively limited variation among treatments, with mean values ranging from 4.23 mm to 4.38 mm, and no statistically significant differences detected. This suggests that while fertigation enhanced shoot elongation, its influence on stem thickening was minimal during the experimental period. These findings are consistent with prior research indicating that shoot elongation in deciduous fruit trees is more sensitive to N availability than stem diameter growth, especially in early stages of canopy development (Messiga et al., 2021). Moreover, the comparable performance between the 80% and 100% N treatments supports the hypothesis that sensor-guided fertigation can maintain adequate nutrient availability with reduced input, enhancing N-use efficiency without compromising vegetative growth. These results underscore the fertigation and irrigation management influenced shoot elongation more strongly than stem thickening in peach trees during the study period.
Influence of fertigation on fruit weight and quality
Fertigation affected peach fruit weight, with all fertilized treatments producing larger fruits than the control (Table 4). Specifically, the 100% N fertigation treatment resulted in the heaviest fruits (485.8 g fruit-1), followed closely by 80% N fertigation (474.5 g fruit-1) and conventional irrigation with 100% N (468.6 g fruit-1). In contrast, control produced the smallest fruits (419.4 g fruit-1), which were significantly lighter than those under fertigation treatments (p < 0.05). In terms of fruit quality, soluble solids (13.8 - 14.0 °Brix) and acidity (0.23 - 0.24%) were not significantly affected by the treatments, indicating that reducing N input by 20% under fertigation did not compromise fruit sweetness or acidity. These findings support the conclusion that 80% N fertigation maintains fruit quality while reducing N inputs, improving fertilizer-use efficiency. This result aligns with the previous studies showing that moderate N fertigation rates enhance fruit yield without adversely affecting soluble solids or acidity, particularly when N is delivered directly to the root zone via drip systems (Barreto et al., 2022; Zhang et al., 2022; Nava et al., 2022). Although fertigation significantly enhanced fruit yield, soluble solids content not differ significantly among treatments, indicating that improvements in productivity were not accompanied by increases in fruit sweetness. Furthermore, studies confirm that optimized fertigation especially when paired with precision application improves nutrient uptake and reduces leaching, contributing to both productivity and sustainability (Chawla and Sharma, 2024). Overall, these results demonstrated that optimized fertigation improved fertilizer-use efficiency, reduced unnecessary inputs, and sustained high-quality peach production. However, our findings demonstrate the short-term feasibility of reducing N by 20% under fertigation, but long-term validation through multi-year trials is necessary to confirm sustained effects on tree vigor, nutrient reserves, and productivity.
Table 4
Effect of different fertigation treatments on fruit yield and quality attributes of peach
Conclusion
In summary, this study highlights that N fertigation can significantly improve peach tree growth, and yield compared with conventional irrigation, while allowing for a 20% reduction in N input without compromising productivity. Soil EC monitoring further revealed that sensor placement strongly affects nutrient detection, with sensors positioned closer to drip emitters (0 - 12.5 cm) providing the most accurate information on soil fertility dynamics. The novelty of this work lies in its combined evaluation of reduced N fertigation rates and optimized EC sensor installation in mature peach orchards, an aspect that has received limited attention. These findings support the adoption of precision fertigation management that reduce input costs and environmental risks while sustaining high-quality fruit production. Future research should focus on multi-nutrient fertigation strategies, integration with automated decision-support systems, and long-term impacts on soil health to advance smart and sustainable orchard management.
