

Introduction
Materials and Methods
Experimental design
Meteorological data
Soil analysis
Plant growth and bulb yield determination
Plant analysis
Storage test
Statistical analysis
Results and Discussion
Soil nitrate nitrogen content
Plant growth and bulb yield
Plant mineral contents and uptakes, and nutrient use efficiency
Antioxidant compound and storage quality
Introduction
Bulb onion (Allium cepa L.) is the most consumed vegetable next to Kimchi cabbage in South Korea (KOSTAT, 2021). Onions were harvested on 18,461 ha, with a production of 1.58 million Mega grams (Mg) (KOSTAT, 2021). Onion yield in Korea is the highest in the world, consistently achieving over 50 Mg ha-1 every year since 1989 (FAO, 2020). Onion productivity has been sustained by a double cropping system of rice followed by onions and by intensified cultural practices, including the use of transplants, high-density planting, polyethylene film mulches, and increased use of chemical fertilizer, compost and synthetic chemicals. However, recently onion growers have been worried about various physiological disorders or diseases, and bulb yield reduction or deteriorated bulb quality of onions harvested or stored in historical onion growing areas.
Onions (Allium cepa L.) bulb development is influenced by temperature and photoperiod, and bulb initiation is promoted by long photoperiods and high temperatures (Magruder and Allard, 1937; Kato, 1964; Brewster, 1997). Nitrogen (N) plays a role in bulb initiation by controlling vegetative growth and bulb development. Lower N accelerates the onset of bulbing through higher bulbing ratios (maximum bulb/minimum neck diameter) at the early bulb development stage, but there is a smaller bulb size at the late bulb development stage (Brewster and Butler, 1989). Lower soil N levels increase bulb weight ratio relative to leaf blade, which means that insufficient N supply inhibits vegetative growth (Lee et al., 2011).
Uptake by onion plants of applied N and apparent recovery is low compared to other vegetable crops, because onions have a shallow, sparsely branched root system with most roots in the top 30 cm of soil (Brewster, 2008; Geisseler et al., 2022). Low fertilizer recovery is attributed to additional supply except for chemical fertilizer such as residual soil nutrients as minerals and organic matter, mineralization from manure compost or pre-crop residue (Greenwood et al., 1989, 1992; Salo, 1999; Lee et al., 2011). Excessive fertilization, or untimely application, increases the risk of nitrate and phosphate leaching into ground- or surface water, increases production cost and can negatively affect onion quality (Lee et al., 2012; Geisseler et al., 2022).
Controlled- and slow-release fertilizers have the potential to increase N use efficiency by reducing the amount of nitrate which can be leached into groundwater. The release of N needs to match the crop’s demand and uptake (Geisseler et al., 2022). Slow controlled release fertilizers have been reviewed by means of definition and classification (Trenkel, 2010; Fu et al., 2018). Slow release fertilizer has been defined as that containing a plant nutrient in a form which delays its availability for plant uptake and use after application, or which extends its availability to the plant longer than a reference ‘rapidly available nutrient fertilizer’ such as ammonium nitrate or urea, ammonium phosphate or potassium chloride (Anonymous, 1997). The classification of slow- and controlled-release fertilizers; organic-N low-solubility compounds such as urea-formaldehyde (UF) and isobutylidene-diurea, fertilizers in which a physical barrier controls the release such as polymer-coated fertilizers and sulfur or mineral-based coated ones, and inorganic low-solubility compounds such as metal ammonium phosphates, acidulated phosphate rock has been proposed (Shaviv, 2005). Biologically and microbially decomposed N products, such as UF, are commonly referred to as slow-release fertilizers, and coated or encapsulated/occluded products as controlled-release fertilizers (CRFs) (Trenkel, 2010). Nitrogen release from coated products may be dependent on soil moisture, soil temperature, microbial activity, coating thickness, orifice size in the coating, or some mixture of these variables (Guertal, 2009).
The CRFs are expected to be most effective in conditions to accelerate mineralization of nutrients such as excessive rainfall or irrigation (Morgan et al., 2009). Onion bulb yields increased with sulfur-coated urea compared to pre-plant urea at low N application rates, but not at high application rates (Brown et al., 1988). In their study, high application rate exceeded total N uptake by approximately 100 kg ha-1, indicating the high N application rate was excessive. Fertilizer application with N rates as urea at 224 - 112 kg ha-1 N did not have effects on onion bulb yield, while the CRF as a polymer-coated urea (PU) increased bulb yield with increased rates (Drost et al., 2002). The PU rate at 112 kg ha-1 N resulted in higher bulb yield compared to urea fertilizer at 224 kg ha-1 N. In contrast, replacing different proportions of N with methylene urea had no effect on onion bulb yield in a field trial, and the fertilizer treatments did not increase yield compared to the unfertilized control (Ristimäki and Papadopoulos, 2000). The reason might be attributed to high soil fertility and N content in the field before planting.
The N use efficiency can be improved with slow- or controlled-release fertilizers, either by increasing the yield at the same application rate as regular mineral N fertilizers, or by achieving the same yield at a reduced rate (Lee et al., 2020; Geisseler et al., 2022). Exceptions are situations where N availability exceeds onion N demand and losses do not reduce its availability to the point where N becomes limiting. An additional benefit of slow- and controlled-release fertilizers is that they keep the mineral content in soil solution low and reduce the risk of salt damage.
The objective of the study was to assess the effects of single basal application of CRF at different rates on soil NO3-N content, plant growth and yield, nutrient uptake and use efficiency, bulb and storage quality of fall-transplanted onions compared with separated NPK compound fertilizer in a double cropping system of rice followed by onion for more than fifty years and under high soil nutrients content.
Materials and Methods
Experimental design
The study was performed at 2 farmers’ fields in Changnyeong district, Korea during 2013/2014 (35°50'02"N and 128°44'10"E) and 2014/2015 (35°51'49"N and 128°45'13"E) growing seasons. The sites have been under continuous cultivation with a double cropping system of rice (Oryza sativa L.) followed by onions. The soil at the sites was Alisols in FAO world reference base, with the surface soil texture of sandy loam in the first-season field and silt loam in the second-season field.
For the first growing season, onion seeds, cv. Janus (an F1 hybrid, intermediate-day cultivar for fall transplanting), were broadcast on beds formed by hand with a 1.5 m center to center distance between adjacent beds on 12 Sept. 2013. Onion seedlings were transplanted by hand into beds mulched with a sheet of transparent polyethylene on 6 Nov. 2013 after harvesting rice. Beds for experiments were formed on 160 cm center to center between adjacent beds with a bed width of 120 cm and a height of 15 cm. Each bed was planted with 6 rows of transplants with 21.7 cm between rows and 12 cm in-row spacing resulting in a plant density of 31.3 plants per m2. The area for each plot was 16.0 m2. Matured onion bulbs were harvested on 11 June 2014, when there was a significant softness in the onion necks and approximately 90 - 100% foliar top-down with the drying of leaves at 30 - 50%. For the second growing season, onion seeds, cv. Haewangball (an F1 hybrid, intermediate-day cultivar for fall transplanting) were sown on 6 Sept. 2014, onion seedlings were transplanted on 3 Nov. 2014, and onion bulbs were harvested on 1 June 2015. Other agricultural practices, including weed, pest and drainage management, were performed according to the participating farmers’ usual practices based on an onion production guide (Choi et al., 2013). The experiment designs were a randomized complete block with 3 replications.
The formulation of CRF was 18-3.1-7.5 (each N, P, and K, Danhanbeon, Chobi, Republic of Korea), and as an N source, 50% polymer-coated urea-N and 50% urea-N plus diammonium phosphate-N were blended. The source of phosphorus (P) fertilizer was diammonium phosphate and the sources of K were 30 - 40% of sulfate of potash and 60 - 70% of chloride of potash. The CRF application rate treatments were based on soil test recommended N rate, and comprised of CRF 25% (25% rate, 267 CRF kg ha-1, 48N-8P-20K kg ha-1), CRF 50% (50% rate, 533 CRF kg ha-1, 96N-16P-40K kg ha-1), CRF 100% (100% rate, 1,067 CRF kg ha-1, 192N-33P-80K kg ha-1), CRF 150% (150% rate, 1,600 CRF kg ha-1, 288N-49P-120K kg ha-1). The Separated N, P and K fertilizer treatments were composed of NPK once (192N-46P-88K kg ha-1, once applied as basal fertilizer at bed preparation) and NPK 3-split (64N-46P-35K kg ha-1, applied as basal fertilizer, and 128N-0P-53K kg ha-1, twice applied as additional fertilizer in mid-February and mid-March). Non-fertilized plot was check. Phosphorus was applied as fused phosphate and K as sulfate of potash for separated NPK. Beef cattle manure compost was applied at approximately 30 Mg ha-1 before soil plowing in each growing season.
Meteorological data
Mean, minimum, and maximum daily air temperature, total sunshine duration, and rainfall of each year were obtained from annual reports presented by the regional weather station in Habcheon (35°56'51"N, 128°16'99"E, 32 m) county, operated by the Korea Meteorological Administration (KMA, 2021). The straight line distance between the experimental sites and the weather station was approximately 25 km.
Mean daily air temperature during the onion growing seasons was 0.3°C higher in 2013/2014 than in 2014/2015 (Table 1). Mean daily air temperatures were 0.8 and 1.4°C higher in November and January, respectively, in the 2013/2014 than in the 2014/2015 growing season, while from February to April, 0.9 lower in the 2013/2014 than in the 2014/2015. Rainfall from April to May was 59.4 mm more in the 2014/2015 than in the 2013/2014 growing season, which resulted in higher relative humidity and shorter sunshine duration in the 2014/2015.
Table 1.
Mean, maximum and minimum daily air temperature, relative humidity, duration of sunshine, and rainfall during the 2013/2014 and 2014/2015 growing seasons.
Soil analysis
Soil samples were collected before compost and fertilizer application. Two cores of soil were sampled at 10 to 20 cm depths with a 100 cm3 core sampler (HJD-1812, Heungjin, Korea) in two different sites per plot to determine bulk density. Soil for nutrient analysis was sampled at a 10 to 30 cm depth using a single Edelman auger (Ø4 cm, Eijkelkamp, The Netherlands) in 3 sites. Fresh soil samples of 10 g were extracted with 40 mL 0.01 M CaCl2 solution for 15 min, filtered with No. 2 filter paper (Griffin et al., 2011), and analyzed for NO3-N by reflectometry (RQ plus, Merck, Darmstadt, Germany). The remaining soil samples were dried at approximately 20°C indoors for 5 days, then sieved with a 2 mm sieve. Soil samples for analyzing P and exchangeable cations were extracted using the Morgan extractant (McIntosh, 1969). Phosphorus in the extracted soil was analyzed with a spectrophotometer (UV 2450, Shimadzu Co, Kyoto, Japan). Exchangeable cations were measured with an atomic absorption spectrophotometer (novAA 300, Analytik Jena GmbH, Jena, Germany). Soil pH and electrical conductivity (EC) were determined with a pH meter and a conductivity meter (Thermo Scientific Orion, Beverly, MA), respectively, using a 5:1 deionized water:soil ratio. Soil samples for NO3-N determination during the growing seasons were collected at 133, 158, 186 and 215 days after transplanting (DAT).
Soil electrical conductivity, nitrate nitrogen and sulfur content before the experiment were significantly higher in the 2014/2015 than in the 2013/2014 growing seasons (Table 2). The optimum range for onion crop production includes 6.0 - 6.5 pH, <2.0 dS m-1 EC, 25 - 35 g kg-1 OM, 129 - 168 mg kg-1 of av. P, and 0.7 - 0.8, 6.0 - 7.0, 2.0 - 2.5 cmolc kg-1 of exchangeable K, Ca and Mg, respectively (Jang et al., 2010). The soil OM and exchangeable cations contents were higher than the optimum ranges.
Table 2.
Surface soil physical and chemical properties at a depth of 0 - 30 cm before application of chemical fertilizer and manure compost.
Plant growth and bulb yield determination
Five plant samples per plot were randomly collected at 133, 158, 186, and 214 DAT. Plant height and bulb diameter were measured with a ruler and calipers, respectively. After counting the number of leaves, onion leaves were separated at the neck from bulbs and their weights were measured. At harvest, onions were collected by hand from 2.30 m2 (1.60 m in width × 1.44 m in length) equaling 72 transplanted units (including transplants that survived and those that died) in each of 3 replications for investigating bulb characteristics and yield. After counting the number of leaves from harvested plants, leaves were separated at the neck from the bulbs and all leaves of collected plants were weighed in the field. Weights of individual bulbs were measured after drying for more than two weeks at approximately 20°C indoors. Bolted, doubled, and rotten onions were culled as unmarketable. Marketable bulbs were categorized into the following size classes based on diameter: small (<60 mm), medium (≥60, <80 mm), and large (≥80 mm), according to agricultural product standards regulated by the National Agricultural Products Quality Management Service in the Republic of Korea. Each sample area yield was converted to total bulb weight per hectare. Stand reduction was calculated as the percent of onion plants lost from 72 transplanted units.
Plant analysis
Five representative plants at harvest were separated into bulb and green leaves, followed by estimation of fresh leaf and bulb weights (g plant-1). Leaves were chopped into pieces, approximately 2 cm2, and dried to a constant weight at 105°C for 2 h, and at 60°C for 22 h using a forced convection drying oven (SH-DO-100FG, M-Tech, Gunpo, Republic of Korea). Dried samples were used to estimate dry matter (DM), nutrient contents and uptakes in leaves. Skins of bulb were peeled to determine DM, total soluble solids content (TSS), pyruvic acid (PA), total flavonoids (TF), and total phenolics (TP) of onion bulbs. Each bulb was cut in half perpendicular to growing axis, and one half was immediately chopped into pieces approximately 2 cm2, and homogenized without water for 1 min in a blender (Food mix HMR-505, Hanil, Republic of Korea). The puree was poured on to filter paper (No. 6, Advantec, Tokyo, Japan), placed in a plastic beaker, and allowed to filter by gravity. After approximately 60 min, the sample was stored in 15-mL cupped vials and stored at 20°C, until analyzed. The other half was chopped into pieces of approximately 2 cm, and dried to a constant weight at 105°C for 2 h, and at 60°C for 22 h. Dried samples were used to determine DM, nutrient contents and uptakes in bulbs.
A 0.2 g sample of dried and ground tissue of leaves and bulbs was dissolved in concentrated HNO3 in a graphite digestion system (EcoPre, Odlab, Seoul, Republic of Korea). Potassium (K), calcium (Ca) and magnesium (Mg) contents were measured in dissolved samples using a novAA 300 atomic absorption spectrophotometer (Analytik Jena GmbH, Jena, Germany). The P content was determined colorimetrically using the ammonium-vanadate-molybdate method at 470 nm (Gericke and Kurmies, 1952). Carbon (C), N and sulfur (S) contents of ground samples were measured using an elemental analyzer (vario Max cube, Elementar, Langenselbold, Germany).
Nutrient use efficiency, as apparent nutrient recovery (%, ANR) of the onion crop, was estimated by dividing the difference between the total N uptake of onion fertilized (U) and not fertilized (Uo) by the nutrient amount provided to the crop (F) ((U- Uo)/F, Dobermann, 2007). This fraction was multiplied by 100 to obtain a percent ANR.
The TP content was measured with the Folin-Ciocalteau assay (Singleton and Rossi, 1965). The TF content was measured with an aluminum chloride colorimetric method as described by Zhishen et al. (1999). The PA content was determined by the method of Yoo et al. (1995) and calculated from a standard sodium pyruvate curve by a spectrophotometer (UV 2450, Shimadzu, Japan). The TSS content was measured with a hand refractometer (PAL-1, Atago, Tokyo, Japan), and expressed as % Brix.
Storage test
Harvested bulbs were put into 20-kg plastic boxes, dried at 20°C indoors for curing for approximately 1 month, and stored at 0 ± 1°C and 70 - 80% relative humidity. After storage of 1 month (August 11), 3 months (October 13) and 5 months (December 10), onions were separated into culls (rotted or sprouted, physiological disorder) and marketable, and weighed to calculate percent weight loss, rot loss, and marketable onions.
Statistical analysis
Data were analyzed with a 2-way analysis of variance (growing years and fertilizer type) using XLSTAT Basic (Annual version 2021.3.1 Addinsoft, New York, NY). Comparison among averages was analyzed by Fisher’s protected least significant differences.
Results and Discussion
Soil nitrate nitrogen content
Soil NO3-N content of preplant single fertilization in all CRF treatments and NPK was inclined to decrease after 133 DAT (Fig. 1). On the contrary soil NO3-N content of 3-split fertilization at transplanting, in February and March peaked at 158 DAT. Soil NO3-N content in CRF 25% or 50% rate was less in the difference between 133 DAT and 158 DAT compared to CRF 100%, CRF 150% or single application of NPK. Variation of soil NO3-N content between CRF 100% and single application of NPK having the same N application rate was not significant during the growing season.
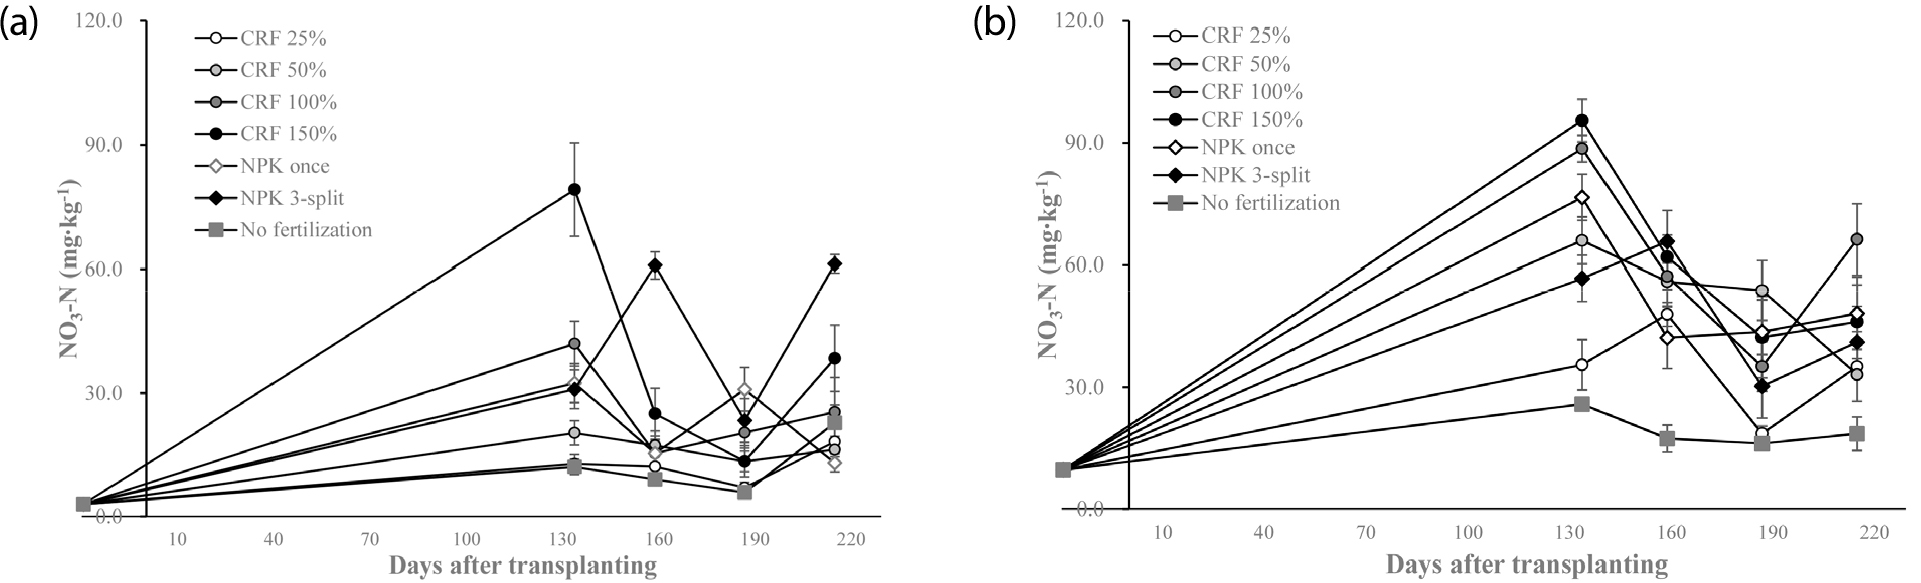
Fig. 1.
Effect of application rates of controlled release fertilizer (CRF) and application methods of NPK fertilizer on the soil NO3-N content during 2013/2014 (A) and 2014/2015 (B) growing seasons. Error bars represent the standard error. CRF 25%, 50%, 100% and 150% rates based on soil test recommended N rate; NPK once = single application of separated N, P and K fertilizers with 100% rate based on soil test recommended N, P and K rate; NPK three-split = basal and twice-split applications of separated N, P and K fertilizer.
In a study comparing combinations of urea and polymer-coated urea, no significant difference in soil NO3-N concentration was detected between treatments (Drost et al., 2002). Replacing higher proportions of N with methylene urea lead to slower NO3-N release, resulting in keeping the mineral content in soil solution low during the growing season for spring-sown bulb onion (Ristimäki and Papadopoulos, 2000). This result was consistent with our result that lower CRF rates of 25% and 50% decreased NO3-N contents in soil compared to single NPK application. However, higher CRF rates of 100% and 150% increased soil NO3-N contents at 133 DAT, which might be due to the release of a quite high amount of CRF-N for four months from late autumn to early spring. In addition, NO3-N originates from residual soil nitrate, irrigation water and N mineralized from organic materials during the growing season as well as applied fertilizers. Residual nitrate and N mineralization have been found to supply N to produce a good bulb yield with a small amount of N fertilizer or without N fertilization in fertile soils (Salo, 1999; Lee et al., 2012; Geisseler et al., 2022).
Plant growth and bulb yield
The number of leaves, plant height, and leaf and bulb weight were significantly greater in 2013/2014 than in 2014/2015 (Table 3), which resulted in greater marketable bulb yield (Table 4). Differences in the plant height, and leaf and bulb weight were not significantly different among fertilization methods, but were significantly lower in no fertilization than all CRF and NPK treatments in both growing seasons (Table 3).
Table 3.
Number of leaves, plant height, leaf and bulb fresh weights of onions as affected by application rates of controlled release fertilizer (CRF) and application methods of NPK fertilizer at 186 days after transplanting.
Table 4.
Comparison of bulb yield characteristics of onion as affected by application rates of controlled release fertilizer (CRF) and application methods of NPK fertilizer.
†Size categories in bulb diameter: large (≥8.0 cm), medium (≥6.0 and <8.0 cm), small (≥4.0 and <6.0 cm), and cull (<4.0 cm).
‡Stand reduction means the percentage of missing plants from transplanting holes in plastic film, the reasons of which are frost injury, bacterial diseases, maggot injury, and so on.
Higher mean daily air temperature from February to April, longer duration of sunshine and less rainfall from April to May in the 2013/2014 than in the 2014/2015 growing season might be more favorable to plant growth. In an overwintering onion, high temperature at the vegetative growth stage from February to April had a positive effect on plant growth and bulb yield (Lee et al., 2019). In addition, higher preplant soil EC in the 2014/2015 growing season might negatively affect root establishment and initial plant growth. Many previous studies have shown that salt accumulation or excessive input of nutrients has negative effects on plant growth and bulb yield (Westerveld et al., 2003; Shock, 2005; Lee et al., 2012, 2018b; Lee and Lee, 2014).
The marketable bulb yield was not significantly different among all treatments in the two growing seasons. Two-year average marketable bulb yield at NPK once and CRF 150% was 66.12 Mg ha-1 and 65.67 Mg ha-1, respectively, which were significantly greater than at CRF 25% and no fertilization. The CRF 50% produced 63.34 Mg ha-1 on a 2-year average, which was only 2.33 Mg ha-1 less than CRF 150%. The effect of application rates of CRF or the difference between CRF and NPK was not significant on onion growth and bulb yield in this study. Moreover, the bulb yield in no fertilization treatment was 88.5% level of NPK once having the greatest bulb yield.
The region where this trial was carried out had a double cropping system of onion and rice for over fifty years. Intensified agricultural practices, especially abundant animal manure compost or mixed oilcake fertilizer and chemical fertilizer application have been used for high crop productivity in this region. Many researchers contributed to determining N, P, and K fertilizer application rates or composted animal manure suitable for optimum yield with minimum cost. The main non-fertilized nutrient sources are composed of residual soil nutrients, nutrients in the irrigation water and rainfall, and nutrients mineralized from organic matter during the growing season, all of which are site-specific and can vary considerably (Geisseler et al., 2022). Nitrogen fertilization was of great importance for onion production, but also, higher N rates did not accompany higher bulb yield (Boyhan et al., 2007; Halvorson et al., 2008; Lee et al., 2011). Phosphorus or K fertilizer applied to onions provided a slightly positive effect, or frequently no effects on bulb yield (Amin et al., 2007; Boyhan et al., 2007). In a paddy soil having 46.3 g kg-1 organic matter and 1.6 dS m-1 electrical conductivity, increased fertilizer beyond the recommended rates and delayed split application timings decreased bulb yield (Lee et al., 2012). Composted cattle manure application at 40 Mg kg-1 produced maximum onion bulb yield. but application over the rate decreased the yield and accumulated soil fertility (Lee, 2012).
Our results showed that CRF had no significant positive effects on bulb yield compared with conventional fertilization. In addition, reduced CRF application rates enhanced nutrient use efficiency. The effect of CRF on onion growth and bulb yield varied, depending on fertilizer type, soil fertility, application rate or timing, crop demand, availability of non-fertilized nutrients and fertilizer use efficiency, etc. Drost et al. (2002) reported that a reduction of N applied from 224 to 168 kg ha-1 had little effect on onion bulb yield when the entire N was supplied from polymer-coated urea. Hartz and Smith (2009) presented that no yield advantage of CRF use in the lettuce and broccoli in California was observed, which may be attributed to the high N fertilization rates used by the growers. Jensen and Sanders (2001) reported in a two-year trial that CRF (Meister 25-10-8 applied in fall or Meister 26-11-9 applied in spring) applied at 65% and 80% of the N rate of standard fertilizer was not significantly different in marketable bulb yield as compared with the standard fertilization rate, which was similar to our result.
Plant mineral contents and uptakes, and nutrient use efficiency
Carbon, N, K, S, Ca, and Mg concentrations and uptakes in onion bulb were significantly higher in 2013/2014 than in 2014/2015 at harvest (Table 5 and Table 6), which was attributed to greater fresh bulb weight. Nitrogen content in the bulb was 1.47 g kg-1 in NPK 3-split application, higher than in the CRF 25% (1.24 g kg-1) and no fertilization (1.04 g kg-1) on a 2-year average. Potassium content in the bulb was 1.47 g kg-1 in the CRF 150% on a 2-year average, higher than in the CRF 25% (1.31 g kg-1), NPK once (1.30 g kg-1), NPK 3-split (1.35 g kg-1), and no fertilization (1.28 g kg-1). In the CRF treatments, N and K contents increased with higher fertilizer application rates in the bulb, while K, S and Ca contents in the leaf decreased with higher application rates. In the NPK treatments, N content in the bulb was higher in the 3-split application than in the single application while C, P and Mg contents in the leaf were higher in the single application than in the 3-split application.
Table 5.
Comparison of mineral contents in onion bulb and leaf at harvest as affected by application rates of controlled release fertilizer (CRF) and application methods of NPK fertilizer on a fresh weight basis.
†FW, fresh weight; C, carbon; N, nitrogen; P, phosphorus; S, sulfate; K, potassium; Ca, calcium; Mg, magnesium.
Table 6.
Comparison of mineral uptakes in onion bulb and leaf at harvest as affected by application rates of controlled release fertilizer (CRF) and application methods of NPK fertilizer.
Most of the nutrient uptakes in the bulb were not significantly different among CRF application rates and application methods of NPK except for no fertilization. In the CRF treatments, increased CRF application rates were inclined to increase N, K and S uptakes in the bulb, and K and Ca uptakes in the leaf. In the NPK treatments, N uptake in the bulb was higher in the 3-split application than in the single application while C, N, P K, S, Ca and Mg contents in the leaf were higher in the single application than in the 3-split application. Brown et al. (1988) reported that increased yields with sulfur-coated urea compared to pre-plant urea at low N application rates, but not at high application rates. In their study, the high application rate exceeded total N uptake by approximately 100 kg ha-1.
Although the N uptake of the unfertilized plot in the bulb was 61.9 kg ha-1 with 61.7% of NPK 3-split taking up the highest N on a 2-year average, the marketable bulb yield of the unfertilized plot was 58.53 kg ha-1, 90.3% of NPK 3-split. In addition, the C accumulation rate of the unfertilized plot was 93.4% of NPK 3-split. These results indicate that increased N uptake does not support the proportional increase of C assimilation and bulb weight. Salo (1999) found that the variation of N uptake at the same bulb yield level was considerable, although N uptake increases with increased fresh yield.
Apparent nutrient recovery of N, P, and K was significantly higher in 2013/2014 than in 2014/2015 (Table 7). The CRF 25% and CRF 50% receiving lower N, P, and K fertilizer application rates resulted in significantly greater nutrient use efficiency than other treatments having more application rate. The ANR of CRF 25% was 32.5% in N, 20.9% in P, and 76.1% in K on a 2-year average, which was approximately twice that of CRF 100%. In our study, Higher ANR at lower CRF application rates achieved the same onion bulb yield as higher fertilizer application rates. The N ANR invariably declined linearly with the increase in fertilization rate because the luxury consumption of N by onions is small (Greenwood et al., 1989, 1992). Nitrogen ANR in onions has been reported to be between 20 and 40% (Greenwood et al., 1989; De Visser et al., 1998; Lee et al., 2011) or lower (Halvorson et al., 2008).
Table 7.
Comparison of nutrient use efficiency in onion bulb and leaf at harvest as affected by application rates of controlled release fertilizer (CRF) and application methods of NPK fertilizer.
†The difference in nutrient uptake in the whole plant between the fertilized and unfertilized crop relative to the quantity of nutrients applied.
In the NPK treatments, the apparent recovery efficiency of N, P and K between single basal application and a 3-split application was not significantly different, although N recovery efficiency in NPK 3-split having split application was slightly higher than in NPK once. The CRF 50% was higher in recovery efficiency of N, P and K than NPK once or NPK 3-split. Moreover, The marketable bulb yield of CRF 50% was the same as that of CRF 150%, NPK once, or NPK 3-split with higher fertilizer application rates.
Antioxidant compound and storage quality
Total soluble solids and TF content are higher in the 2013/2014 growing season than in the 2014/2015, while PA and TP contents are higher in the 2014/2015 growing season than in the 2013/2014 (Table 8). Organic compounds such as TF tended to increase in the year with higher air temperature and global radiation, and less rainfall and more sunshine duration during the growing season, especially at the bulb development stage (Rodrigues et al., 2011; Lee et al., 2018a). Total soluble solids content was negatively correlated with bulb size (Yoo et al., 2006; Mallor et al., 2011). Our study showed higher TSS in the 2013/2014 growing season with greater bulb weight and yield, and PA and TP content were higher in 2014/2015. This result could be attributed to poor vegetative growth, followed by less nutrient absorption and C assimilation in the 2014/2015 growing season. Total flavonoids content in the CRF 25% and zero rates was 201.9 mg QE kg-1 and 187.4 mg QE kg-1 on a 2-year average, respectively, the highest among all the treatments. However, TSS, TP and PA content did not show a consistent tendency as affected by fertilizer type or application rates.
Table 8.
Comparison of organic compounds in onion bulb at harvest as affected by application rates of controlled release fertilizer (CRF) and application methods of NPK fertilizer.
Storage loss was higher in the 2014/2015 growing season than in the 2013/2014, which might be due to poor vegetative growth as previously mentioned (Table 9). Rot and weight loss in six months after harvest was the highest in CRF 150% having the highest application rate, and higher in the NPK once than NPK 3-split. Although the CRF treatments with less or the same application rates based on soil test recommended N rate and no fertilization were lower in total storage loss as compared with the CRF 150%, there were no statistical significances. Many researchers reported that the increase in N supply had resulted in a decrease in onion bulb dry matter and deterioration of stored bulb quality (Maier et al., 1990; Henriksen and Hansen, 2001; Zeka et al., 2009; Lee et al., 2012).
Table 9.
Comparison of storage loss of onion bulb as affected by application rates of controlled release fertilizer (CRF) and application methods of NPK fertilizer.
In conclusion, the CRF application at a 50% reduced rate based on soil test recommended N rate satisfied crop demand of available nutrients through improved nutrient use efficiency, and achieved the optimum bulb yield in overwintering bulb onions. The results should be adapted for bulb onion production under residual soil nutrients at more than 1.5 dS m-1 EC and more than 35 g kg-1OM in preplant soil.
