

Introduction
Tillage is a practice that could help with sowing and transplanting, encourage germination, hinder weed growth, increase soil air and water permeability, and enhance crop growth and productivity. It can cause physical, chemical, and biological changes in the soil environment by changing soil structure (Rasmussen, 1999; Sarkar et al., 2007, Osunbitan et al., 2005), soil water and evaporation (Cornelis et al., 2002; Schwartz et al., 2010; Mitchell et al., 2012; Sharratt, 1998; Gruber and Claupein, 2009). Especially, tillage during non-cultivated season from late autumn to early spring can influence on soil water status and nutrient mineralization (Gauer et al., 1982; Radke et al., 1985; Rydberg, 1990; Bhatt and Kukal, 2014, Bhatt and Kukal, 2015), which might accelarate or redue spring drought depending on soil conditions like crack patterns and weed growth (Bandyopadhyay et al., 2003; Karmakar et al., 2005; Sillon et al., 2003). Recently increasig the frequency and intensity of drought requires soil-specific water saving farming strategy (UNESCO, 2001; Saccon, 2018). Rice cropping as a main food resource in Asia is primarily done under paddy soil conditions, periodic change from saturated with puddling before transplanting of rice seeding to unsaturated soil media with drain at late gowth stage of rice (FFTC, 1989). Most of region in Korea have experiences of spring drought. Simultaneously, in this season, water requirement of rice fields is generally high for land preparation and successful rice transplanting but mostly filled with artifical irrigation. In May, late spring, rice cultivation mostly begins (Kyuma, 2004). March and April mostly belong to non-cultivation period, but relatively show high reference evapotranspiration of rice non-cultivation season. In this period, tillage effect on water consumption of paddy soil has an importance in determining the water requirement of land preparation in rice field. Especially, surface soil structure can be dispersed and hardened by rain drops and thereby tillage effect might not act. (Plaster, 1992). Therefore, this study was pursued to evaluate the responses of soil water and evapotranspiration (ET) to no-tillage and tillage practices and raining conditions in three different types of paddy soil using monolithic weighable lysimeters, precisely measuring evapotranspiration in undisturbed soil conditions.
Materials and Methods
Study site and soils
The experiment was undertaken at the lysimeter station of the National Institute of Agricultural Sciences (NAS) in the southern part of South Korea (35°49'29"N, 127°2'46.4"E, sea level 33m). Undisturbed soil monolith lysimeters were utilized, which were designed with a 1 m2 surface area and a depth of 1.5 m, described in Seo et al. (2016). Three different types of paddy soil were extracted in surrounding areas and filled in individual lysimeters: silty clay loam soil involved in the Buyong series (Bg) of the fine, mixed, mesic family of Typic Endoaqualfs and loam and sandy loam soils included in the Gangseo series (Gt) of the coarse loamy, mixed, mesic family of Anthraquic Eutrudepts (RDA, 2015). And the soil horizons through the profile were named according to Schoeneberger et al. (2012). The silt and clay contents were high in the silty clay loam soil, showing 57% and 39% respectively on average for the entire soil profile. The loam soil had a higher silt content of approximately 45% above 89 cm depths than the sandy loam soil, but it displayed a higher sand content below depths of 89 cm. The sandy loam soil showed approximately 56% and 37% of average sand and silt contents, respectively. The hydrometer method (Gee and Bauder, 1986) was used to measure the soil particle ratio. The soil bulk density was measured by sampling soil cores (7.5 cm diameter core) at every layer Core method; ( Blake and Hartge, 1986). The bulk density ranged from 1.11 to 1.40 Mg m-3 in the silty clay loam soil, from 1.20 to 1.47 Mg m-3 in the loam soil, and from 1.20 to 1.42 Mg m-3 in the sandy loam soil. The highest bulk density was observed at depth of 20-40 cm in the loam soil (Table 1). Organic carbon was determined by wet digestion method as described in Tyurin (1931) and expressed as organic matter using Van Bemmelen factor 1.724. For determining available P2O5, the extracting phosphate was followed with the Lancaster method described by Alban et al. (1964) and then molybdate-reactive phosphorus in the extract was measured with Kuo (1996).
Table 1. Physico-chemical properties of three different soils used in this study.
Experimental description
The experiment was carried out by using weighing lysimeters with the silty clay loam, loam and sandy loam soils in spring season before rice cultivation practices, from Mar. 8 to Apr. 30 in 2016. Two management strategies, no-tillage (termed as NT) and hand tillage (termed as HT), were applied to the lysimeters with the three soils. Three treatments were manually tilled by soil knife (Hori hori; Nisaku, Japan) with a 5 cm width because the use of a machine was not possible on the lysimeters. Tillage was done to an approximate depth of 8 cm (5-10 cm) on Mar. 8, 2016 (DOY 68). The tillage depth did not exceed 10 cm in order to observe variations at surface layers. Rice stubble and weeds were mixed with soil by tillage operations. Rice stubble remained after harvesting without crop residues on the surface, and weeds were not pulled up in order to reflect a natural state. All treatments were simply managed as rain-fed without irrigation.
Data measurement and analysis
Two variables, soil water tension and evapotranspiration, were evaluated as the response to no-tillage and hand tillage practices. Soil water tension was observed by tensiometer (Tensio 160; UGT, Germany) horizontally inserted at a depth of 0.3 m for individual lysimeters. Evapotranspiration was determined by the difference between total water output and the amount of drainage. Drainage data was obtained by tipping counter (UGT, Germany), which measures the amount of drained water by counting every 100 ml of water accumulated in a bucket. Water balance in a lysimeter could be expressed as:
| $$\Delta S=(P+1)‑(ET+D+RO)$$ | (Eq.1) |
where ΔS is the variation in soil water (mm), P is precipitation (mm), I is irrigation (mm), ET is evapotranspiration (mm), D is drainage (mm), and RO is surface runoff (mm). Irrigation was not considered and there was no surface runoff overflowed from a lysimeter vessel during the study period. Thus, the water balance equation could be re-expressed as:
| $$\Delta S=P‑(ET+D)$$ | (Eq.2) |
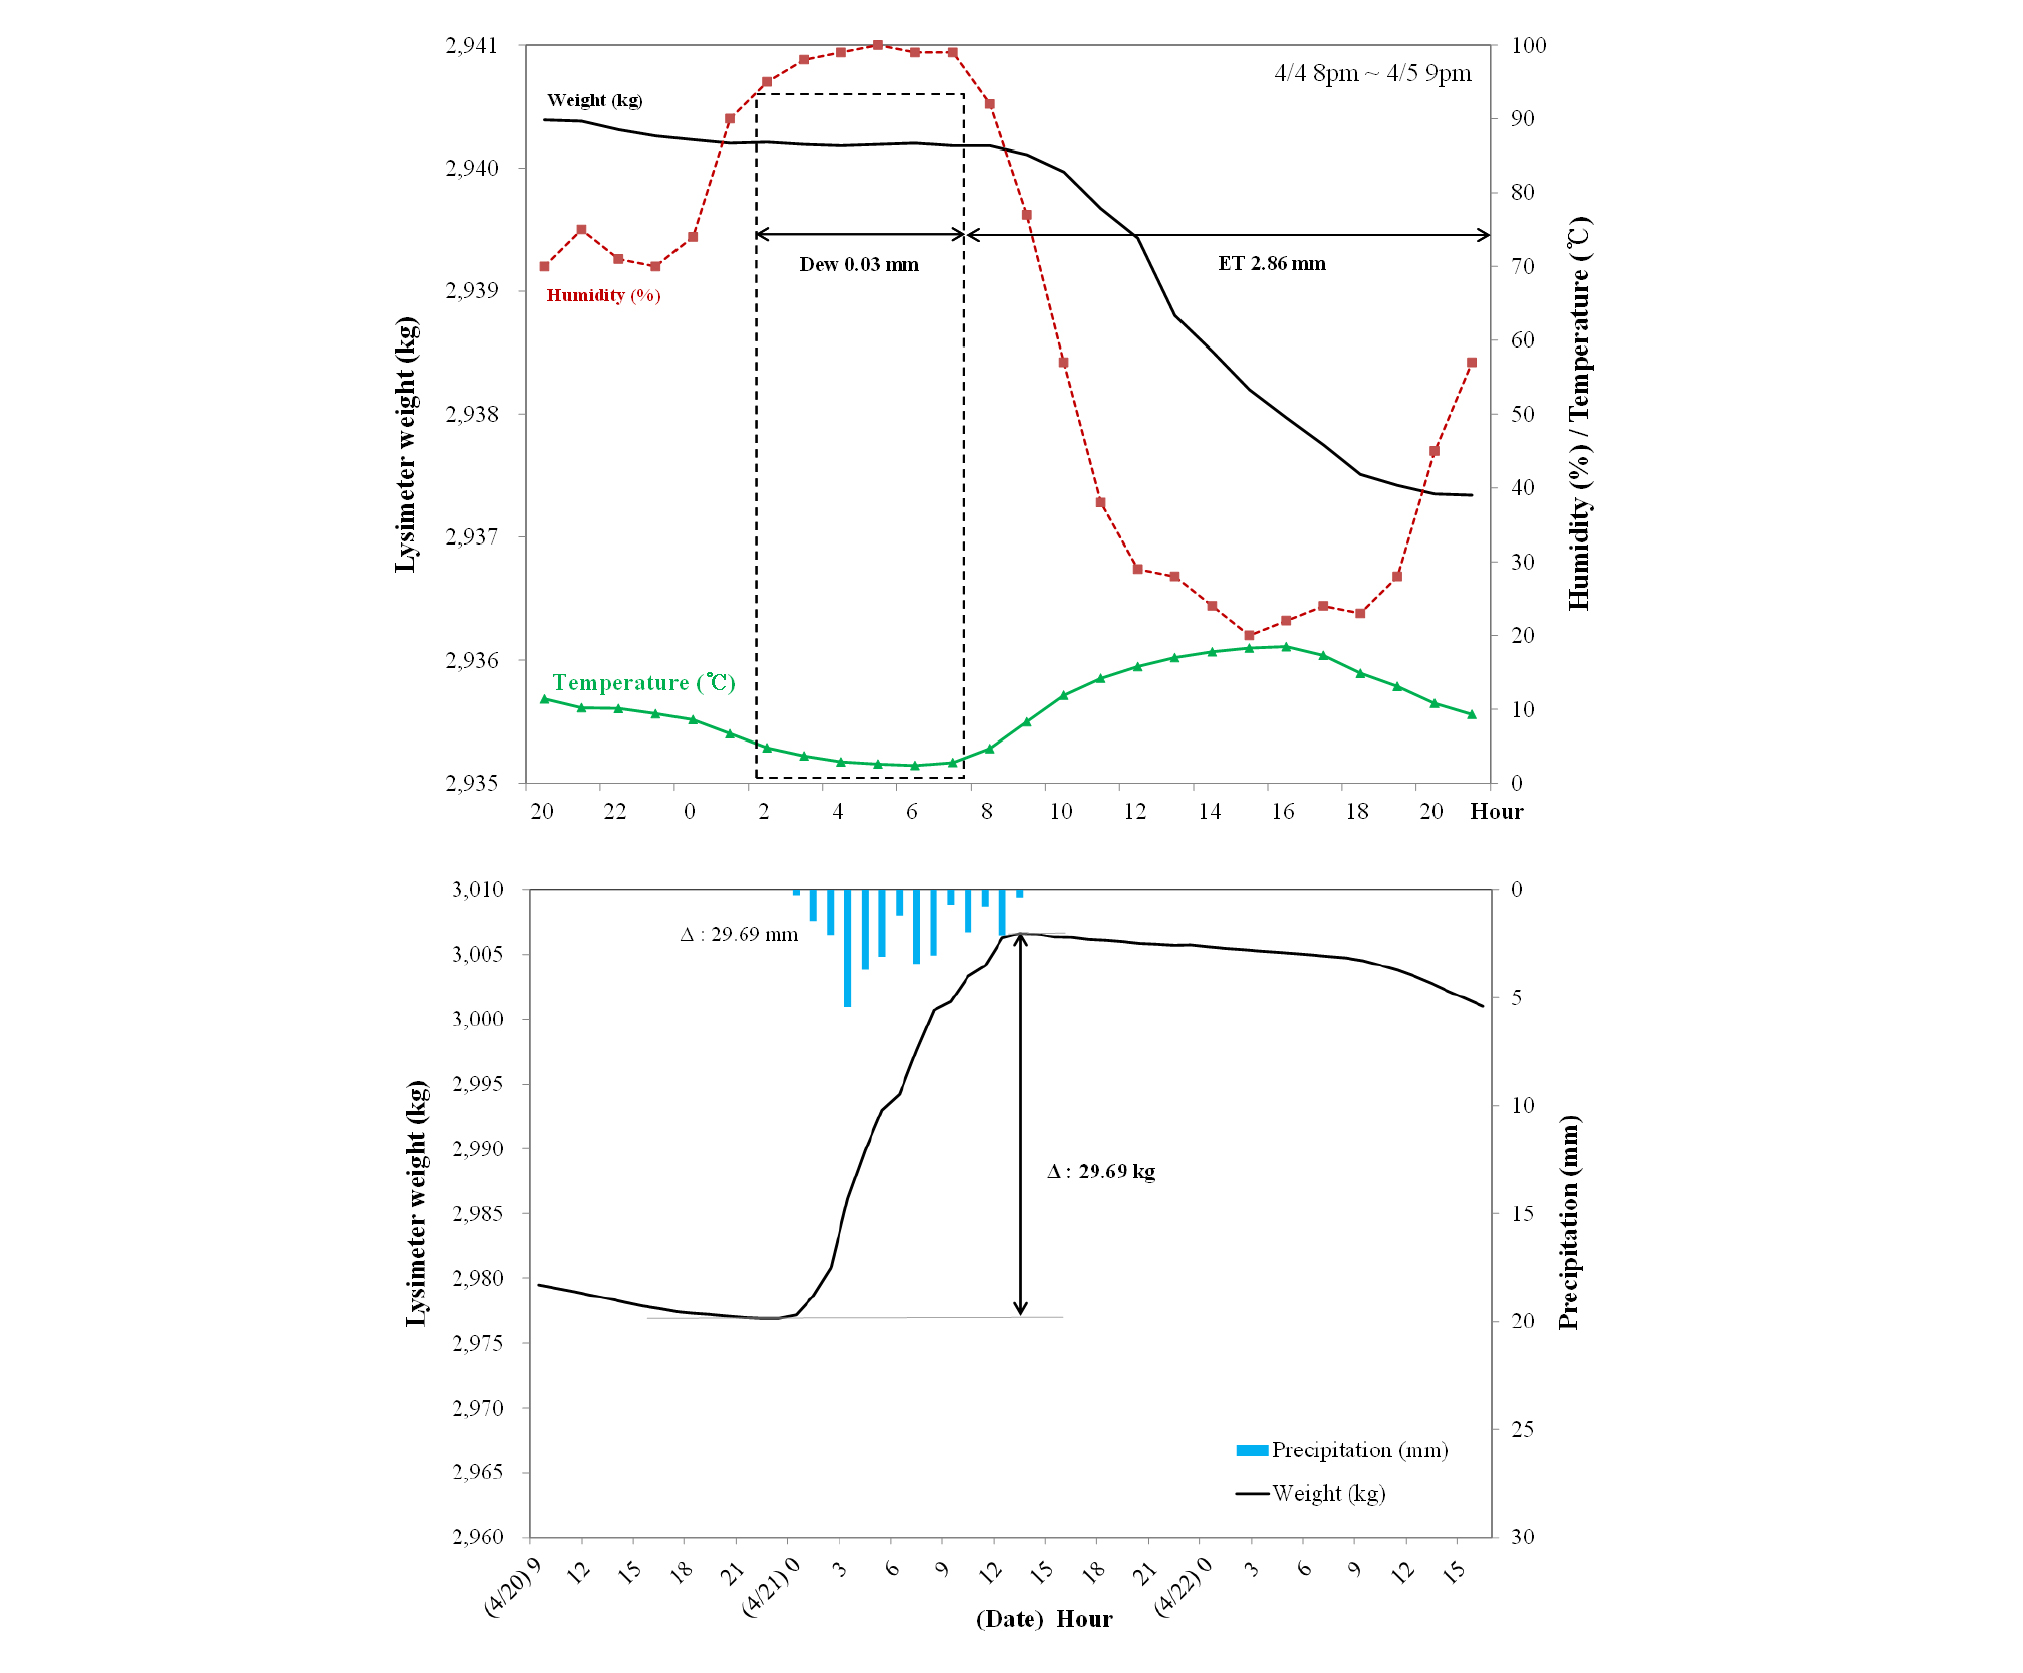
Weighing lysimeters use three load cells supporting a lysimeter vessel with a 10 g high-resolution accuracy in measuring weights. It is able to measure exactly and directly data for water balance components from mass changes of a lysimeter. Fig. 1 shows the capability of a lysimeter for exact and direct measurements, both of water consumption like evapotranspiration and input like rainfall or dew to a lysimeter.
Weather conditions, including air temperature and rainfall, were monitored using the Automatic Weather System (AWS; STA Corp., South Korea) located at a height of 2 m above ground at the lysimeter station.
All data were accumulated as an hourly time step and compiled on daily basis except soil water tension. Weeds began to appear on soil surface in the spring season and weed growth was thus considered. For weed growth, the height was measured at three spots of each treatment three times (Apr. 12, 20, 29) during the study period. The dry weight was measured with of weeds sampled only on Apr. 29. The spring period started from the tillage (Mar. 8) and was analyzed respectively for dry and rainy periods based on the rain amount and soil water change. Analysis of variance (ANOVA) was performed to analyze the impact of NT and HT on evapotranspiration and weed growth. Duncan’s Multiple Range test (DMR at p < 0.05) was applied using the Statistical Analysis System (SAS; SAS Institute, US).
Results and Discussion
Spring weather conditions
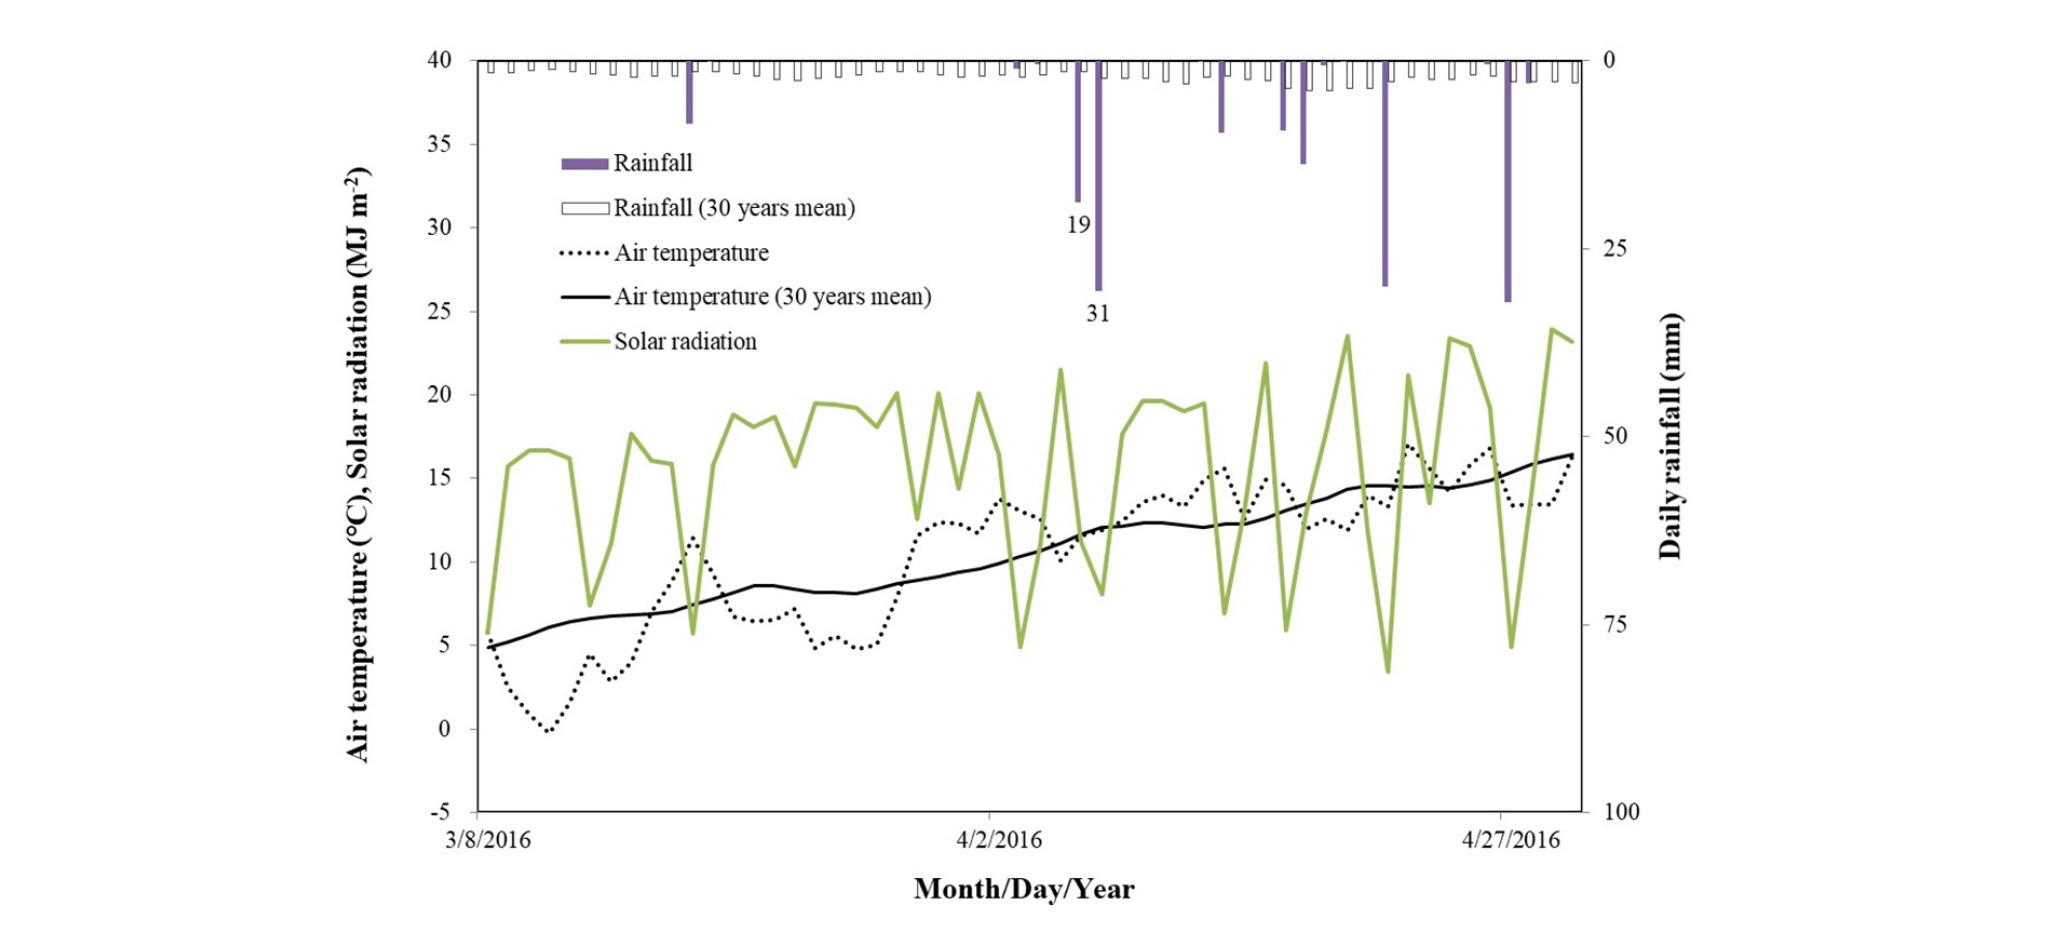
Increasing air temperature in early spring activates soil biota and enhances soil evaporation. In the study period from Mar. to Apr. in 2016, the air temperature was averagely similar to 30 years mean (1981-2010) with periodical flucuation (Fig. 2). Rainfall amount were, on the other hand, different from the 30 years mean (KMA, 2011). During about one month, from Mar. 8 to Apr. 5, called dry period, it was much lower rainfall than the 30 years mean, whereas the other month, from Apr. 6 to Apr. 30, called rainy period, was the reverse. There was only 8 mm of rainfall during the dry period whereas 144 mm of rainfall was during the rainy period. Rainfall was almost two times that of the 30-year mean in April because of several rainfall events over 30 mm. In particular, the rainfall events on Apr. 6 and 7 indicated the greatest amount of rainfall during the study period. The solar radiation of clear day gradually increases as time goes during spring, but the solar radiation sum during dry period, 450 MJ m-2, was higher than that during rainy period, 398 MJ m-2, because of more clear days during dry period. In 2016 spring of this experimental field, two contrary periods in weather condition was used to analyze the effects of tillage on soil water status and evapotranspiration in paddy soils.
Tillage effects on soil water tension at 30 cm soil depth with three different soils
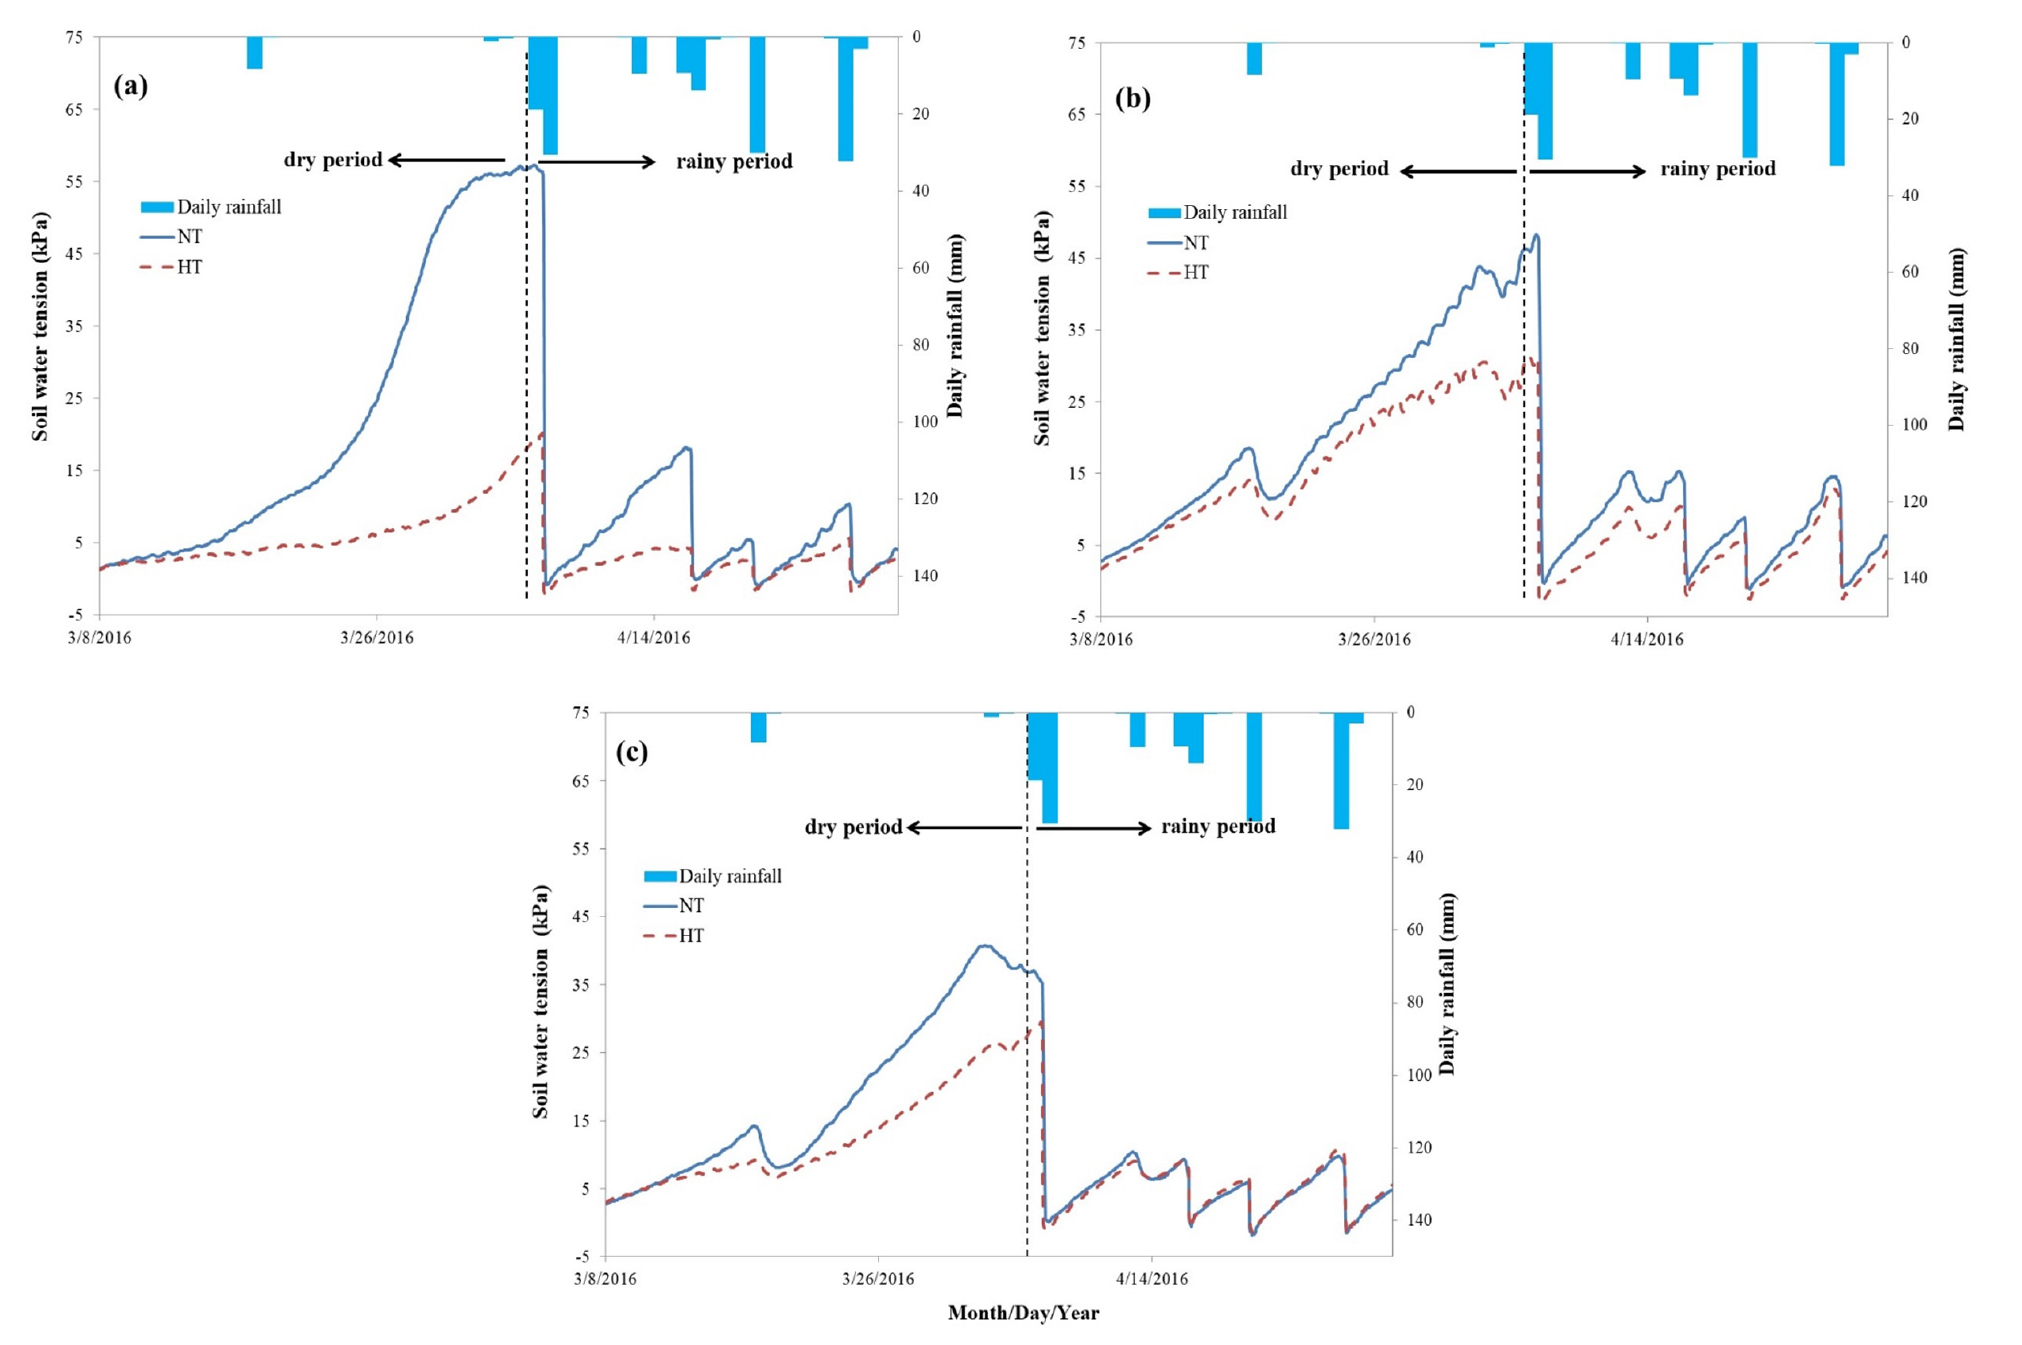
The soils at 30 cm depth of all three soils had highest bulk density of horizons composig of the soil profile (Table 1). The compacted layer below surface soil in paddy field could result from annual process of puddling and reworking the surface soil and act as the restricted zone of water transport in paddy field (Han et al., 2010). So, we monitored the hourly soil water tension at 30 cm depth as affected by tillage treatement and different textures. The maximum value of the soil water tension over the study period was highest in silty clay loam soils of NT treatment, 57 kPa, and decreased in the oder of the loam soils of NT, the sandy loam soils of NT, loam soils of HT, sandy loam soils of HT, and silty clay loam soils of HT treatment. The results indicated the NT had higher soil water tension than HT and that finer textures of NT with higher soil water tension. Besides, silty clay loam had the opposite extreme like highest in NT but lowest in HT treatments of three soils.
After rainfall from Apr. 6 to 7, 50 mm, soil water tension deceased to around zero. Over the rainy period, silty clay loam soil still had higher tension in NT than that in HT, but the differences between the tensions was relatively narrow, compared to dry period. in coaser texture soils, the differences had negligible.
The soil water tension has an inverse proportion with the equivalent pore size described as capillary rise force (Hillel, 1998). This means higher soil water tension had more water-empty soil pores larger than the equivalent pore size, in other words, lower water content, on terms of soils with same geomtery. Seo et al. (2017) showed different layers and soils had different soil water retention curves. Silty clay loam soil in this study had high clay content above 35%, which could be easily shrunk and cracked on the surface (Cabangon and Tuong, 2000). The crack generation could result in larger surface area exposed to atmosphere water demands (Adams and Hanks 1964; Ritchie and Adams 1974). The high soil water, low tension, in the HT treatment of three soils, compared to NT, might be because the continuity of large pores such as cracks and biopores from soil surface was transected by tillage practice (Cabangon and Tuong, 2000; Palmer et al., 2011).
Evapotranspiration and weed growth in dry period as affected by tillage
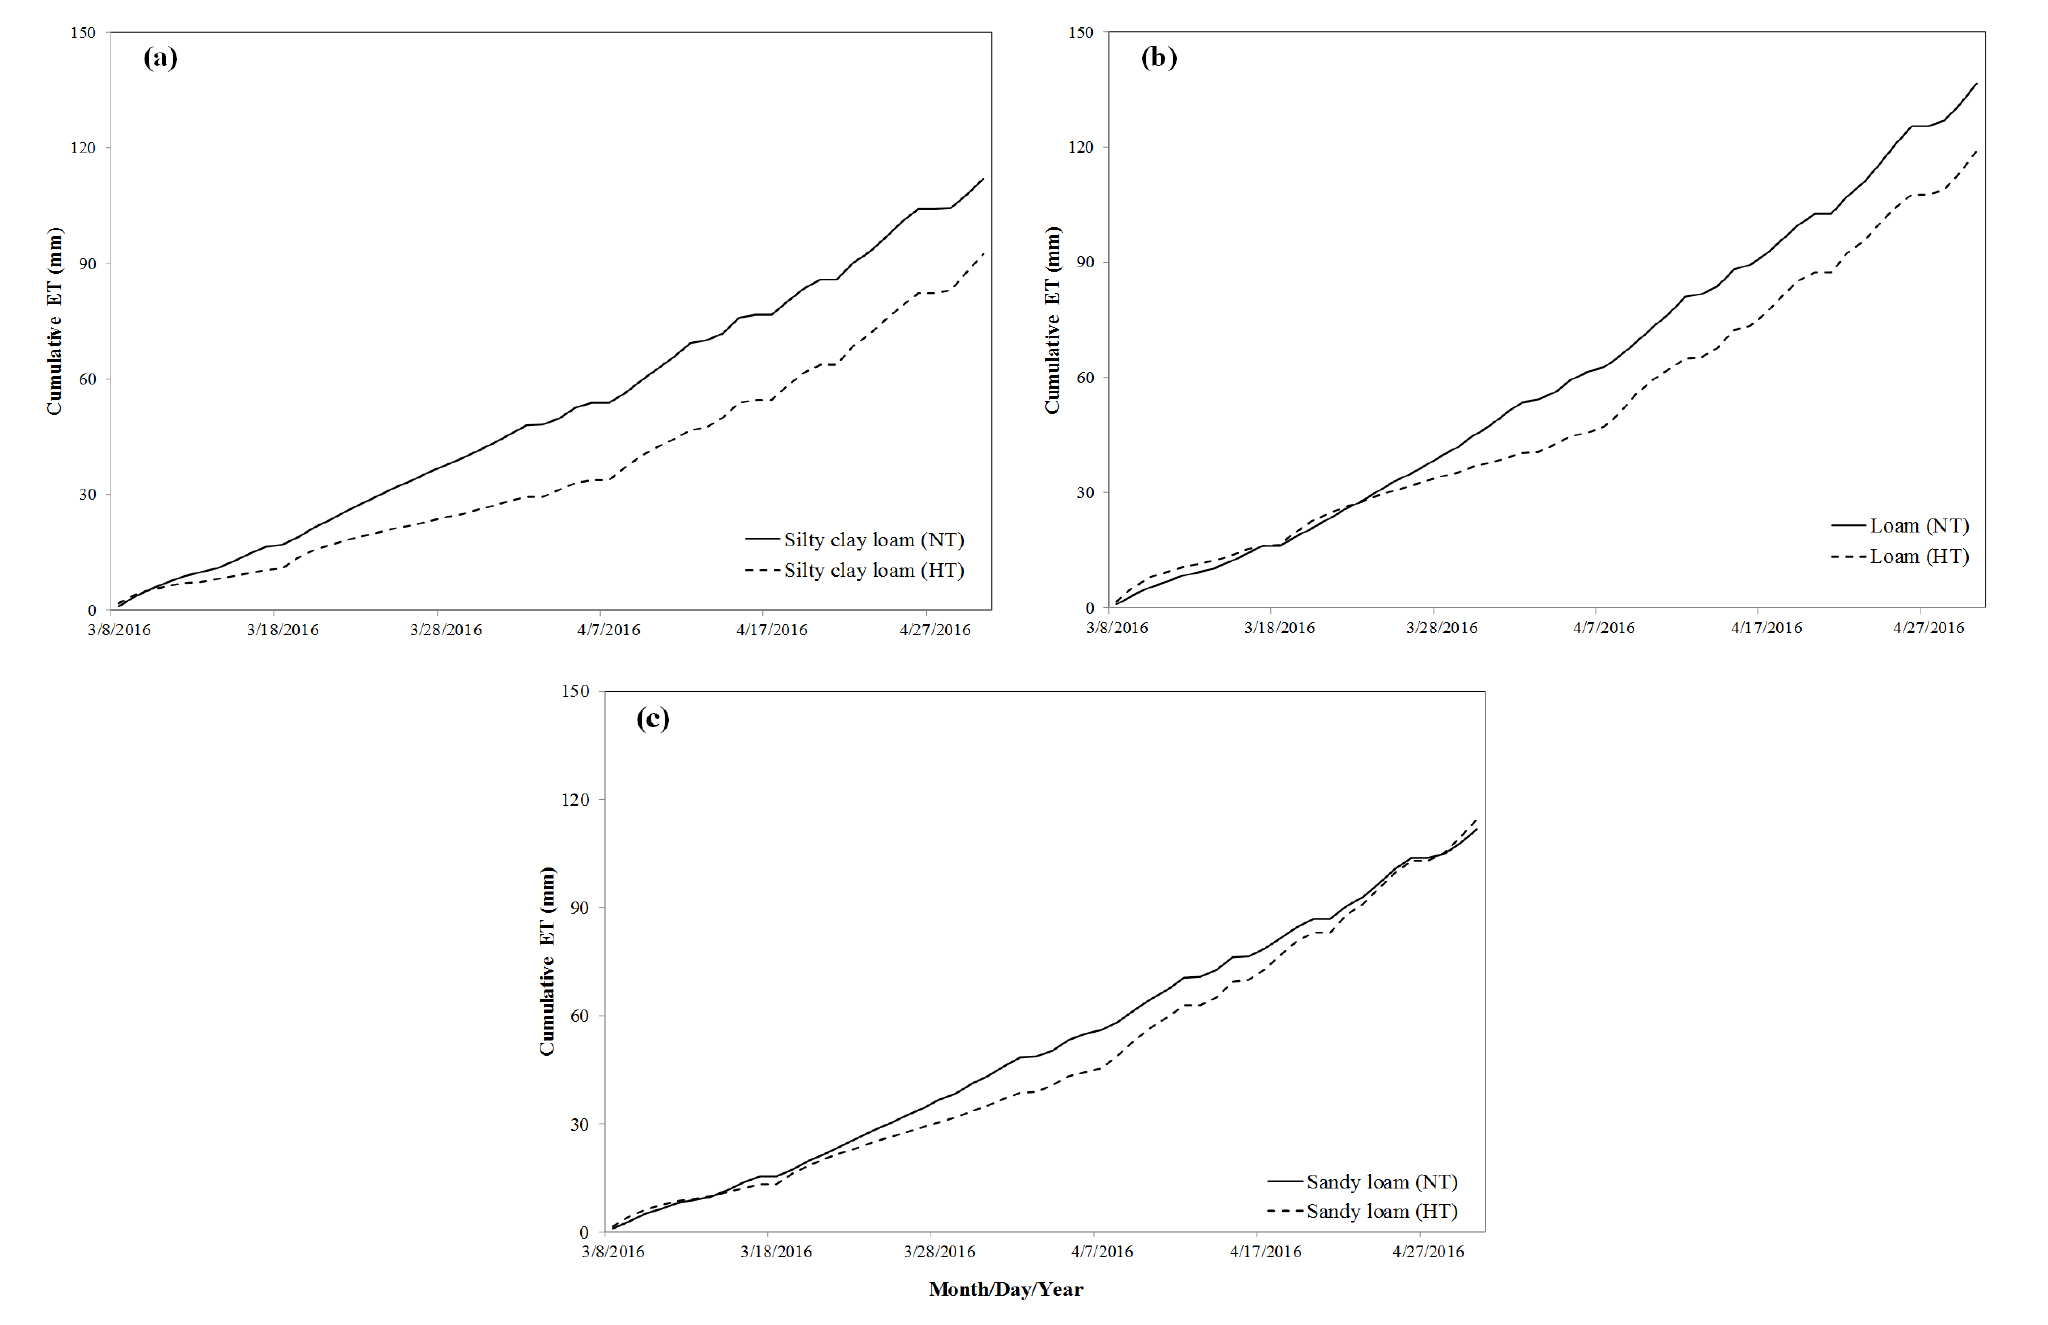
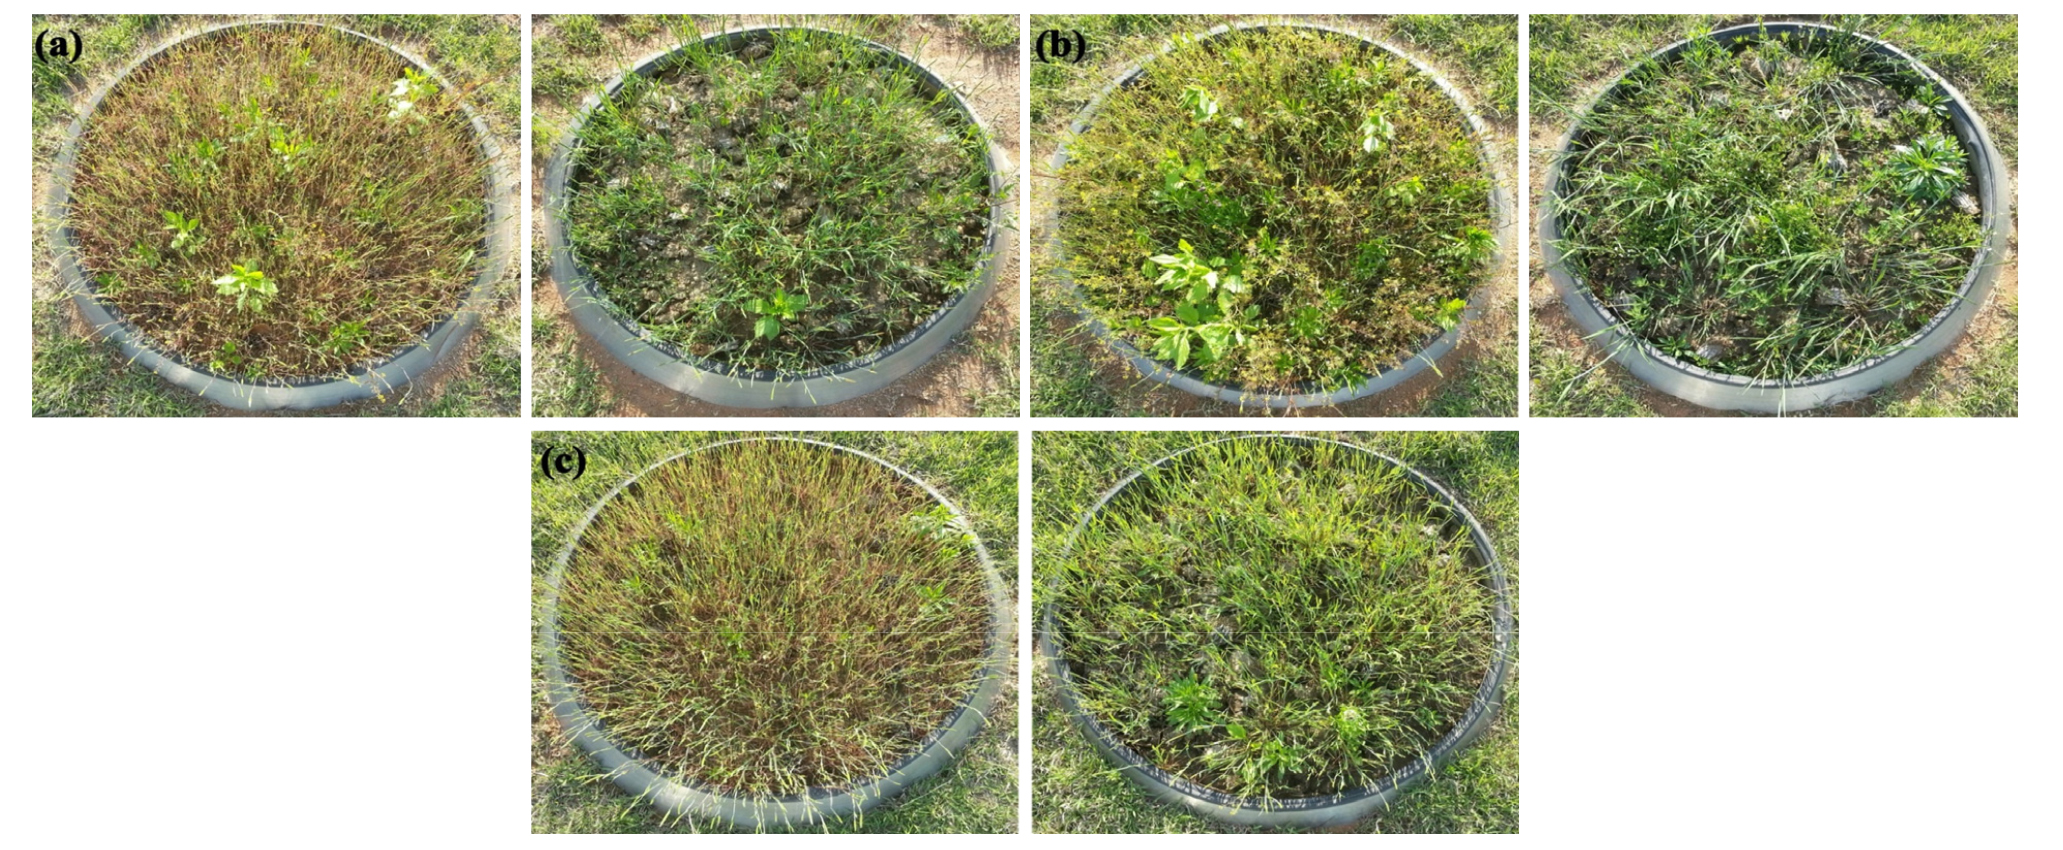
The dry period from Mar. 8 to Apr. 5 had higher ET was in NT than HT under all soils (Table 2 and Fig. 4). A total of 53 mm and 33 mm were evaporated respectively for the NT and HT treatments in the silty clay loam soil, 60 mm and 45 mm in the loam soil, and 53 mm and 43 mm in the sandy loam soil. The results could be explained by the impact of weeds and capillary rise. The lysimeter surfaces were dominated by weeds, primarily slender spike rush (Eleocharis kuroguwai Ohwi) and shortawn foxtail (Alopecurus aequalis), and the former type was much more dominant than the latter type. The NT treatments showed the weed dominance whereas the HT treatments showed the reduction of weed population by tillage practice (Fig. 5). Tillage practice destroyed young seedlings of weeds that are easily buried or ripped out of soil (Plaster, 1992). The higher soil water tension was accordingly induced in the NT treatments due to the soil water extraction by capillary rise caused by higher ET in the NT treatments (Fig. 3). On the other hand, tillage practice broke capillaries and impeded capillary rise by atmospheric water demand with increased solar radiation, resulting in lowering ET in the HT treatments (Sillon et al., 2003; Brady and Weil 2008; Schwartz et al., 2019). Weed transpiration and capillary rise in no-tillage could cause higher water consumption than in tillage treatment, which means tillage operation with water saving effect in paddy soils for the dry period except sandy loam soil.
Table 2. Periodically cummulative evapotranspiration amounts during spring (Mar. 8, 2016 - Apr. 30, 2016) periods for NT† and HT‡ treatments under the silty clay loam, loam, and sandy loam soils.

Evapotranspiration and weed growth in rainy period as affected by tillage
On the end of dry period, it had high rainfall amount, 50 mm. Soils were nearly satureted or perched at 30 cm soil depth. The rainy period from Apr. 6 to Apr. 30 had relatively low soil water tension with several rainfall events, compared to dry period. Unlike dry period, ET revealed a similar level between NT and HT without statistical significance under all soils. As seen in Fig. 4, the slope of the cumulative ET in the HT treatments became steeper after Apr. 6 than before. The HT treatments generally produced lower height and lighter weight of weeds than the NT treatments, but the statistical significance was not revealed between NT and HT in many cases (Table 3). In particular, the sandy loam soil showed the higher ET for HT rather than NT while the silty clay loam and loam soils indicated a slight difference with higher ET for NT than HT (Table 2). This was probably due to the high clod dispersion of coarse textured soil with a relatively low content of cement agent such as clay (Lal and Shukla, 2004).
Table 3. Weed heights and dry weights in spring for NT† and HT‡ treatments in the silty clay loam, loam, and sandy loam soils.
On Apr. 29, the dry weight of weed, loam soil with NT treatment had higher value than any other lysimeters, and the total ET sum was the same. This is probably because loam soils had relatively high fertility such as organic matter and available phospate contents (Table 1). Nutrient mineralization, especially rainy days next to dry condition after tillage operation, could enhance the vegetative growth of plant (Kyuma, 2004), showing more green leaves in tillage treatment of all three soils in Fig. 6. The various factors, including soil pore geometry, capillary rise, weed growth, weather, and fertility, and complex interactions betweens the factors could result in no significant tillage effect on total spring season including the dry and rainy periods before rice cropping. Nevertheless, in drought condition, tillage operation in early spring could heip to decease water loss by evapotranspiration.
Conclusion
Through this study, we could understand the variation in evapotranspiration by various factors such as cracks, weed, and capillary according to weather changes and soil types under no-tillage and tillage practices. In spring dry period, tillage had low evapotranspiration and high soil water storage, compared to no-tillage. However, frequent spring rainfall events could offset the tillage effect for water-saving through the dispersion of clods and the reconnection of capillaries, and nutrient mineralization in rewetting after surface tillage could promote ET through better weed growth.
