

Introduction
Geography and Spatial Distribution of Land in China
Characteristics and Types of Land Use in China
Changes of Arable Land Areas in Chin
Conclusion
Introduction
FAO defined food security not only in terms of access to and availability of food, but also in terms of resources distribution to produce food and the purchasing power on food where it is not produced (Shi et al., 1996; Ning, 2004). The Chinese government has concerned about its ability to continue feeding its growing population since the mid-1990s because of decrease in arable land area by the conversion of farmland to industrial and residential uses and the abandoned rural farms due to millions of country-dwellers migrating to cities in the most productive agricultural regions, as the serious threat to the nation’s continued capacity to produce adequate levels of staple cereal crops (Lichtenberg and Ding, 2006; Lam et al., 2013; Zhou, 2016; Feinuo, 2017). Also, China’s soil environment of the arable land led to record levels of pollution due to the sacrifice of environmental standards during decades of rapid industrialization, leading to a massive agricultural land loss threatening its food security. Therefore, Chinese government has to elaborate to strengthen soil pollution prevention and control to improve the quality of soil environment because soil pollution was one of prominent risks for securing safe food to feed people in China (Liu et al. 2013; Zhao et al., 2015).
Agricultural land refers to the share of land area that is arable under permanent crops that occupy the land for long periods and need not be replanted after each harvest and permanent pastures which is used for five or more years for forage including natural and arable crops. But an arable land or a cultivated land means land under temporary crops, temporary meadows for mowing or for pasture, land under market or kitchen gardens, and land temporarily fallow (FAO, 2013). Abandoned land is not considered as the arable land due to shifting cultivation as well as double-cropped areas are counted only once. In China, the total area of arable land has been decreased year by year due to the dramatic growth of China’s economy and market and the China's rapid urbanization. The land area of China in 2017, accounting for 7.2% of the world’s land area and the third largest in the world, is 9.6 million km2. Only about 30% of the land area consists of basins and plains that are suitable for cultivation because almost 70% of the territory is mountains, plateaus and hills. So agricultural land is comparatively scarce (Lu et al., 2005). According to development indicators issued by the World Bank in 2016, the agricultural land area of China was 5.28×10⁶ km2 in 2015, that was 56.2% of total land area of china (The World Bank, 2016). And approximately 14.1% of total land area of China or 22.5% of the agricultural land area, classified as arable land area, seemed large enough. However, the Chinese government said that the whole arable land area of 119 million ha was slightly smaller than the land area of 135 million ha that were a minimum threshold to ensure adequate food production for Chinese people (NBC, 2017; Trading Economics, 2018).
The national survey of soils covering about 65.6% (6.3×10⁶ km2) of the total land area throughout China from 2005 to 2013 showed that 16% of China’s soil was polluted beyond acceptable grade II limits of the Soil Environmental Quality Standard set by MEP in 1995, and 19.4% of China’s total arable land (26.3 million ha) was badly contaminated by heavy metals (Bulletin of National Soil Pollution Survey, 2014). But some researchers claimed that little was known about heave metal concentrations in arable soil and its spatial distribution on a national scale (Song and Pjanowski, 2014; Zhang et al., 2015; Zhang, 2016). Therefore, It can be assumed that the actual arable land area which produce the food crops without any health risks can be much less than that they needed for the China’s food security. Therefore, it becomes a great challenge for this country to guarantee a food supply for the growing demand for food of increasing population. Thus there is a pressing need for a critical evaluation of the nation's land resources. In this paper, we investigated the present status and problems of arable land that becomes the most concerned social and environmental problems in China and discuss prospects and strategies assess the implications of planning and land management on sustainable conservation of the arable land with respect to China’s growing food consumption.
Geography and Spatial Distribution of Land in China
China is a huge and physically diverse country. The geography of China of which the land is high in the west and descends to the east coast is varied and complicated, with mountains, basins, plateaus and hills, and flat and fertile plains. Three major characteristics of the composition and distribution of land resources in China are as follows: (1) variety in type-arable land, forests, grasslands, deserts and tideland; (2) many more mountains and plateaus than flatlands and basins; (3) unbalanced distribution: farmland mainly concentrated in the east, grasslands largely in the west and north, and forests mostly in the far northeast and southwest (CIA, 2015; Wikipedia, 2018).
Nearly 70 % of the country's land surface consists of mountains (33%), plateaus (26%) and hills (10%). Only 15 percent of the country on the central eastern coast and along the Yangtze and Yellow river valleys is good for agriculture (Wikipedia, 2018). For the physical characteristics of some typical regions in China, the north china plain with gently rolling topography is subject to flooding, and water temporarily stands in lakes that do not have drainage. The southeast coast and Shanghai share the entire Yangzi valley's distinctive characteristics of water and wetlands. The Yangzi is separated from other regions by mountains and extensive wetlands. Southwest uplands that is close to the tropical cyclones of the bay of Bengal and the South China Sea can be defined as rugged, highly eroded topography (Asia Society, 2018).
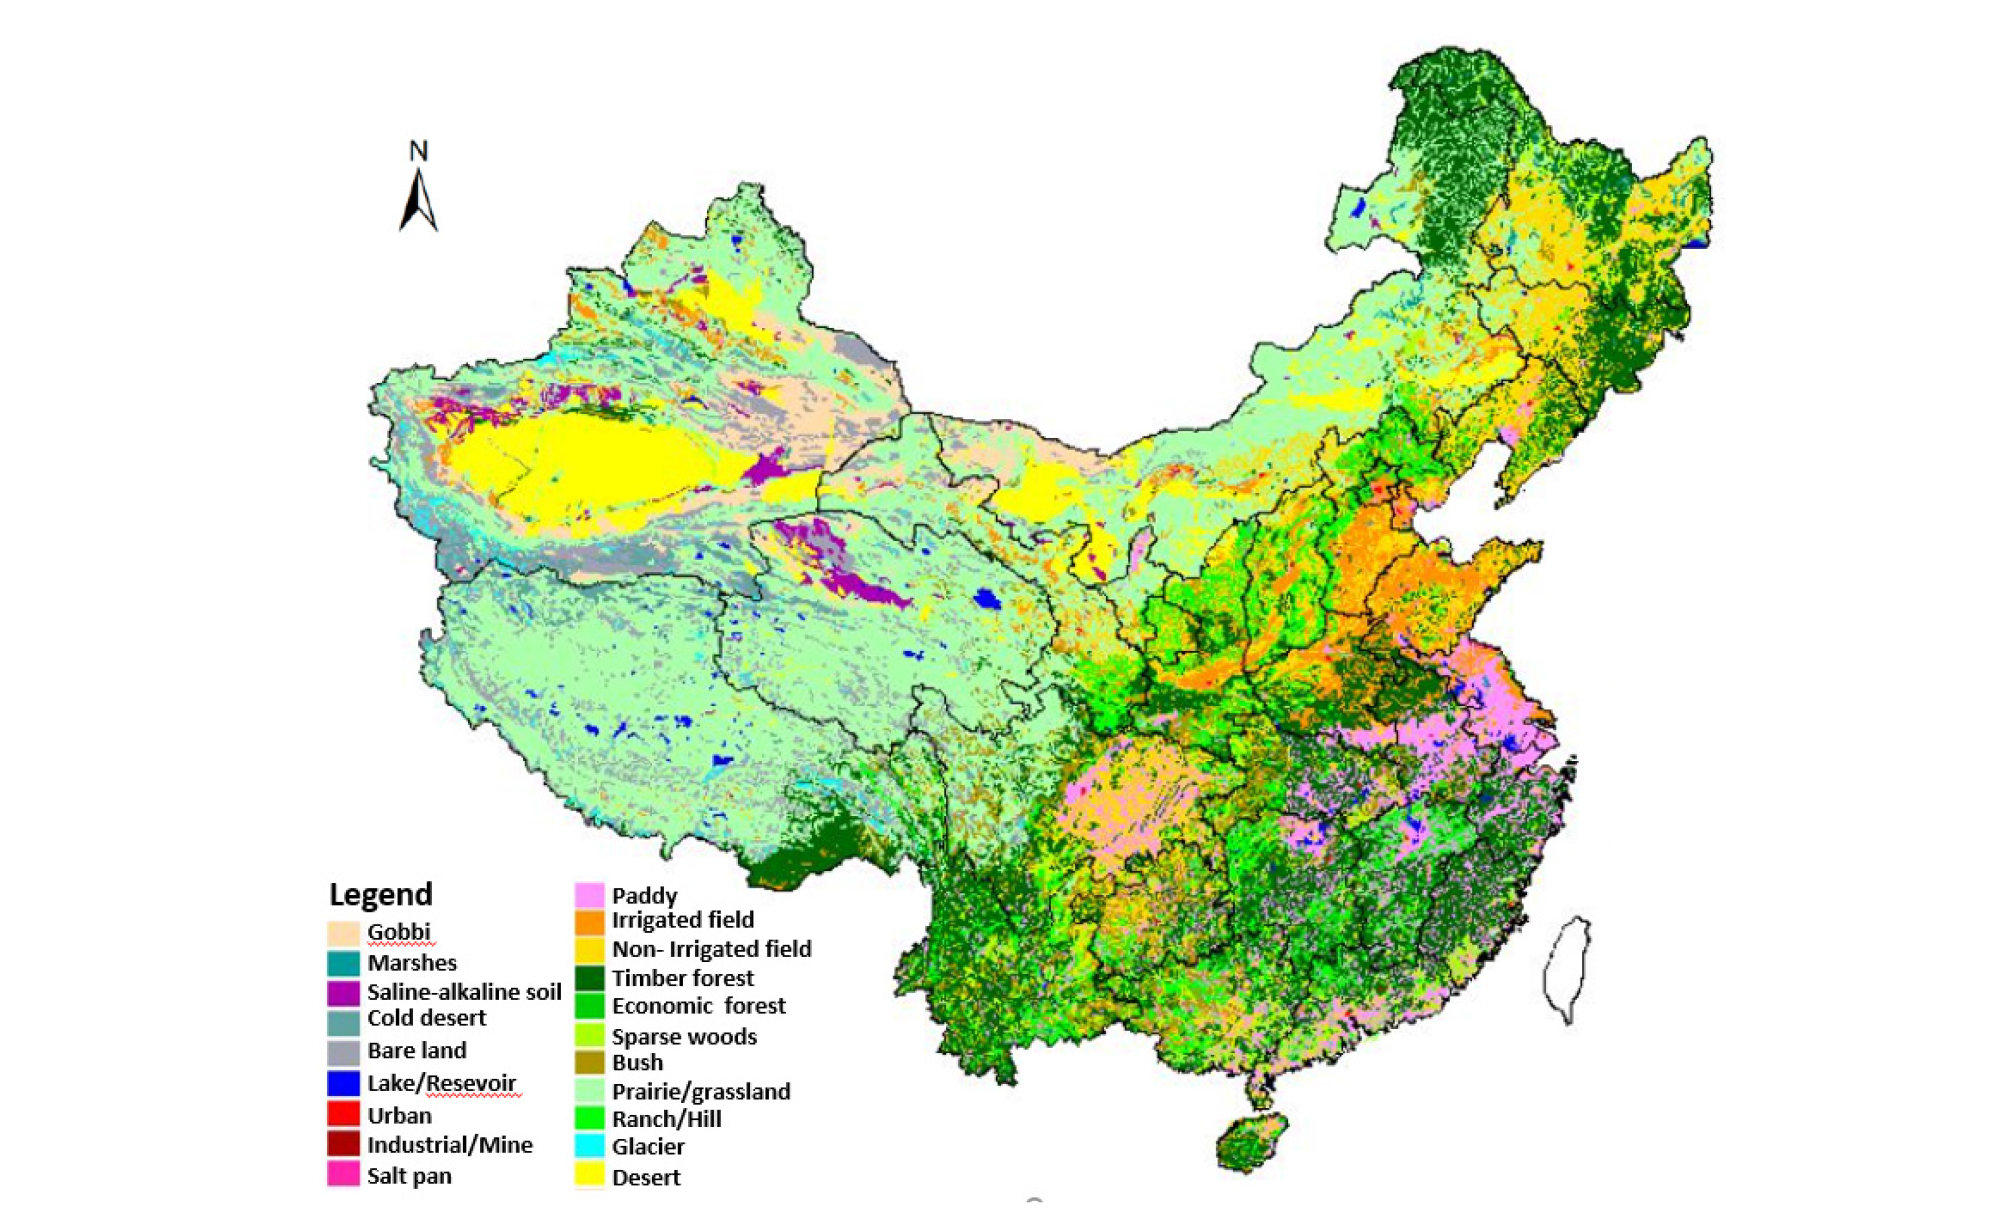
Fig. 1 shows the land use and the distribution of land in China (The Statistics Portal, 2015). The green area indicate more farmlands while the yellow and the orange indicate less farmlands. The majority of China’s arable land lies in the central eastern coast and around the Yangtze and Yellow river valleys which have the highest sediment deposit among the lands in China. The eastern plains and southern coasts of the country consist of fertile lowlands and foothills and are the location of most of China's agricultural output. The southern part of the Yangtze on the south of China consists of hilly and mountainous terrain. The west and the north of the country are dominated by sunken basins, rolling plateaus, and towering massifs containing part of the Tibetan plateau, and have much lower agricultural potential. The loess Plateau situated and used as arable land in north China is covered with highly erodible aeolian deposits.
As observed above, mose of arable land is mainly located in the Northeast Plain, the North China Plain, the middle-lower Yangtze Plain, the Pearl River Delta Plain, and the Sichuan Basin because the deep, dark brown, fertile topsoil of the plains in Northeast and North China are suitable for growing crops and many lakes and rivers in the middle-lower Yangtze Plain are particularly suitable for paddy rice. Especially in the warm and humid Sichuan Basin, crops can be grown in purplish soil throughout year in all four seasons.
Characteristics and Types of Land Use in China
The land use and land cover classification are be of great significance as the nation plans to overcome the problems of uncontrolled development, deteriorating environmental quality, loss of prime agricultural lands, and so on (James et al, 1975). Clawson and Stewart (1965) stated that accurate, meaningful, current data on land use are essential. If public agencies and private organizations are to know what is happening, and are to make sound plans for their own future action, then reliable information is critical in this dynamic situation. The sustained and rapid economic development in China promoted the rapid changes of land uses and land covers.
Geographically, China can be divided into four regions based on the physical features, that is, the North, South, Northwest, and the Qinghai-Tibetan areas. Official land use data in China are divided into three levels under several land use categories. The first level includes agricultural land, garden and forest land, construction land, water body, grass land, and unused (bare) land. And agricultural land was classified into four categories such as arable land, forest land including orchards, pasture, and others. The second and third levels contain ten categories of land uses and 52 subcategories, respectively (Qin et al., 2013).
Remote sensing data and conventional aerial photography are used to establish land use/land cover classification system. Low spatial resolution data has the short visit cycle and has big coverage area for big scale research of land use/land cover while high spatial resolution data is applied for the accuracy of discretion about land types (Anderson, 1971; Liu Jiyuan et al., 1998; Pengfeng et al., 2004). In the investigation of the dynamic regionalization of land use change in China during 1995-2000 as seen in Table 1 and Fig. 2. Liu et al. (2003) also divided the total land in China into 15 regions depending on main land use features and the characteristics of land use change to disclose the spatial pattern and processes of land use change.
Regional land use types and the characteristics of land use change in China. Northeast of China was characterized by the interlaced distribution of agriculture and woodland (Table 1). The regions of Northeast Da and Xiao Hinggan mountains and eastern part of Northeast were the typical regions of which the woodland and the grassland were converted into arable land, whereas some part of the arable land of Huang-Huai-Hai plain, Yangtze river delta, North China plain, and Sichuan basin were converted into built-up areas. Among reservoirs, ponds and bottomlands the bidirectional conversions between paddy fields and reservoirs or ponds occurred in Jiangsu Province. Northeast China plain, the bidirectional conversion zone of upland and paddy field, was characterized by the dry land to paddy field.
Table 1. Regional land use types and the characteristics of land use change in China.
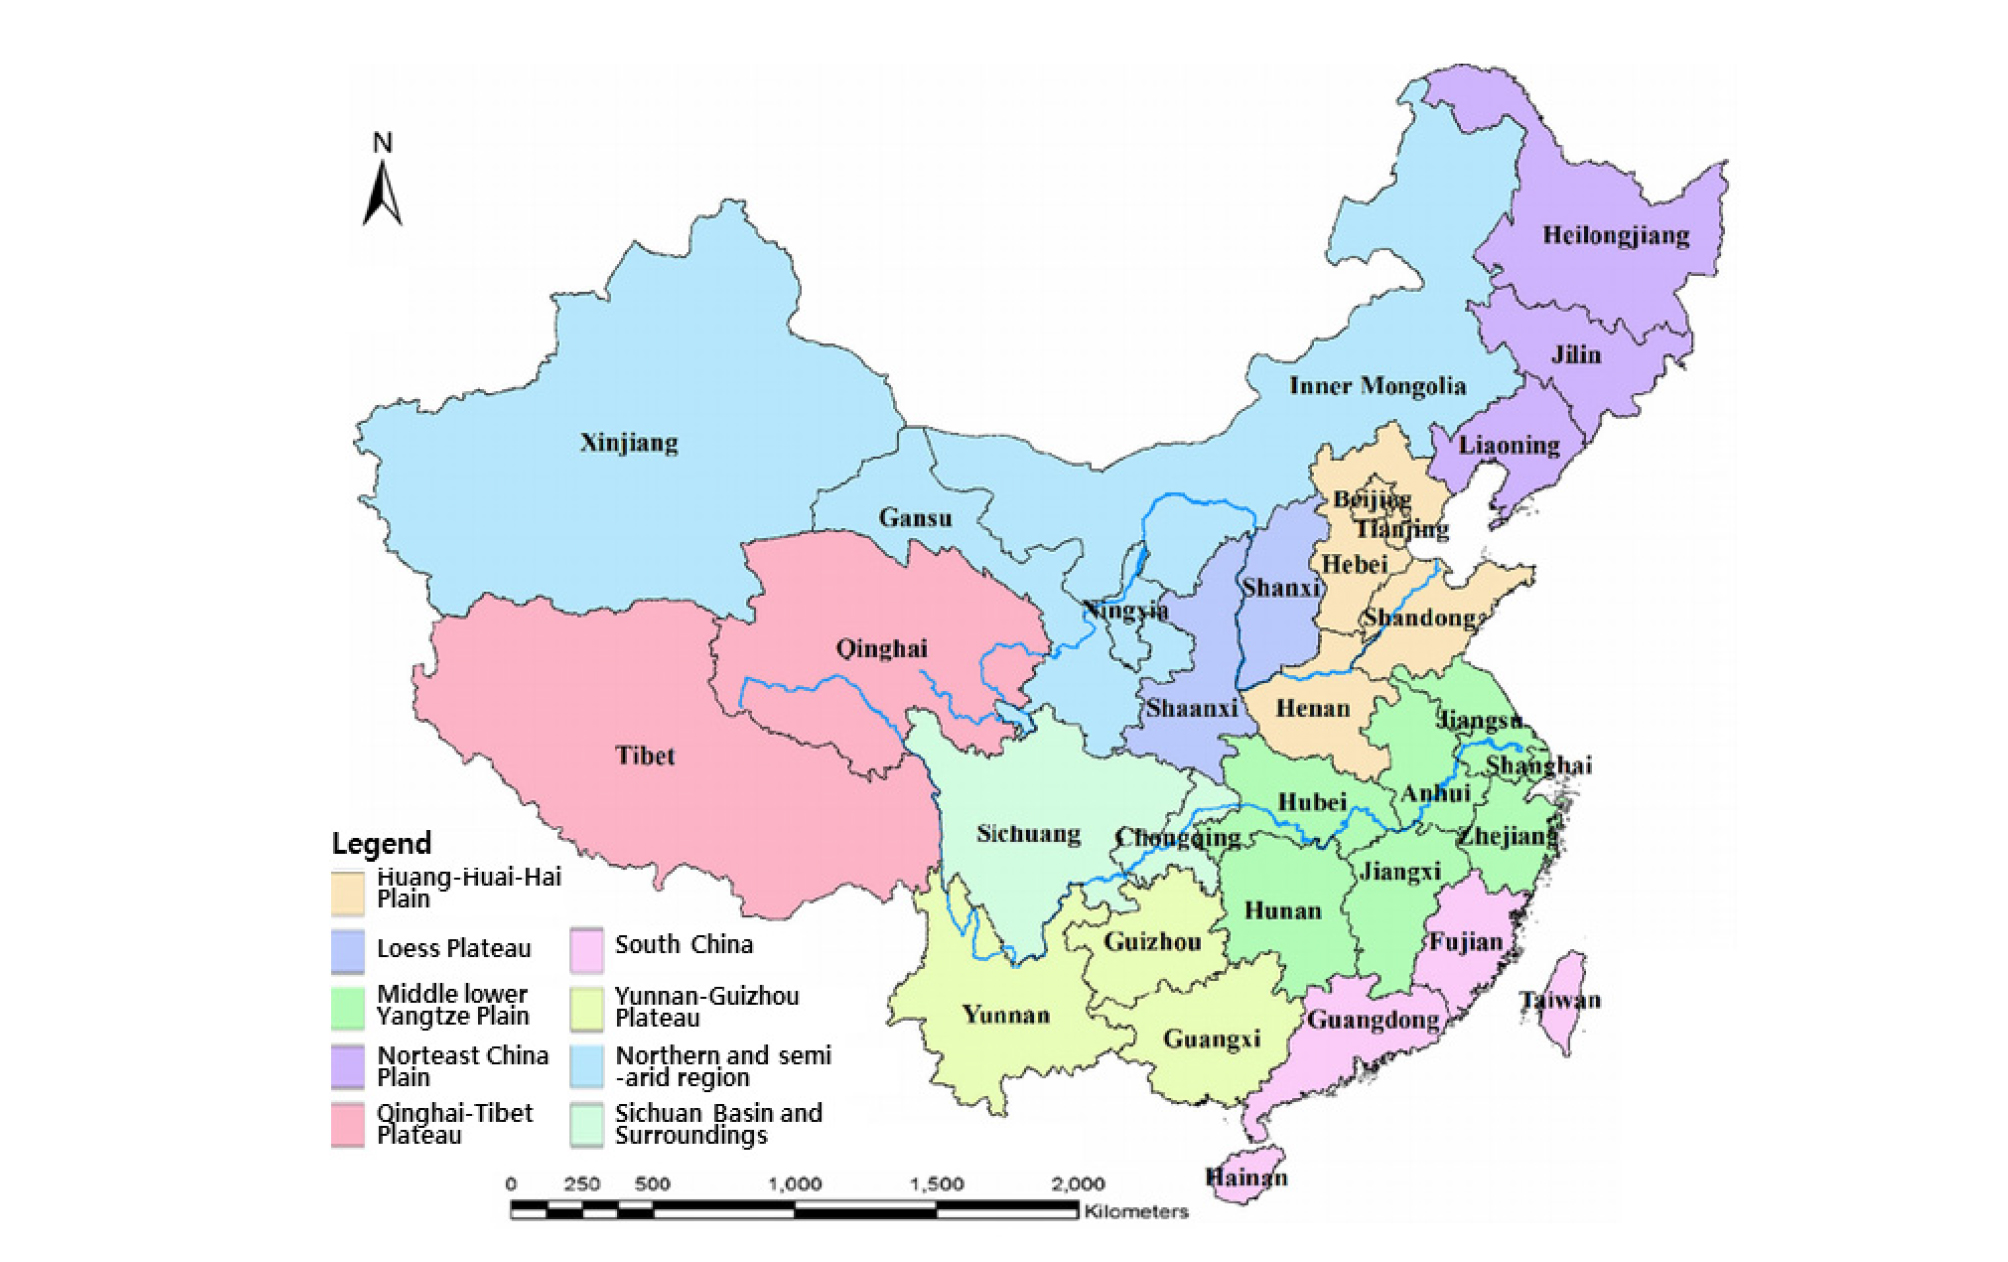
The interlaced zone of the reclaimed and abandoned arable land distributed in arid and subarid areas of Northwest China. Central China covered with dense lakes was the bidirectional conversion among paddy field, reservoirs, ponds, bottomland and lakes and the urban and residence expansion. In this region, agriculture, grasslands, desert, and unused land accounted for 61% of the total unused land in China. In the region of coastal southeast China, most of land use change was occurred in the woodland and the grassland along with the bidirectional conversions between grassland and man-made forests. In Southeast hilly area, there was land conversion from woodland to arable land. In southwest China, the conversions of woodland to grassland and woodland/grassland to arable land conversion were dominant throughout the deforestation and grassland reclamation, leading to the significant decrease of woodland and the increments of arable land and grassland. Southwest Qinghai and Tibet were characterized by a slow change in land use (Liu et al., 2003). However, Qin et al. (2013) divided the arable land into nine agricultural regions to investigate the differences in the urban expansion process and its effects on potential yield of farmland across China during 1990-2010 as shown in Table 2 and Fig. 2. The biggest region was the northern arid and semi-arid including the provinces such as Xinjiang, Inner Mongolia, Ningxia, and Gansu.
Table 2. Agricultural regions and provinces of China.
Changes of Arable Land Areas in China
The arable land is a fundamental resource critical to food security in China that has experienced drastic urban land expansion and the consequent loss due to an unprecedented period of economic growth and population growth (BBC, 2011). Based on a 2015 estimate by the Ministry of Land and Resources, the country lost 66,000 ha of arable land annually, a phenomenon that has brought available farmland close to the food security “red line” of 120 million ha set by the government in 2006 (Feinuo, 2017). The land conversion from agricultural uses to urban and industrial development influenced the dramatical changes of land policy in China since 2004 (Lin and Ho, 2005). A series of land-protection and supply policies such as the Prime Farmland Protection Regulation passed in 1994 and revised in 1998 was applied as one of the basic state policies (Huang, et al., 2015). The arable land balance policy was also implemented in 1997 to mitigate the pressure of arable land loss. This policy was that any area taken out of cultivation must be offset by putting at least an equal area into cultivation (Feng, et al., 2005).
Fig. 3 shows the changes of agricultural and arable land areas of China from 1960 to 2015. The total area of the agricultural land was increased by 64.9% from 3.42×10⁸ ha in 1960 to 5.28×10⁸ ha in 2015 while the changes of the total arable land area ranged from decrease of 6.6% (6.83×10⁶ ha) in 1980 to increase of 20.2% (2.08×10⁷ ha) in 1990. The ratios of arable land area vs. agricultural land area from 1960 to 2015 were continuously declined to less than 30%. The lowest ratio was recorded at 20.5% in 2014. However, the arable land area in China continually decreased by approximately 5.6 million ha during 1980-1997 while the arable land decrease was drastically declined because of the implementation of the arable land balance policy during 1997-2012 (MLRC, 1997; Song and Pijanowski, 2014; Xiao et al., 2015).
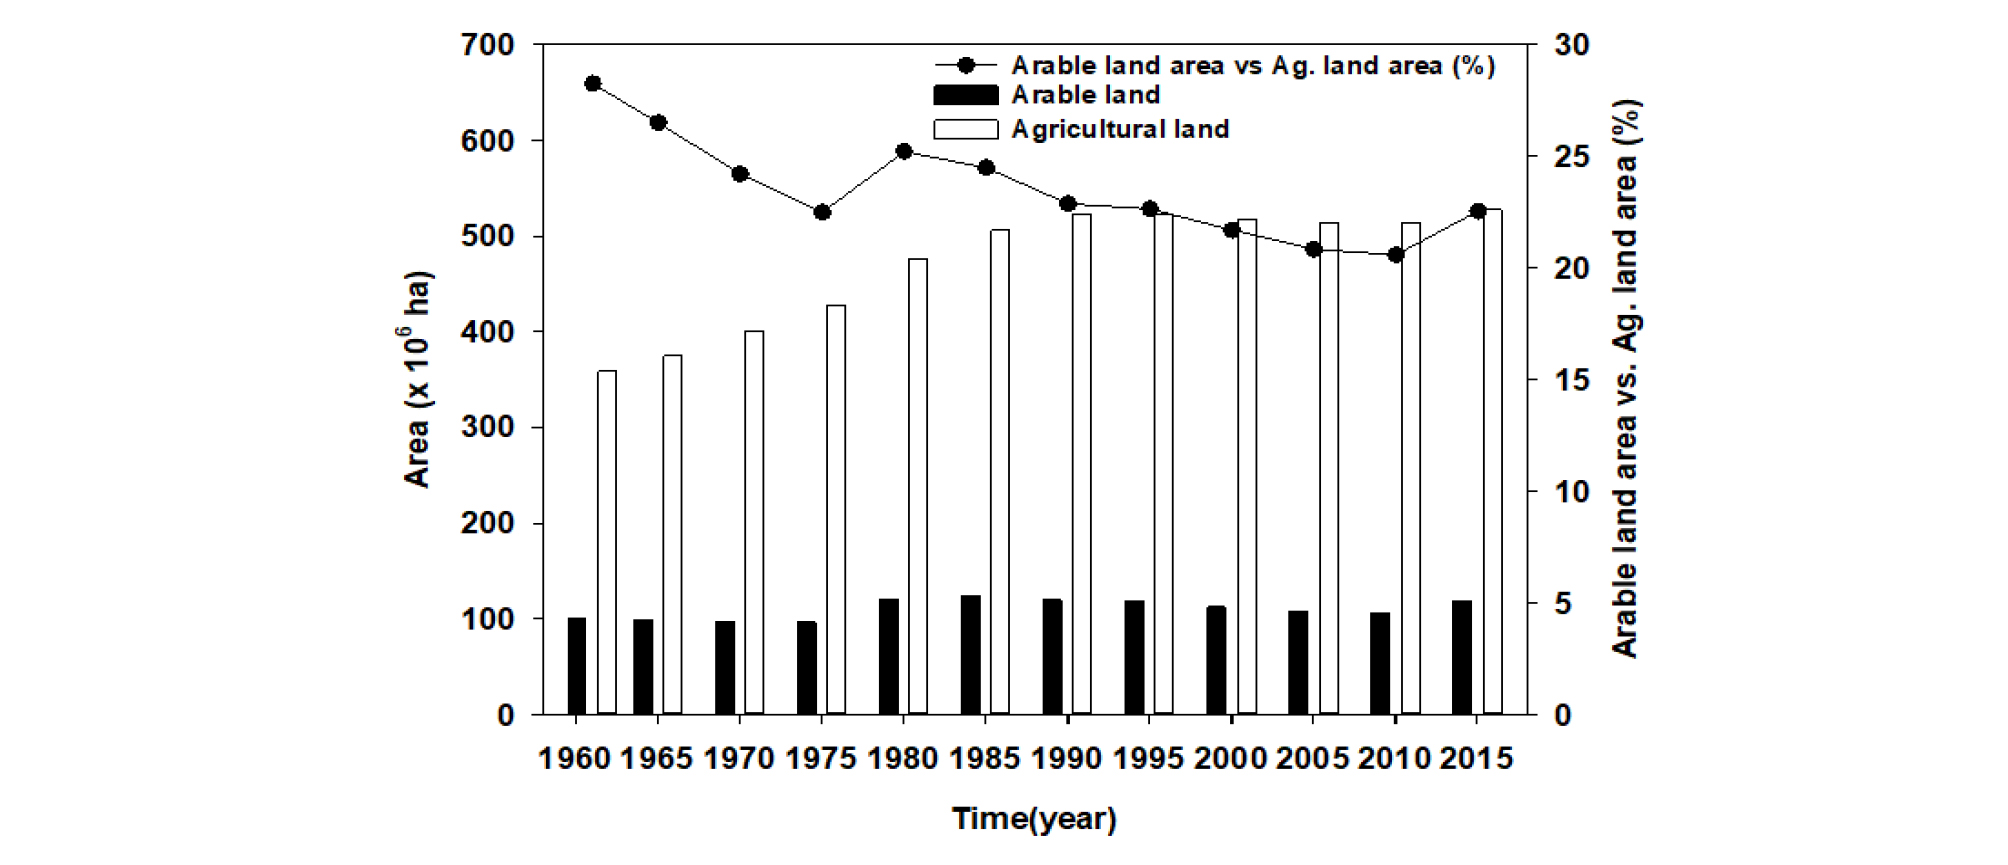
The net decrease of the total arable land area between 2009 and 2012 was merely 0.17% from 135.4 million ha to 135.2 million ha. These changes of the arable land areas between 1960 and 2015 were significantly influenced by explosive urban growth in the southeast coastal areas of China even though the implications of the arable land balance policy including the arable land requisition-compensation balance had promoted spatial changes of arable land in recent decades (Xiao et al., 2015).
Another national land use changes during the four years period from 2004 to 2008 showed that there were more construction land uses along with the decline of the areas of agricultural land and unused land (Table 2). Among agricultural land categories, pasture land and arable land were shrunken by 0.85 million ha and 0.75 million ha, respectively. Unused land was decreased by 1.19 million ha during the same period while there were increase of 2.32 million ha in the areas of forest land and construction land (He et al., 2012). But some arable lands were created from other uses such as forestry, grasslands, and wetlands while existing arable lands were still being converted to other uses such as built-up areas, forests, and grasslands. Therefore, many researchers are still deeply concerned that these conversion of arable land into other uses may threaten China’s food security despite the improved crop yields by fertilizer application and the use of hybrid varieties (MLRC, 1997, 2015).
China is now facing great challenges in food security because of the arable land contaminated with heavy metals and agrochemicals such as pesticides and herbicides, as well as the conversion of the arable land area in China. The national survey of soils covering about 65.6% (6.3×10⁶ km2) of the total land area throughout China from 2005 to 2013 showed that 16% of China’s soil was polluted beyond acceptable grade II limits of the Soil Environmental Quality Standard set by MEP in 1995, and 19.4% of China’s total arable land (26.3 million ha) was badly contaminated by heavy metals (CWR, 2014; Zhang et al., 2015; Chen et al., 2015; CCICED, 2016). But some researchers claimed that little was known about heave metal concentrations in arable soil and its spatial distribution on a national scale (Song and Pjanowski, 2014; Zhang, 2016). Based on these results from the national survey, we assume that the actual arable land area which can produce the food crops without any health risks can be much less than that they need for the China’s food security.
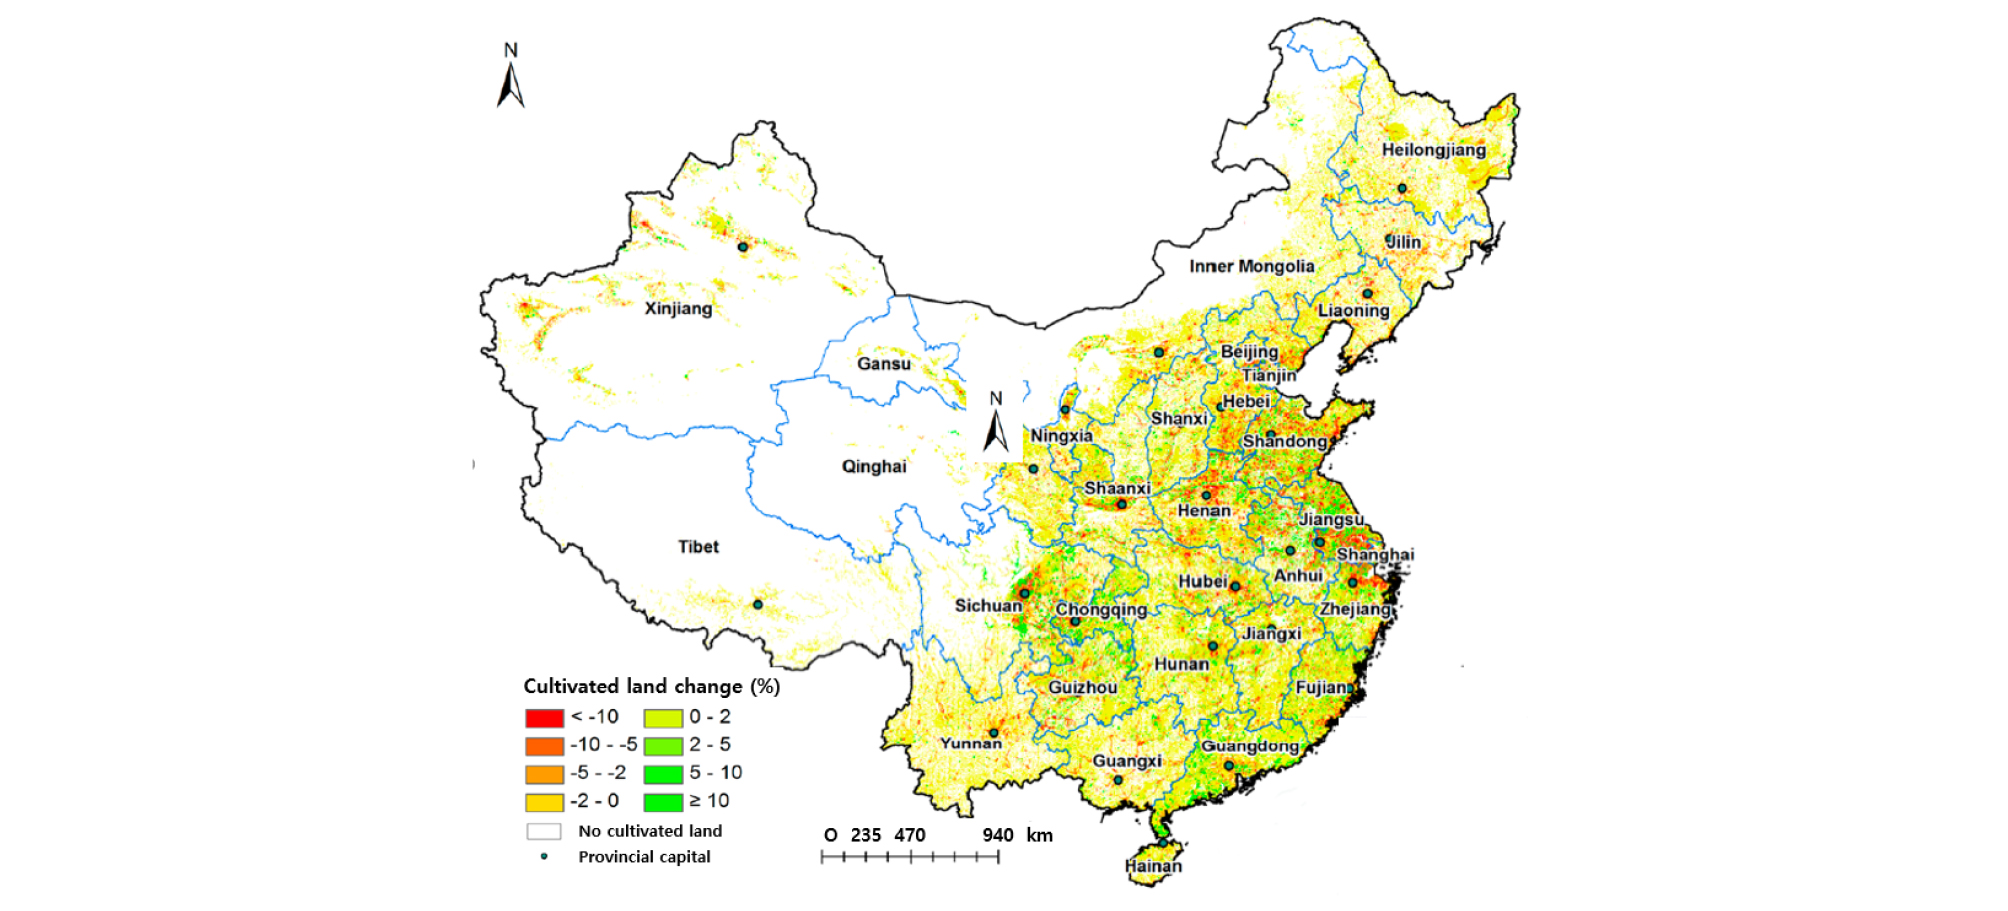
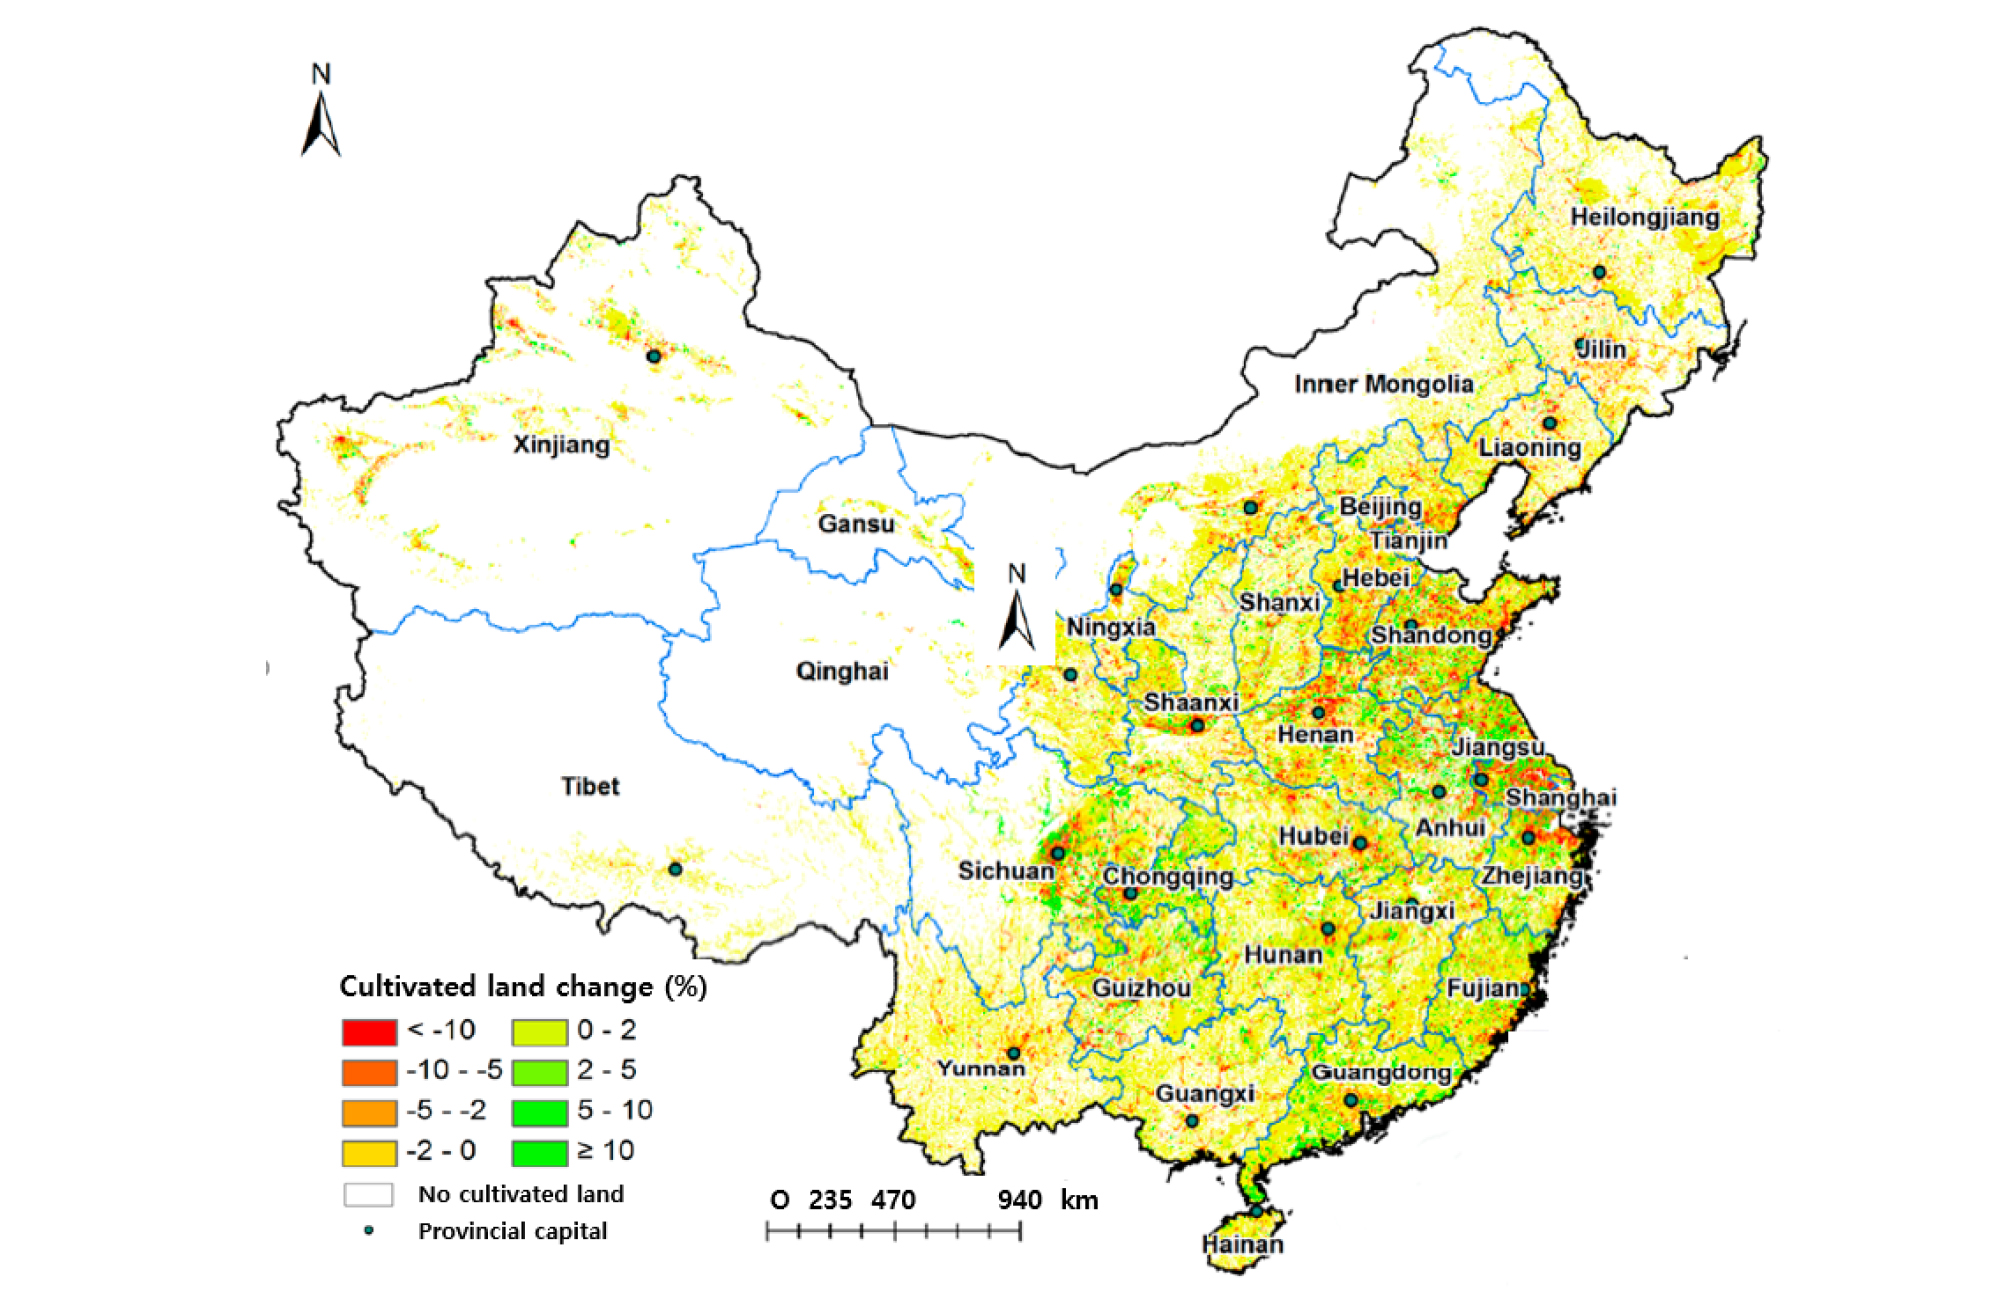
As observed above the most of arable land conversion was occurred by urban, industrial, and transportation purposes. As illustrated in Fig. 4, the arable land areas surrounding the cities were diminished while the arable land compensation occurred generally far away from cities. Particularly the losses of arable land were occurred in eastern and central China including Hebei, Jiangsu, Zhejiang, Guangdong, and Guangxi provinces where economic growth, urbanization, and industrialization had been rapidly accelerated during 2004- 2008 in China (Fig. 3). Also, there was rapid conversion of arable land to nonagricultural activities in Shanxi, Shaanxi, Chongqing, and Sichuan provinces that were located in China’s transitional geographic belt, because arable land was the easiest choice for construction and development. But some increases in arable land were observed from inland provinces such as Tibet, Qinghai, Xinjiang, Inner Mongolia, and Heilongjiang. Xiao et al. (2015) figured out the spatial change in arable land using the spatial analysis function of GIS to mine the spatial relationship between major cities and the change in arable land as seen in Fig. 4 (Xiao et al., 2015). A negative value represents a net decrease of arable land, and a positive value represents a net increase.
Table 3. Land use changes in China between 2004 and 2008 (Source: MLR, 2008).
Conclusion
Three major characteristics of China's land resources can be explained as variety in type-arable land and unbalanced distribution as of farmland concentrated in the east and the Northeast Plain, especially on the central eastern coast and along the Yangtze and Yellow river valleys. Agricultural land was officially classified into four categories such as arable land, forest land including orchards, pasture, and others, while the total land in China was divided into 15 regions depending on main land use features and the characteristics and features of land use change to disclose the spatial pattern and processes of land use change. The eastern part of Northeast were the typical conversion regions of which the woodland and the grassland were converted into arable land and some part of the arable land in Huang- Huai-Hai plain, Yangtze river delta, North China plain, and Sichuan basin was converted into built-up areas. Particularly, the losses of arable land of which compensation occurred generally far away from cities were occurred by urban, industrial, and transportation purposes surrounding the cities in eastern and central China. The arable land decrease was drastically declined because of the implementation of the arable land balance policy during 1997–2012. But 19.4% of China’s total arable land was badly contaminated by heavy metals exceeding the acceptable grade II limits of the Soil Environmental Quality Standard set by MEP in 1995 according to the national survey of soils in China from 2005 to 2013. Therefore, the available the arable land area to meet the minimum threshold for the China’s food security should be less than that estimated by Chinese government. Considering safety and quality of the arable land area in China, Chinese government needs to decide the proper strategy to secure the adequate level of the arable land area throughout a critical evaluation of the nation's present arable land status for securing safe food.
