

Introduction
Surface runoff from agricultural fields during rainfall events is a critical pathway of non-point source pollution in agricultural areas (Hur et al., 2005; Jung et al., 2015; Park and Kang, 2019; Roh et al., 2019). Among the pollutants delivered to water body, carbon (C), nitrogen (N), and phosphorus (P) act as energy and nutrient sources for aquatic organisms, possibly causing eutrophication and thus disturbing the aquatic ecosystems (Issaka and Ashraf, 2017). To reduce pollutant transport via surface runoff particularly from slopping upland fields, best management practices (BMPs) including surface cover with crop residue, vegetative filter strip, and contour ridge cultivation have been suggested (Morgan, 2005; Xiong et al., 2018). Among the BMPs, surface cover with crop residues is more effective in reducing runoff and easy for farmers to practice, and thus widely recommended compared to others (Park et al., 2018). It has been reported that surface cover can reduce soil erosion and losses of N and P by up to 85, 50, and 55%, respectively, in Korean upland fields compared to bare soils by decreasing hydrodynamic forces of rainfall and surface running water and thus increasing infiltration of water (Park et al., 2018).
However, surface cover with crop residue may increase the concentration of dissolved organic C (DOC) in the runoff water from the fields due to decomposition of the covered materials. Though Li et al. (2019) reported that corn stalk mulching increased DOC export from bare soils under simulated rainfall, there is no relevant study on the changes in DOC concentration of runoff water from cultivated fields under natural rainfall. The potentially increased DOC concentration should increase stoichiometric ratio of C to N (C/N) and C to P (C/P), which varies with land-use type and management (Yang et al., 2012; Islam et al., 2019). For example, Yang et al. (2012) reported that C/N and C/P in soluble fractions of soil CNP varied from 2 to 8 and from 5 to 100, respectively, under different land-use type and management including field crop soils, pasture, and forests in Florida, USA. Using such variations in C/N and C/P, it may be possible to investigate the impact of a certain land-use on the pollution of waterbodies surrounding the area with multiple land-use type particularly when C/N and C/P are combined with the conventional other indicators such as stable C and N isotope ratios (Andrews et al., 1998; Hellings et al., 1999). For example, in south Korea, Jeon (2015) suggested using C/N and C/P of waterbodies nearby croplands can be used as parameters for the quantitative estimation of the contribution of crop fields to water pollution as paddy, upland, and orchard had distinctive C/N and C/P. However, there is no study on how surface cover with crop residue changes C/N and C/P of runoff water from the fields though such information may be of help in understanding the effect of surface cover on water quality and in developing a methodology for estimation of the contribution of covered fields to water pollution. Considering that surface cover is one of BMPs that are encouraged by government (Park et al., 2018), it is necessary to understand the effects of surface cover on changes in runoff water chemistry.
This study was conducted to investigate the changes in the C/N and C/P of runoff water from upland fields by surface cover with rice straw in a field experiment with maize (Zea mays L.) cultivation. It was hypothesized that rice straw cover may not change C/N and C/P ratios of sediment-bound CNP but increase C/N and C/P ratios of runoff water due to increased DOC concentrations through decomposition of covered rice straw. In addition, it was also hypothesized that increased C/N and C/P ratios by surface cover would be apparent in the late period of long and continuous rainfall events as the reduction of runoff by surface cover diminishes with the progressive saturation of soil pores by long-lasting rainfall (Shahrban et al., 2018).
Materials and Methods
Study site and soil properties This study was conducted as a series of experiments to investigate the effects of BMPs including vegetated ridge, sandbag, and surface cover on the loss of soils and CNP from slopping maize fields from 2018 to 2019. Some relevant data are available in Park et al. (2020). The experiment was conducted at the experimental upland fields (126°53'52"E, 35°10'24"N) of Chonnam National University, Gwangju, Korea in 2018. The climate of the study area is temperate, and annual mean temperature and precipitation during the past 30 years were 13.8°C and 1,391 mm, respectively (KMA, 2018). The soil was classified as Inceptisol (coarse loamy, mixed, mesic family of Fluvaquetic Endoaquepts) in the USDA Soil Taxanomy (RDA, 2000). Soil texture was silt loam and the soil had total C, N, and P concentrations of 4.9, 0.50, and 0.17 g kg-1, respectively.
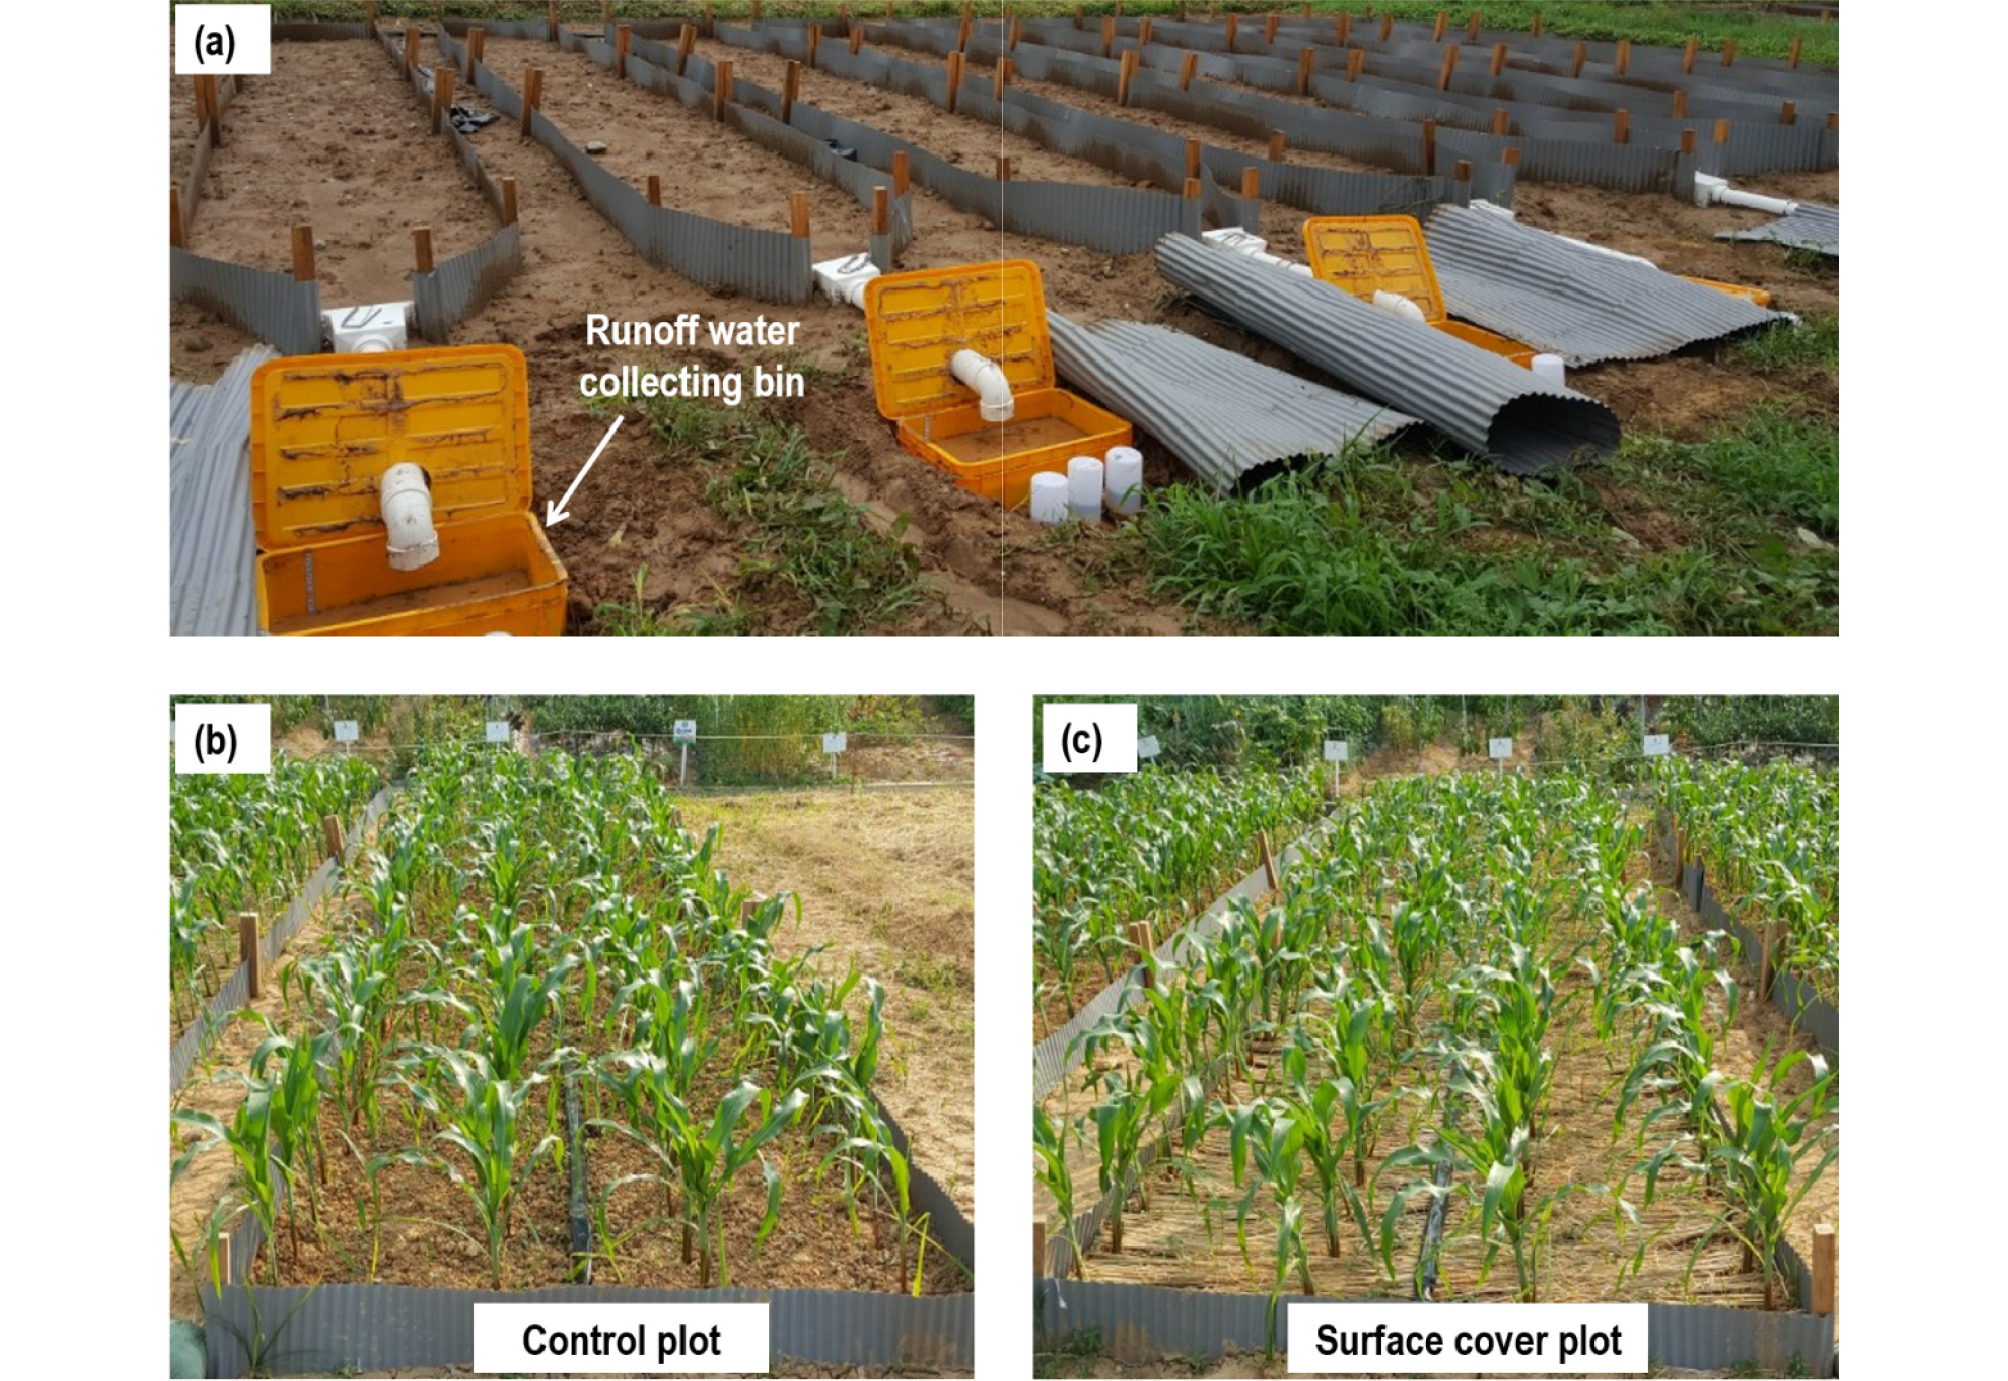
Experimental setting and maize cultivation On June 15, 2018, six plots (single plot size: 2 m × 10 m) were established on upland fields with a slope of 3.0% for two cover treatments (control and surface cover) with triplicates in a completely randomized block design (Fig. 1). Each plot was confined by inserting flexible plastic barriers (35 cm in height) into the plow pan layer of the soil (20 cm deep) around the plot. A flume and a collecting bin (55 cm width × 40 cm length × 30 cm height, 66 L) were installed at the downslope end of each plot to collect runoff water. For all the plots, livestock manure compost (28.4% C, 2.8% N, and 2.7% P) was applied at 1.5 kg (dry basis) m-2. Fertilizers were applied before maize seedlings transplanting at 31.6 g N m-2 as urea, 15.0 g P2O5 m-2 as fused phosphate, 10.0 g K2O m-2 as KCl, and urea was supplemented one month after the initial fertilization at the same rate as the initial fertilization following the standard fertilization management of South Korea (RDA, 2017). In covered plots, rice straw was covered at 370 g m-2 (approximately 70% of the surface area) over the whole plots and was fastened with U-shaped steel pins to fix the straws. The concentration of mobile organic C of rice straw determined using a total organic C (TOC) analyzer (Sievers 5310 C, GE Analytical Instruments, Boulder, CO, USA) after extracting organic C with distilled water at a 1-to-20 ratio of rice straw-to-distilled water was 6.1±0.4 mg C kg-1.
On June 20, twenty-days old seedlings of maize (var. ceratina) were transplanted into the plots in four rows (distance 60 cm) along the slope of the plot with a spacing of 25 cm between seedlings. During maize growth, weeds were removed by hands, and the plots were irrigated every two or three days when rainfall was rare.
Runoff water sampling and analyses During the maize cultivation period from June 20 to September 16, there were six effective rainfall events (on June 27, June 28, June 29‒30, August 23‒24, August 25‒27, and August 29‒September 4; referred to as event 1‒6) which created surface runoff. The rainfall amount and intensity were 66.4 mm and 3.2 mm hr-1, 77.6 mm and 6.0 mm hr-1, 67.6 mm and 2.6 mm hr-1, 76.4 mm and 5.6 mm hr-1, 258.6 mm and 7.7 mm hr-1, and 110.4 mm and 2.9 mm hr-1 for event 1‒6, respectively. After the cease of each rainfall event, runoff water samples that were collected in each bin was mixed well with a water scoop and sampled in a 1-L container to represent the homogenous water sample during the event. Details of the runoff collecting and sampling are described in Park et al. (2020).
The runoff water samples were analyzed for the concentrations of C, N, and P in the dissolved forms following the standard methods for water analysis of Korean government (MOE, 2017). Sediments were separated by centrifuging the whole water samples (450 mL) at 3,500 rpm for 10 minutes after adding 1 mL of 35% (w/v) CaCl2 to facilitate sedimentation by aiding soil aggregation. The supernatant was transferred to a container, and a portion of the supernatant was passed through a 0.45 µm membrane filter. The concentrations of CNP dissolved in the supernatant were measured using the TOC analyzer, Kjeldahl digestion-distillation method, and ascorbic acid reduction method after digestion with K2S2O8, respectively, following the standard methods.
The remaining sediments were oven-dried at 105°C to a constant weight. The dried samples were finely ground using a motor and analyzed for C and N using a combustion method (Nelson and Sommers, 1996) with an elemental analyzer (Flash EA 1112, Thermo fisher Scientific Inc., USA) and for P using the ascorbic acid colorimetric method after digestion with perchloric acid and NH4F extraction of soils (Kuo, 1996).
Statistical analysis For statistical analysis, data were tested for homogeneity of variance and normality of distribution using Levene’s test and Shapiro-Wilk’s test, respectively. Data were homogenous and normally distributed. The effects of surface cover on the CNP concentrations as well as C/N and C/P were assessed with analysis of variance (ANOVA) using the IBM SPSS Statistics 23 (IBM Corp., Armonk, New York, USA) at α = 0.05. The effects of surface cover on the arithmetic mean values across the runoff events as well as for the individual event were assessed by t test.
Results and Discussion
Concentrations of C, N, and P Though the mean concentrations of sediment-bound CNP across all rainfall events were not affected by surface cover (Table 1), surface cover reduced sediment-bound CNP in the early runoff events (events 1 and 3) (Fig. 2a). For example, the concentrations of sediment-bound CNP in runoff water from the control plot in the event 3 were 406.6 mg C L-1, 49.9 mg N L-1, and 35.8 mg P L-1, respectively, and surface cover decreased (p < 0.001) the concentrations to 55.9 mg C L-1, 7.3 mg N L-1, and 4.8 mg P L-1, respectively. Such decreases in sediment-bound CNP should be ascribed to the reduced loss of soil particles by surface cover, which protects soil surface from the rainfall impact and slows down runoff flow (Mannering and Meyer, 1963; Gilley et al., 1986).
Table 1.
Arithmetic mean concentrations of sediment-bound and dissolved C, N, and P in runoff water from maize fields as affected by surface cover with rice straw.
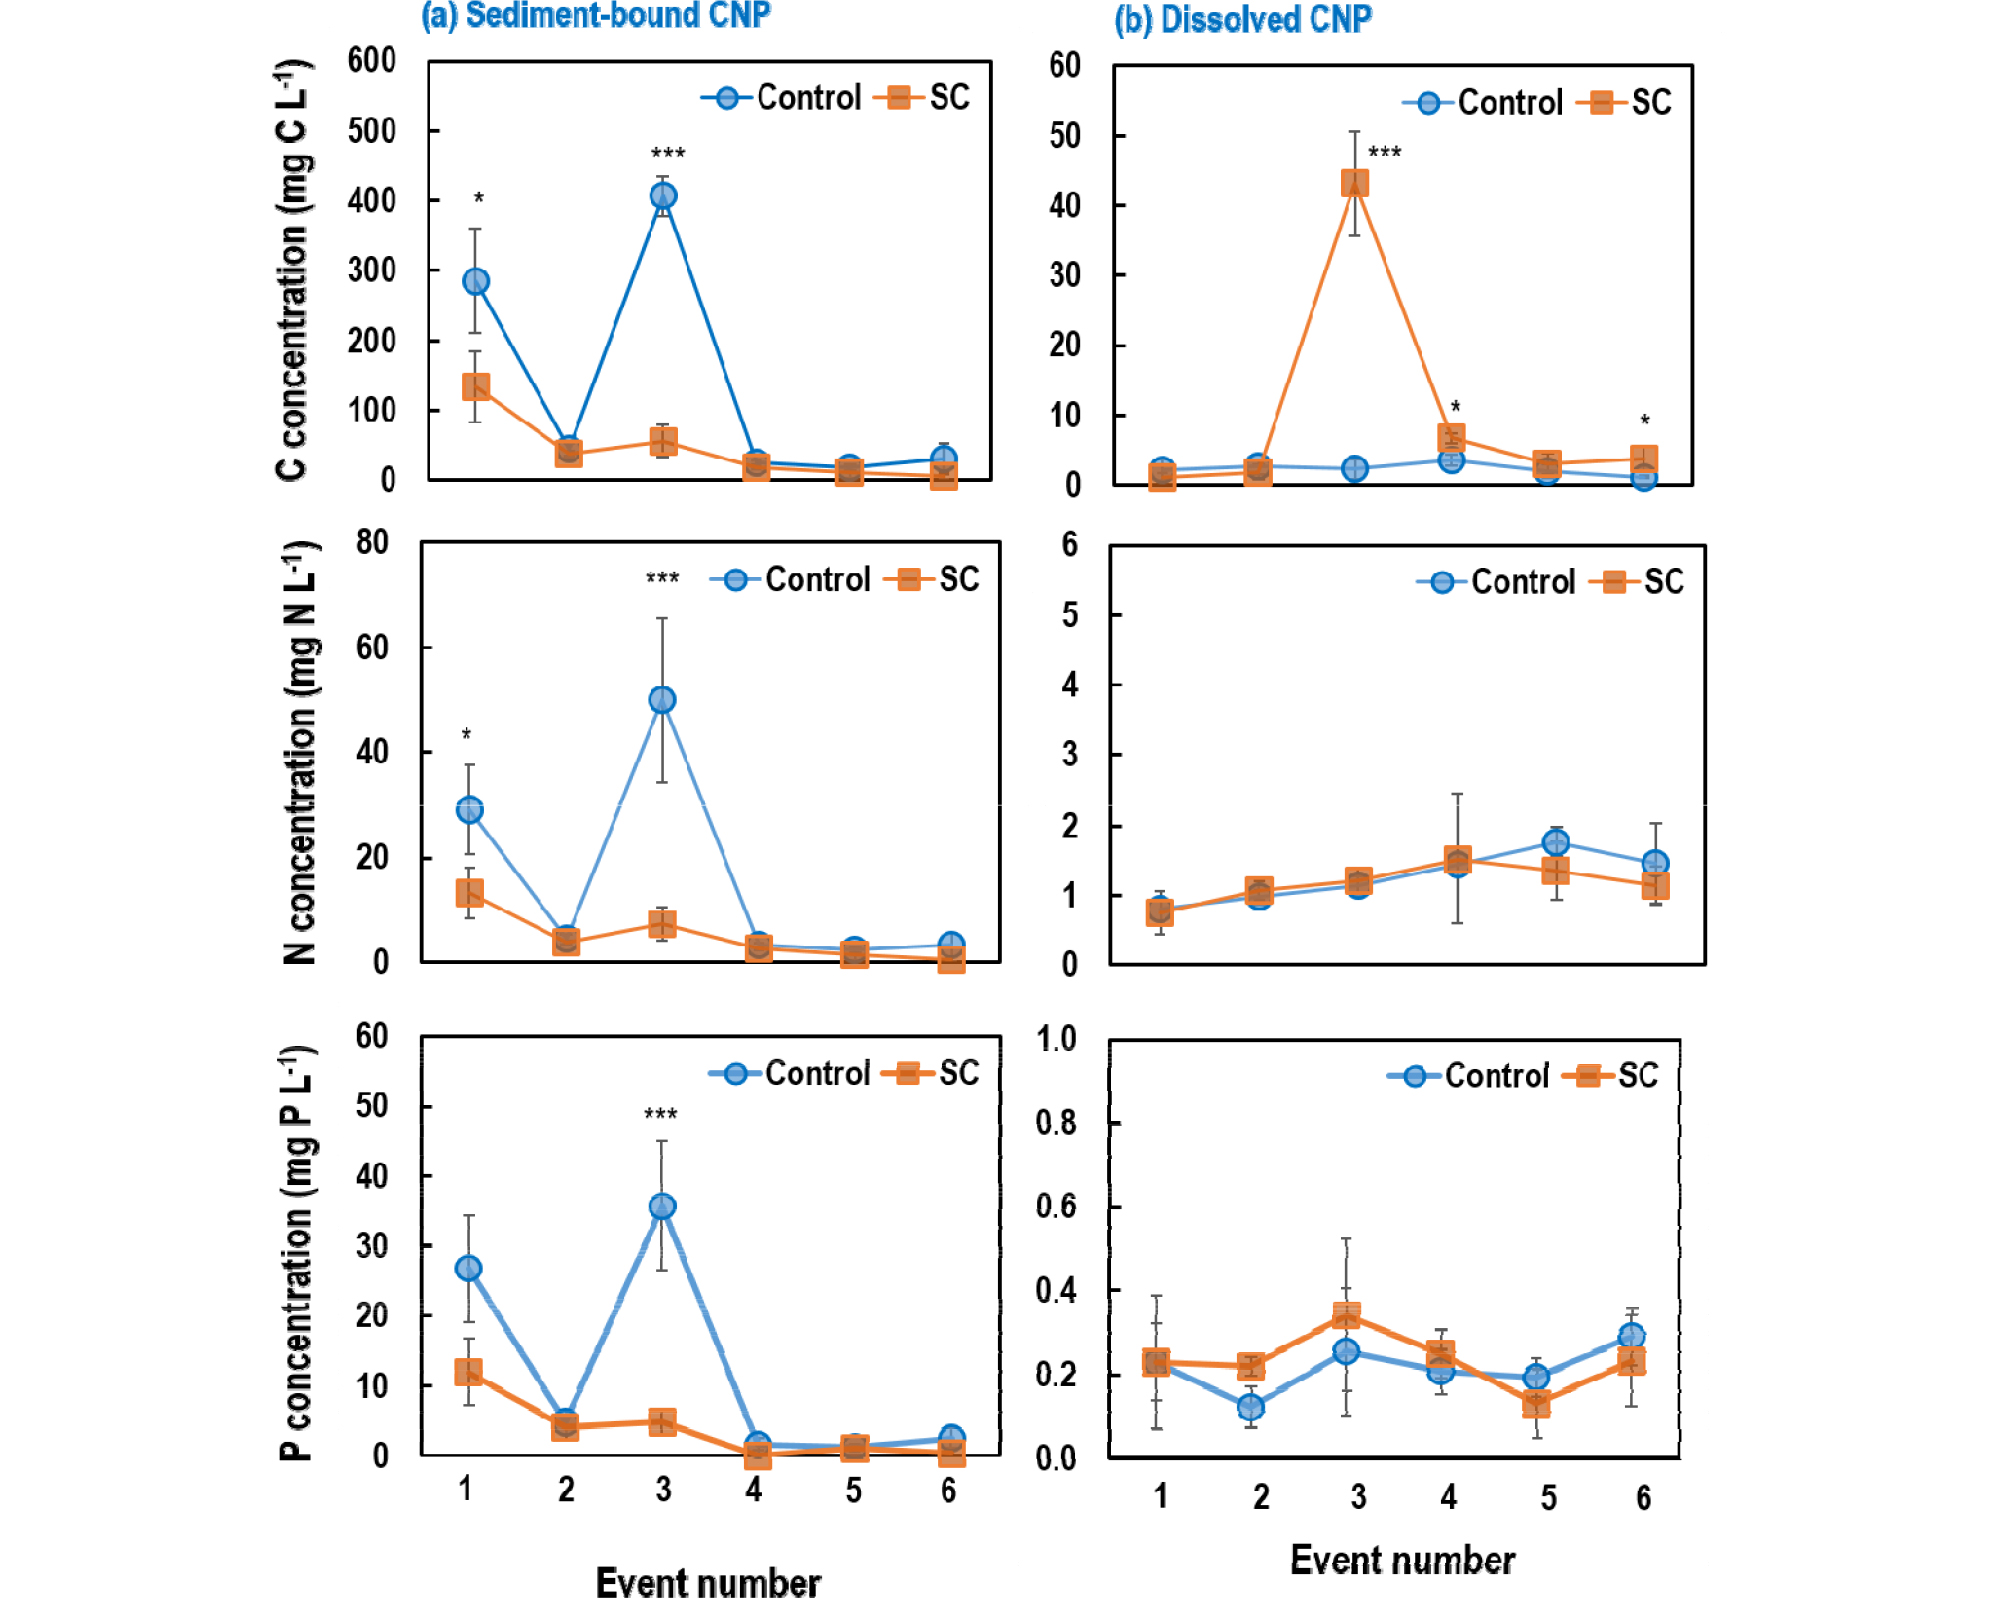
Fig. 2.
Changes in the concentrations of sediment-bound (a) and dissolved (b) CNP in runoff water from maize upland fields with or without rice straw surface cover (SC). Values are the means of triplicates with standard errors indicated by the vertical bars. The significance of the effect of surface cover was depicted with * and *** to show the effect was significant at α=0.05 and 0.001, respectively.
Surface cover did not decrease the mean concentration of dissolved N and P, but increased (p < 0.001) DOC concentration (Table 1), and such increases were more evident for events 3, 4, and 6 (Fig. 2b); the most significant increase was observed in the event 3, which occurred immediately after events 1 and 2, and DOC concentrations increased from 2.3 mg C L-1 in control plot to 43.2 mg C L-1 in the covered plot. These results together with the decreased sediment-bound C concentration in the early runoff events suggest that surface cover with crop residue may reduce sediment-bound C loss through preventing soil particle loss, but may increase DOC loss originated from the covered straw (Li et al., 2019). It is very well understood that crop residue on the soil surface decomposes slowly compared to that incorporated in the soils (Brady and Weil, 2002), and thus DOC from partially decomposed crop residue is subject to transportation with runoff flow (Li et al., 2019).
C/N and C/P and their implication The C/N and C/P of sediment-bound CNP varied within narrow ranges from 7.3 to 10.1 and from 8.8 to 15.1, respectively, across the cover treatments through the six runoff events (Fig. 3a). The mean C/N and C/P across the six events were not affected by straw cover (Table 2) though decreased C/P by surface cover was found in the events 5 and 6 (Fig. 3a). The mean C/N (8.9 for control and 9.1 for covered plot) in sediment of runoff water was similar to the ratio of the initial soils (9.8), but the C/P (ca. 12.0 for both treatments) in sediment was lower than that of the initial soil (28.8), and this should be ascribed to immobilization of applied P fertilizer by soil particles (Kim et al., 2009). The narrow ranges of C/N and C/P suggest that C/N and C/P of sediment-bound forms may not be used as an indicator of water pollution sources.
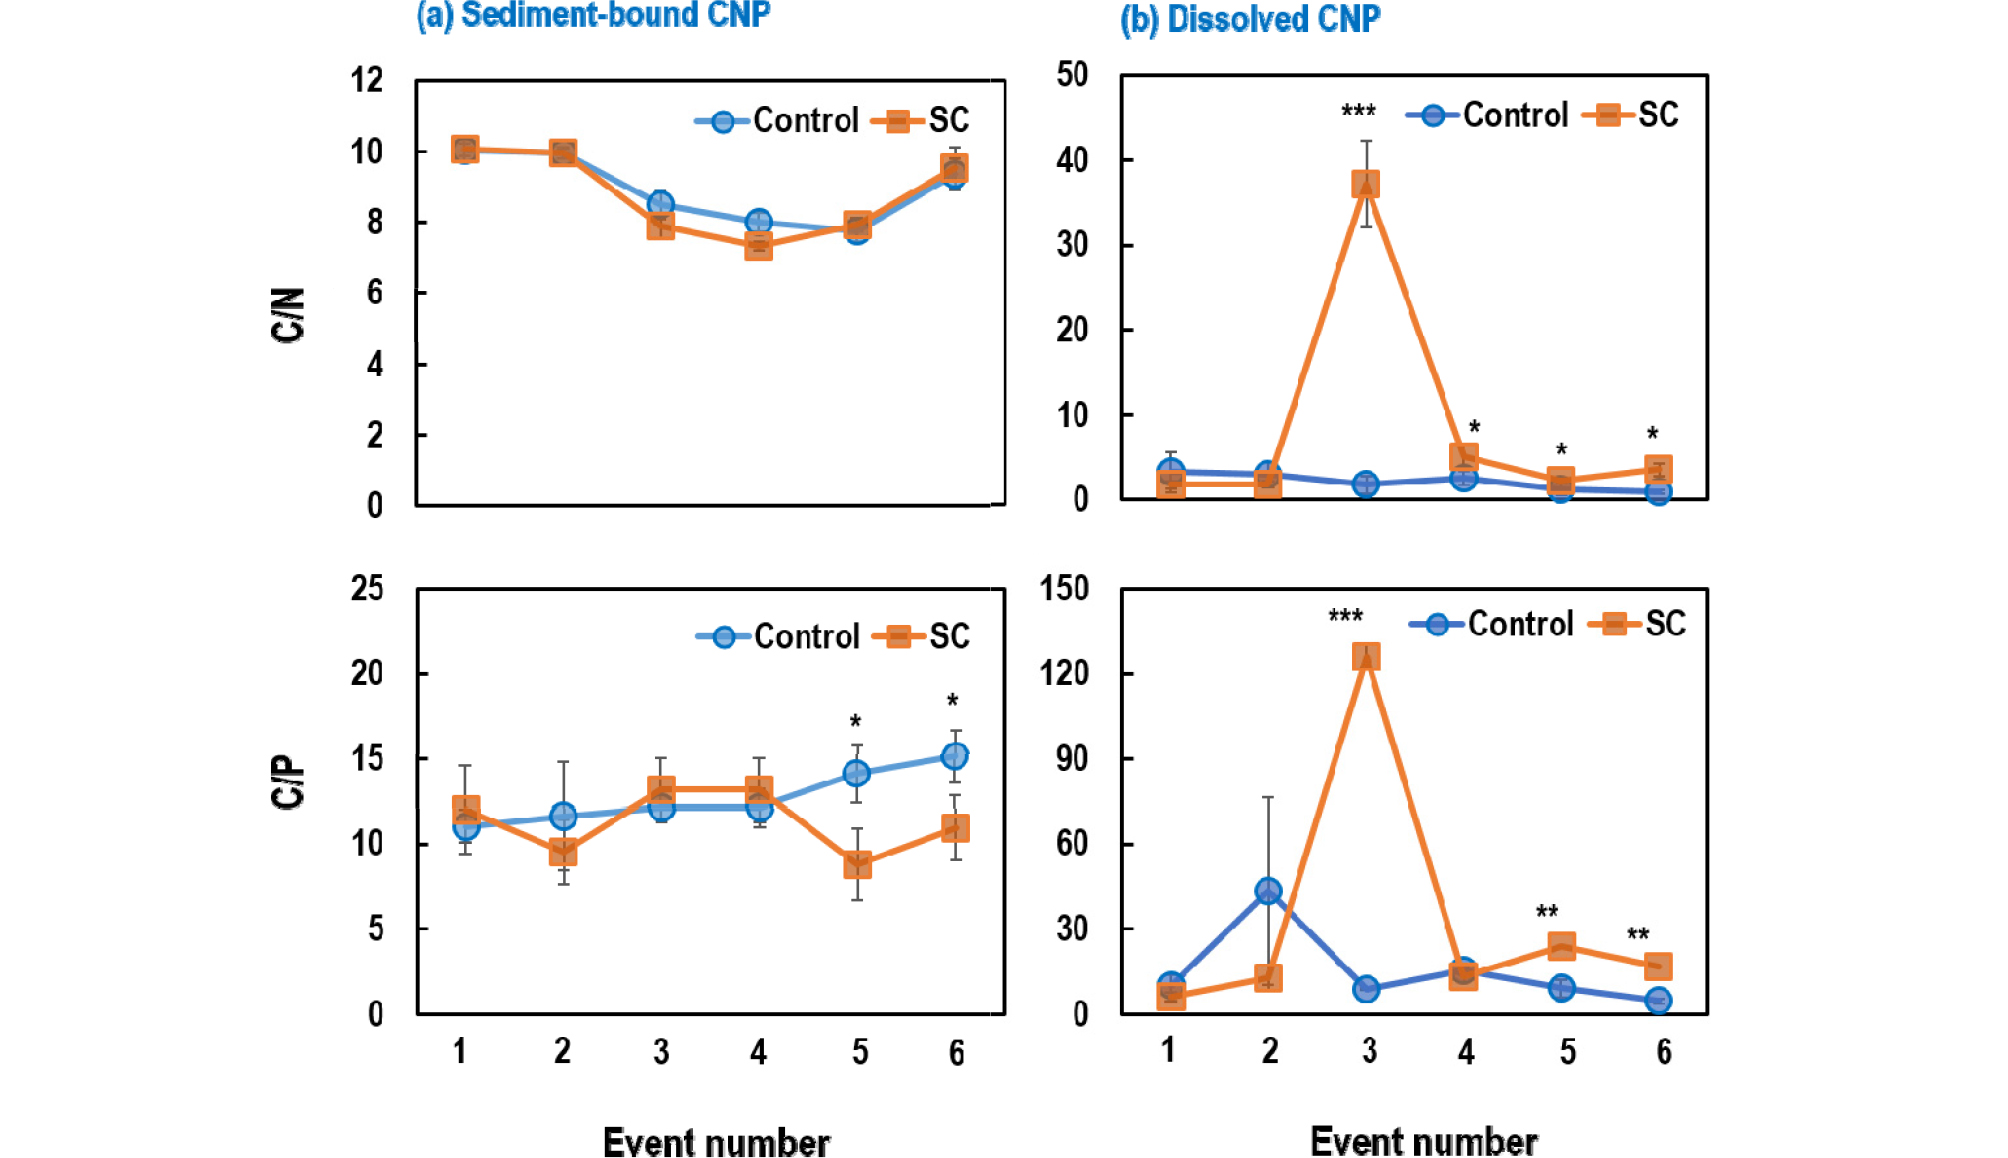
Fig. 3.
Changes in the C/N and C/P of sediment-bound (a) and dissolved (b) CNP in runoff water from maize upland fields with or without rice straw surface cover (SC). Values are the means of triplicates with standard errors indicated by the vertical bars. The significance of the effect of surface cover was depicted with *, **, and *** to show the effect was significant at α=0.05, 0.01, and 0.001, respectively.
Table 2.
Arithmetic mean C/N and C/P of sediment-bound and dissolved CNP in runoff water from maize fields as affected by surface cover with rice straw.
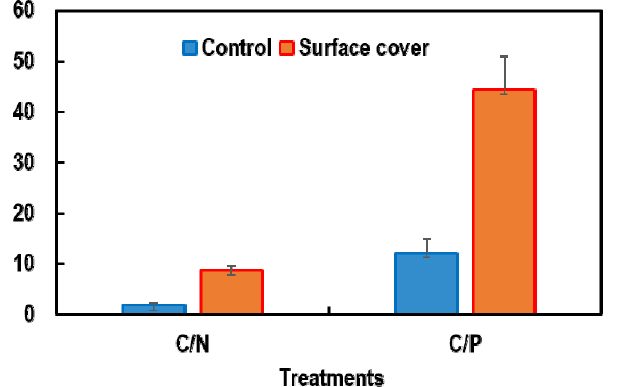
However, the mean values of dissolved C/N and C/P of runoff water from covered plots was greater than those from control plots by 4.8 and 3.7 fold, respectively (Table 2). Therefore, these results demonstrate that surface cover with crop residue may increase dissolved C/N and C/P of runoff water as it was hypothesized. In southwestern China, Gao et al. (2014) also suggested that the stoichiometric ratios of CNP exported from fields during heavy rainfall were closely related with the soil CNP ratio. In southern Manitoba of Canada, Rattan and Chambers (2018) also reported that the stoichiometric ratios of NP in waterbodies varied with coverage of soil surface with crop. In the present study, the coincidence of the peak DOC concentration (Fig. 2b) and the greatest C/N and C/P (Fig. 3b) suggests that using the C/N and C/P as indicators of the influence of crop residue cover on water quality may be more feasible when the DOC concentration of waterbodies increases dramatically.
In the present study, as hypothesized, the peak DOC concentration (Fig. 2b) and the highest C/N and C/P of dissolved CNP (Fig. 3b) in runoff water from covered plots were observed in the event 3, which was the last event of the four-days rainfall from June 27 to 30. During the period from June 27 to 30, the concentration of DOC and the C/N and C/P of runoff water from covered plots sharply increased at event 3 (Fig. 4), suggesting that the impact of surface cover on DOC export and subsequent increases in C/N and C/P would be greater in the late period of rainfall events. In the early period of rainfall, surface cover might reduce runoff water, and thus increases in DOC concentration as well as C/N and C/P may not be detected as soils under surface cover could receive infiltration water in the water-empty pores (Scopel et al., 2005). However, in the late period of rainfall, due to loss of the capacity rice straw to reduce runoff water with the progressive saturation of soil pores, runoff water enriched with DOC and thus with a high C/N and C/P could be outflowed from the plots. Therefore, it was suggested that the C/N and C/P ratios of water samples in waterbodies nearby upland fields covered with crop residue can be used as an indicator of the impact of surface cover on the water quality particularly when surface cover loses its capacity to reduce runoff water under long-lasting rainfall, and thus increases DOC export from the plots.
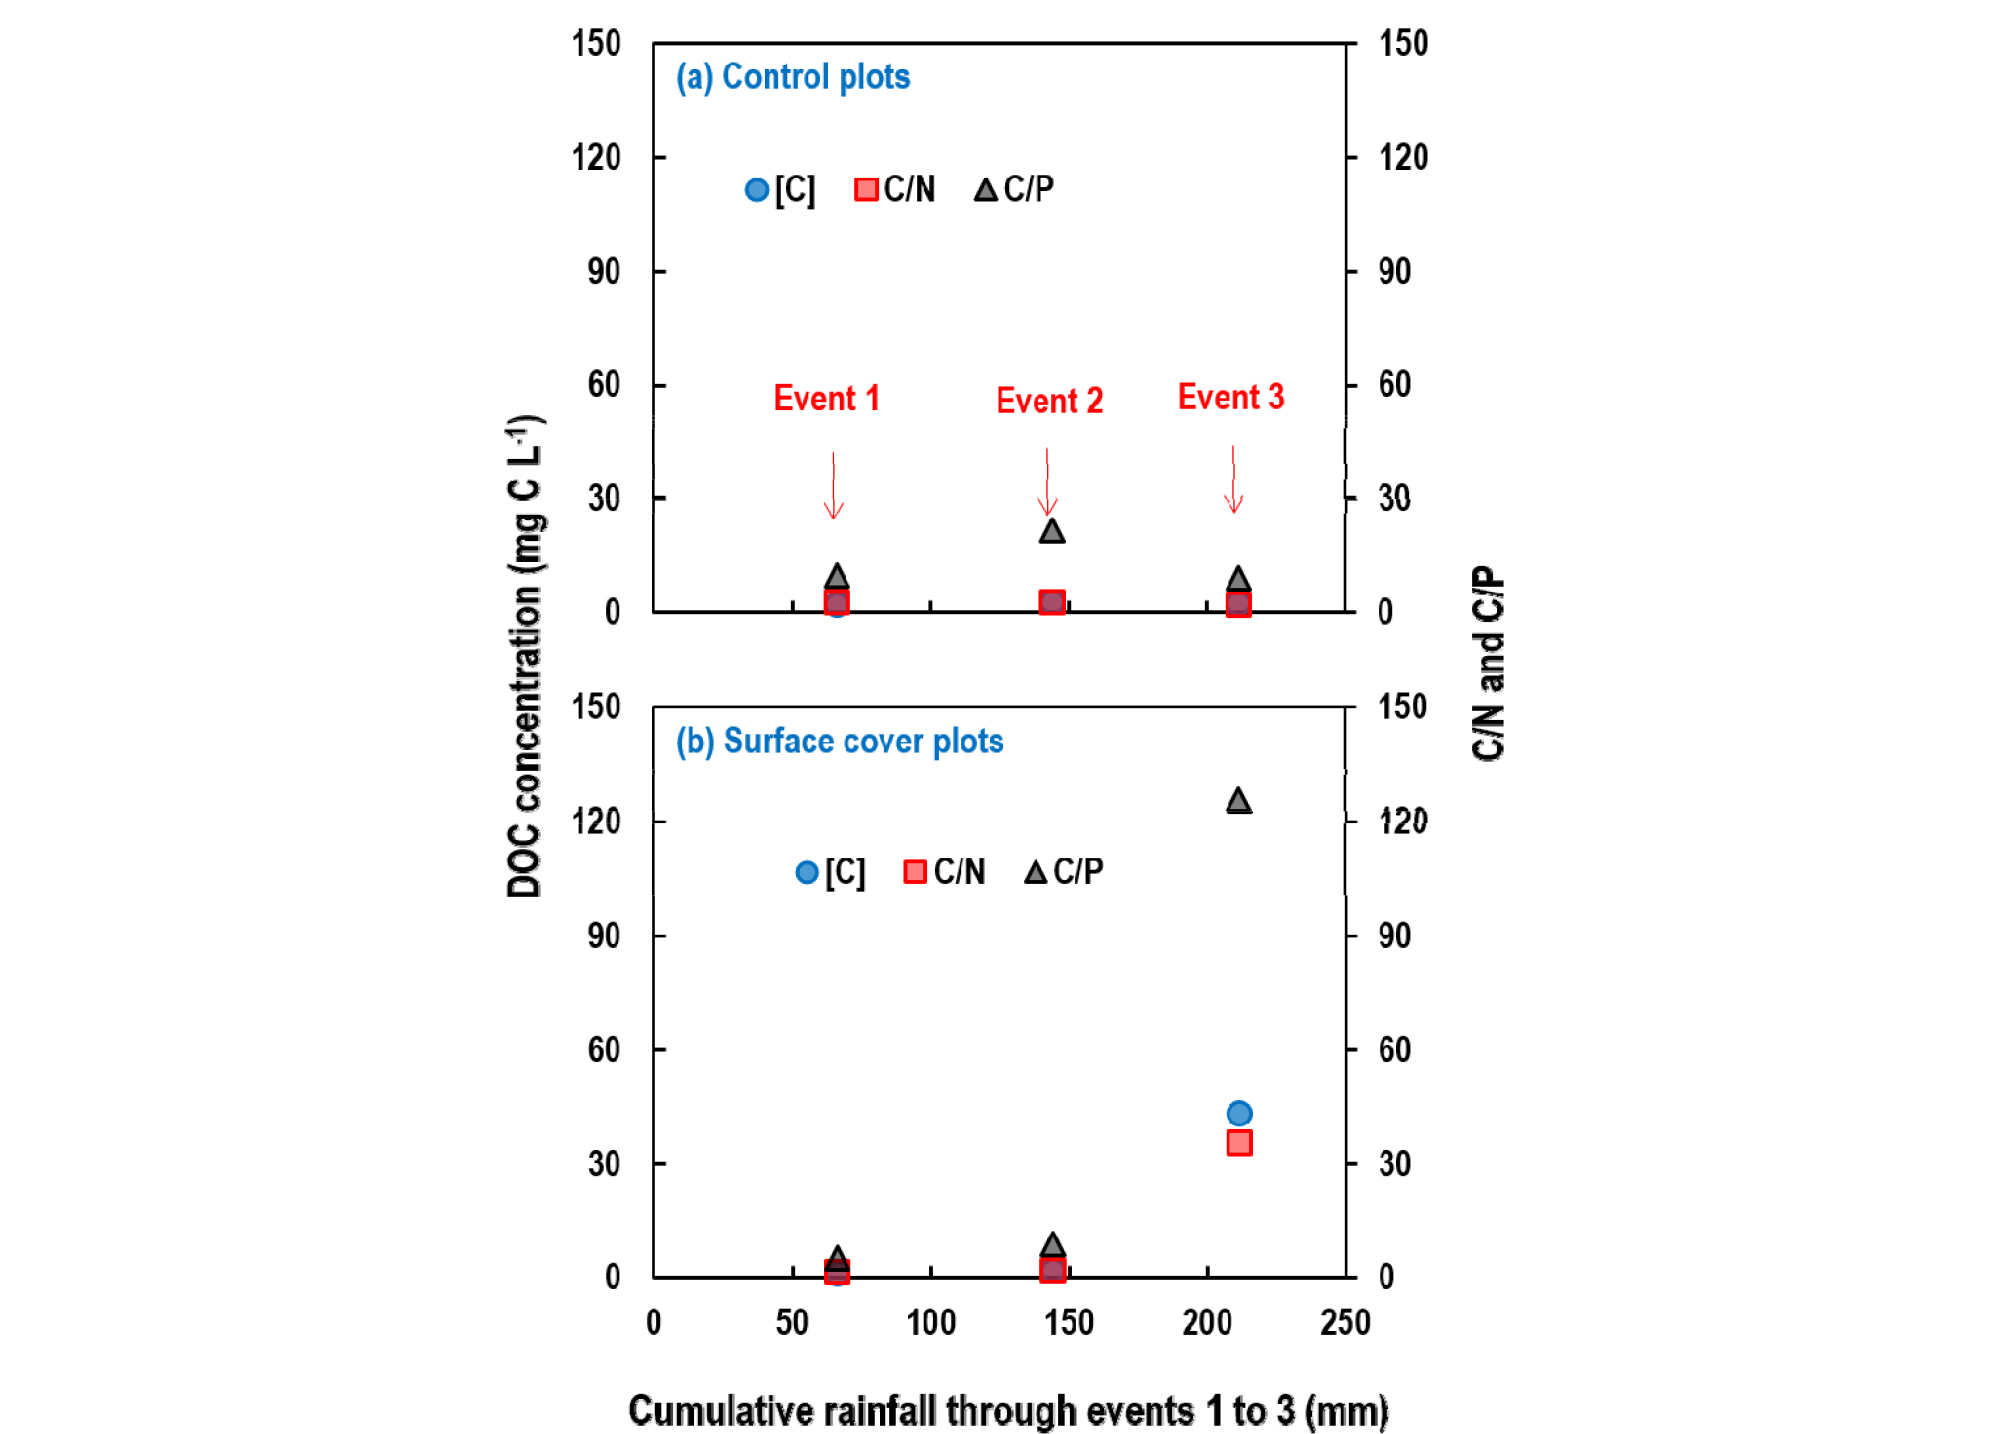
Fig. 4.
Changes in the concentration of DOC and C/N and C/P of dissolved CNP in runoff water from (a) control and (b) surface-covered maize upland fields with increased cumulative rainfall through events 1 (June 27), 2 (June 28), and 3 (June 29‒30). Error bars were not depicted but found in Figs. 1 and 2.
Conclusion
Our study shows that surface cover with rice residue increases dissolved C/N and C/P ratios of runoff water due to increased export of DOC through decomposition of the covered straw. Such distinguished C/N and C/P of runoff water from fields covered with straw residue, particularly in the late period of continuous rainfall, may be used in evaluating the impacts of crop residue cover on agricultural water pollution surrounded by the fields. However, more extensive studies on the changes in the C/N and C/P ratios of runoff water from fields covered with various crop residue are necessary to investigate the effects of different crop residue type on the stoichiometry of CNP.
