


Introduction
Korea has a temperate climate, therefore the country has no short of rainfall. However, in recent decades, Korea is experiencing severe drought during spring and summer as Korea is under climate change effects (Kim, 2016). This condition creates crop yield losses by drought damage during crop sowing and growing period. Therefore, Water stress is one of main limiting factors for crop growths and productions in Korea lately.
Sesame (Sesamum Indicum L.) is described as the oldest oilseed plant cultivated by human (Bedigian, 2011). Sesame is a diploid annual plant and one of the important oil crops in eastern Asian. Sesame is presumed its origin as Ethiopia and India whose climates are hot and dry (Ashri, 1998). Main countries of sesame production are India, Myanmar, Sudan and China which are located in subtropical and temperate regions (FAOSTAT, 2012). Therefore, Sesame is known to be drought tolerant, but a deep understanding of a relation between soil moisture and sesame has not been done. Previous studies showed that sesame is very susceptible to environmental stress and water stress is one of constraints for sesame growth/production (Mensah et al., 2006; Tantawy et al., 2007; Uçan et al., 2007) and seed components (Shim et al., 2010; Chun et al., 2017). These studies resulted that sesame yields have significant relation to soil moisture contents or irrigation amounts. Chun et al. (2016 & 2017) reported that sesame reduced yields under excessive soil moisture contents and the greatest reduction of yield occurred when sesame was exposed to waterlogging condition at early vegetative stage. Bahrami et al. (2012) tested drought damage by various sesame growth stages and concluded that sesame has great drought damage on germination and seedling growth regardless cultivars. The optimal irrigation management for sesame cultivation is different by cultivation methods, soils, and climate, but many research shared a same result that sesame yields are evidently affected by supplied water amounts to sesame (Kassab et al., 2005; Tantawy et al., 2007).
Crops cope with water stress by anatomical, morphological or physiological response. Root growth and development is important for characterization of crop adaptation to water stress (Fukai and Cooper, 1995; Price et al., 2002). Many studies have been investigated root characterizations of crops/plants under water stress; root dimensions, such as root length, surface area or volumes (Osonubi, 1985; Zhang and Davies, 1989; Li et al., 2006; Cai et al., 2017), root elongation rate (Whalley et al., 1998; Bengough et al., 2011), and root spatial structure (Fitter and Stickland, 1992; Nielsen et al., 1997; Wang et al., 2009). These studies highlighted the need for understanding effects of water deficit stress to crop root system. These studies commonly concluded that crop roots are sensitive to water stress and root properties are affected by soil moisture condition. There have been many studies regarding sesame yield changes under water stress, but there is no morphological analyses of sesame under water stress. Water is one of major limits to sesame cultivation in many areas including Korea, it is important to understand water effects on morphological characteristics of sesame.
Analysis of spatial distribution of an interest object is a relatively simple and powerful tool to characterize a structure of an object. The fractal and lacunarity analysis which are ones of spatial distribution analyses have been proven to be sensitive enough to characterize heterogeneous structures or distributions of various objects (Pozdnyakova et al., 2005; Chun et al., 2008). The fractal dimension measures the complexity in their roughness or distribution, and the lacunarity measures structural variation (Smith et al. 1996). The fractal and lacunarity analysis have been applied to various fields; ecological structure (rock, river, etc) (Burrough, 1981; Shi et al., 2018; Zuo, 2018), neuron/ gene structure (Rubini et al, 2018), soil/aggregate structure (Zeng et al., 1996; Gimenez et al., 2002), plant identification (Bruno et al., 2008; Chandra and Rani, 2009; Jiang et al., 2009). These analyses have been applied to quantifying plant root system or structure (Tatsumi et al., 1989; Fitter and Stickland, 1992; Eghball et al., 1993; Hauck et al., 2015). Wang et al. (2009) investigated rice root changes in response to drought stress by using fractal analysis. They found that fractal dimension characterized root developments as affected by drought condition. There have been studies of crop root changes under water stress, however, morphological and spatial distribution characterization of sesame roots under various soil moisture contents has not been investigated. This study hypothesized different soil moisture contents would induce changes of morphological properties and spatial distributions in sesame roots. The objectives of this study were characterizations of morphological and spatial distributions of sesame roots from various soil moisture contents.
Materials and Methods
Crop and Soil
The experiment of sesame was performed in University of Florida, Gainesville, USA in 2017. Two cultivars of sesame were selected in this study; Bene and Indie. Bene is a widely grown cultivar in China and Indie is grown in India. These cultivars were selected since China and India are major countries of sesame globally (FAOSTAT, 2012). Both cultivars were grown for 23 days. The soil of this experiment was turface, a porous ceramic materiel (SiO2 74%, Al2O3 11%, Fe2O3 5%) that improves drainage, reduces compaction and hold moisture. This turface is easy to control unnecessary water-holding in soil and to visualize sesame roots in soil.
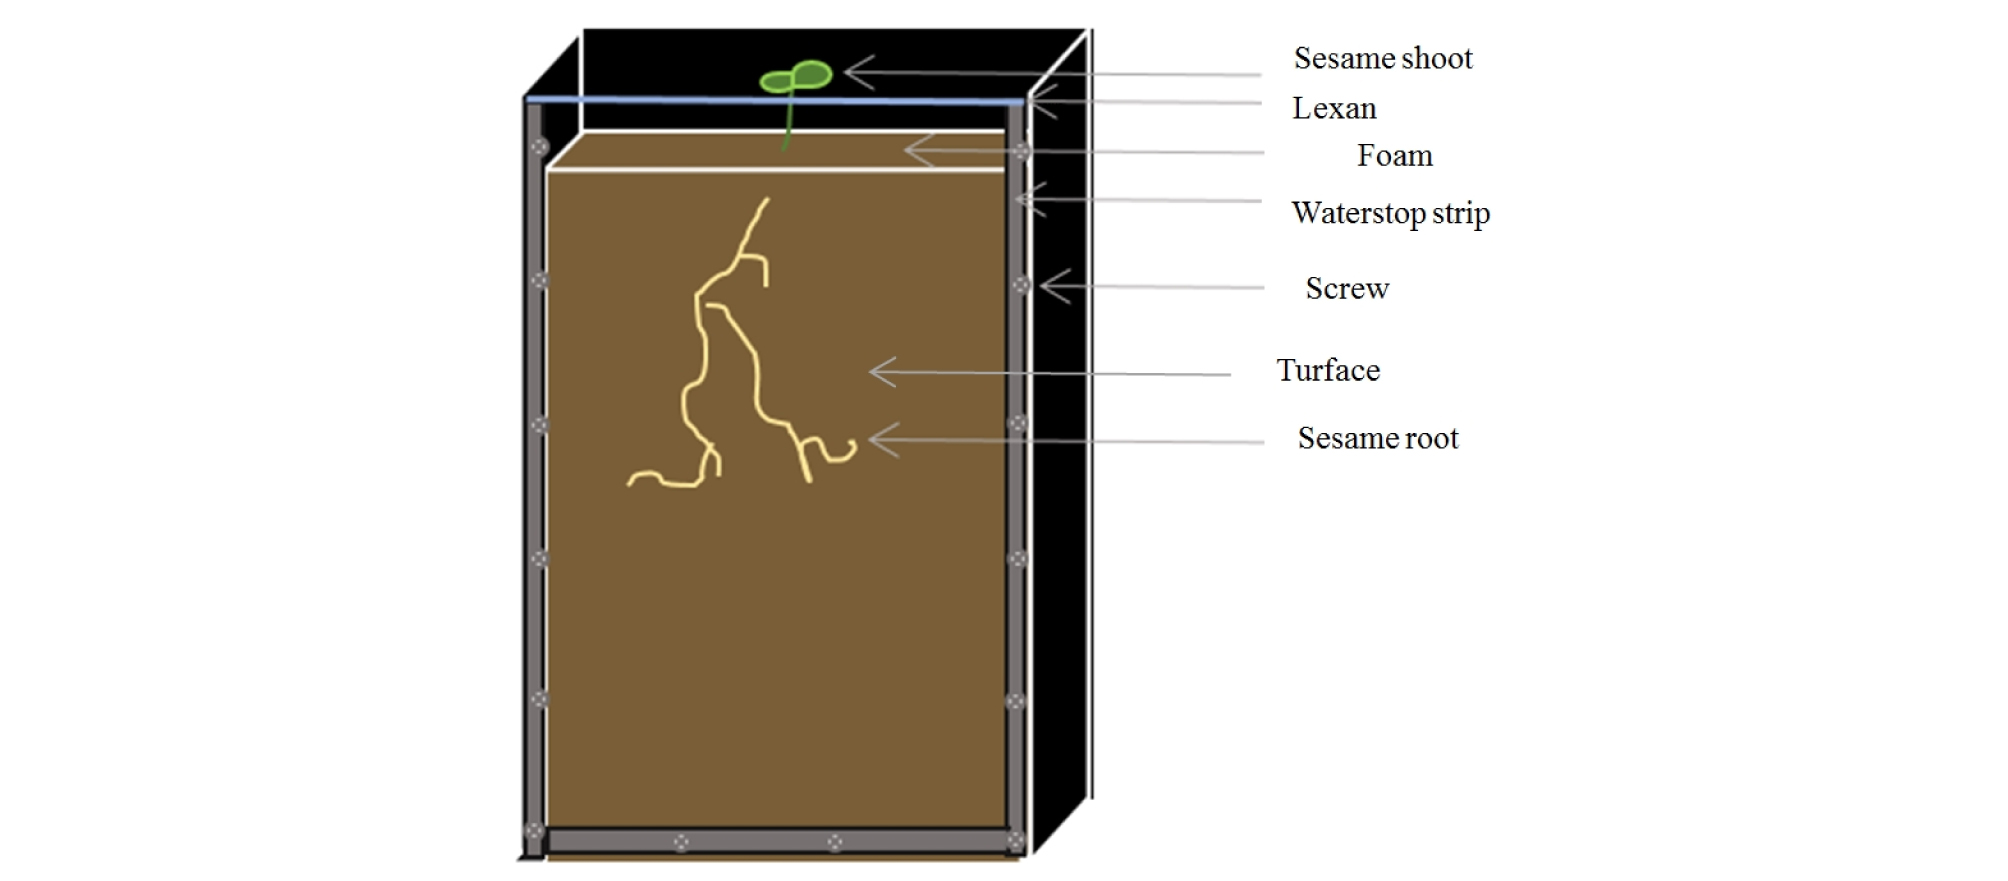
Experimental test box
Plastic boxes with thick edges were used to create an opaque container for sesame (Fig. 1). An upper side was open to fill soil and grow sesame. The dimension of box was 35 × 21 × 4 cm and the total number of boxes was 24 including 3 replicates and 4 moisture treatments. Four moisture treatments were set as 40, 50, 75 and 100% of soil moisture content. Each soil moisture level was determined by a saturation percentage of turface. Each box contains a same amount of turface (1450g) and an amount of water for each box was calculated to reach a target moisture level (Table 1). The same amount of turface and calculated amount of water were mixed and each box was filled with this mixture. Two seeds of sesame were planted at 2 cm deep from the soil surface in each box. In order to reduce evaporation during sesame growing, the soil surface was covered by a foam with a hole around sesame seeds on the top of each box. After planting, scans of roots were done every 2 days for 23 days. Measurements of roots were performed using WinRHIZO software (WinRHIZO Tron, Regent Instruments, Canada) from scanned root images. In addition, the maximum depths reached by roots at the scanning date were also measured. All sesame roots were harvested after 23 days of planting. The roots were picked carefully without breaking roots from the boxes and washed before scanning. The scanned root images after the harvest were measured for the root numbers, total lengths, volumes and surface areas by the WinRHIZO software.
| Moisture content (%) | Volume of water added (ml) |
| 100 | 1160 |
| 75 | 870 |
| 50 | 580 |
| 40 | 464 |
Fractal analysis
The digitized root images were converted into binary images and applied for fractal analysis using Image J (NIH, Bethesda, ML). The image size was 2819 × 3779 pixels. The fractal analysis is estimating heterogeneity by applying linear regression of counts of box and box size. The box size ranged from 0 to 45% of the image size. Series of box sizes were applied to count number of boxes with root. This process was repeated until covering an entire image (Tarquis et al., 2003).
Fractal dimensions (Db) were estimated by applying linear regression of these relationships and their slopes were -Db values. Fractal dimensions from root images were obtained from the number-size relationship (Gimenez et al., 1997).
N(C) = KC-Db (1)where N(C) is number of roots at box size, C. K is a number of initiators of unit length, and assumed to be as 1.
Lacunarity (Lac) is defined in terms of mass related distributions. It calculates the variation in root pixel density at different box sizes.
Lac = (σ⁄μ)2 (2)where Lac is lacunarity values over all box sizes, σ is the standard deviation and µ is the mean of number of roots box at box size C.
Statistical analysis
All the measurement results from the roots were analyzed statistically by a mixed model. The mixed model analysis of variance with an auto-regressive (AR1) covariance structure was fit using JMP® Pro 13 (SAS Institute Inc.). Days after planting (DAP), cultivar (CV) and moisture level (M) were defined as fixed factors, and all interactions were considered. Blocks were defined as random. This model was used several time on two response variables: Total Root Length and Total Number of Tips. The root tips are a measure of the number of total individual root branches, counting primary, secondary, tertiary, etc. roots as individual tips. Both response variables had to be square rooted to homogenize their variances and normalize their distributions.
In addition, a regression line was fitted between the Total Root Length from Tube Scans (TRL-TS) and the Total Root Length from Float Scans (TRL-FS). Indeed, the regular tube scans only allow to visualize the part of the root system that is growing on the surface of the clear glass. A linear relationship between TRL-TS and TRL-FS would prove that TRL-TS is an adequate representation of the whole root system of the plant in the test tube.
The measurement results of the roots after harvest and results from spatial analyses were applied to ANOVA (Analysis of Variance) and correlation analysis at 95% significant level using SPSS (v.9.0.1, SPSS Inc., Chicago, USA).
Results
Morphological measurements of roots
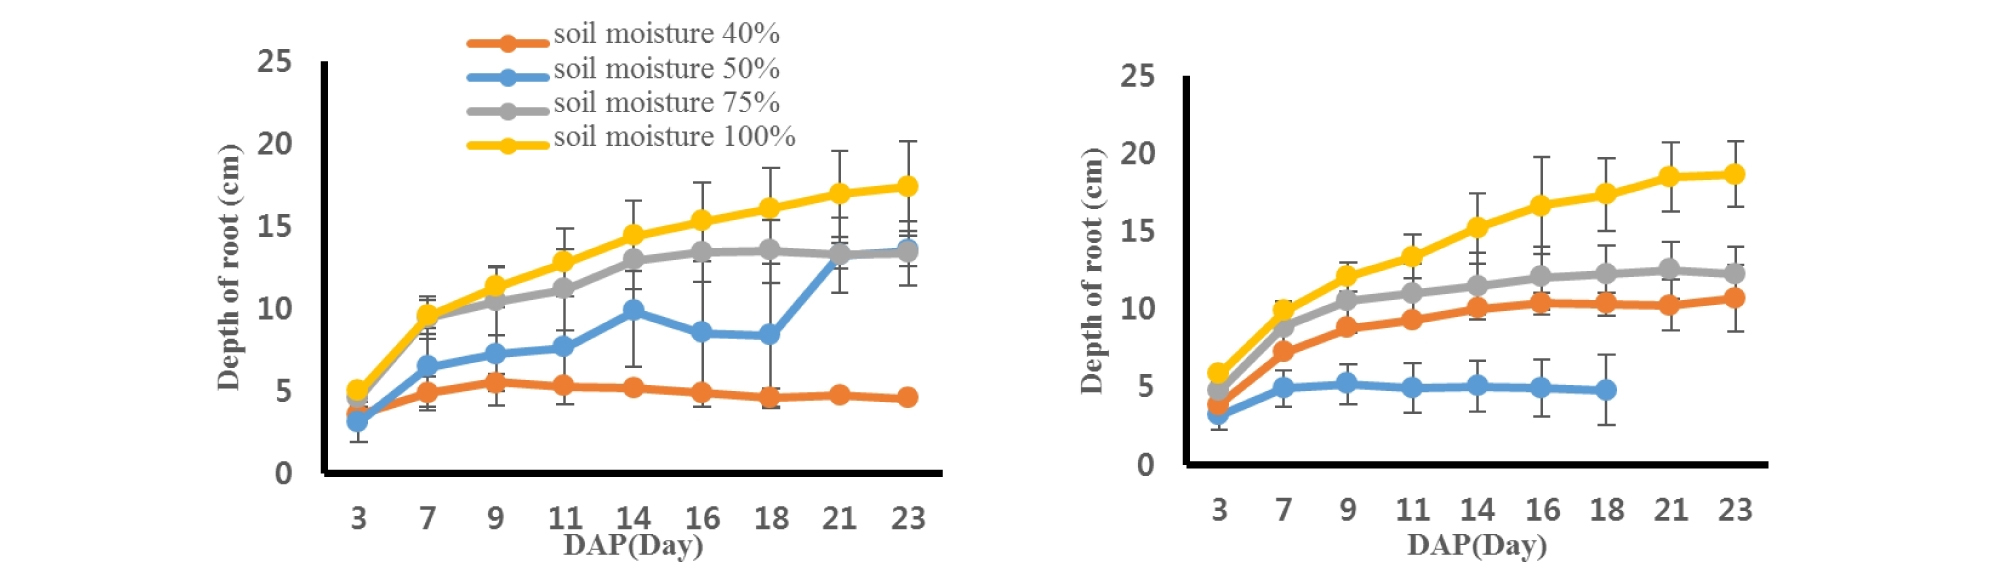
Sesame roots were scanned every two days after planting and soil depths where the roots reached were measured (Fig. 2). Bene and Indie cultivars showed similar trend in root depths under different soil moisture contents. Sesame roots grew better with a greater water content from both cultivars. The Indie root from 100% soil moisture content had the greatest value, 18.70 ± 2.13 cm from soil surface at 23rd day, while the smallest one was 0.75 ± 1.84 cm from Bene sesame with 40% soil moisture level. The rates of root growing were greater from the sesames with the greater water contents. Roots from 40% soil moisture content decreased steadily as days passed, however, roots from soil moisture 100% showed the greatest increasing rate in root depth. The depth of roots had no difference between the two cultivars (P = 0.92), but there was significant difference across soil moisture contents (P < 0.0001) (Table 2).
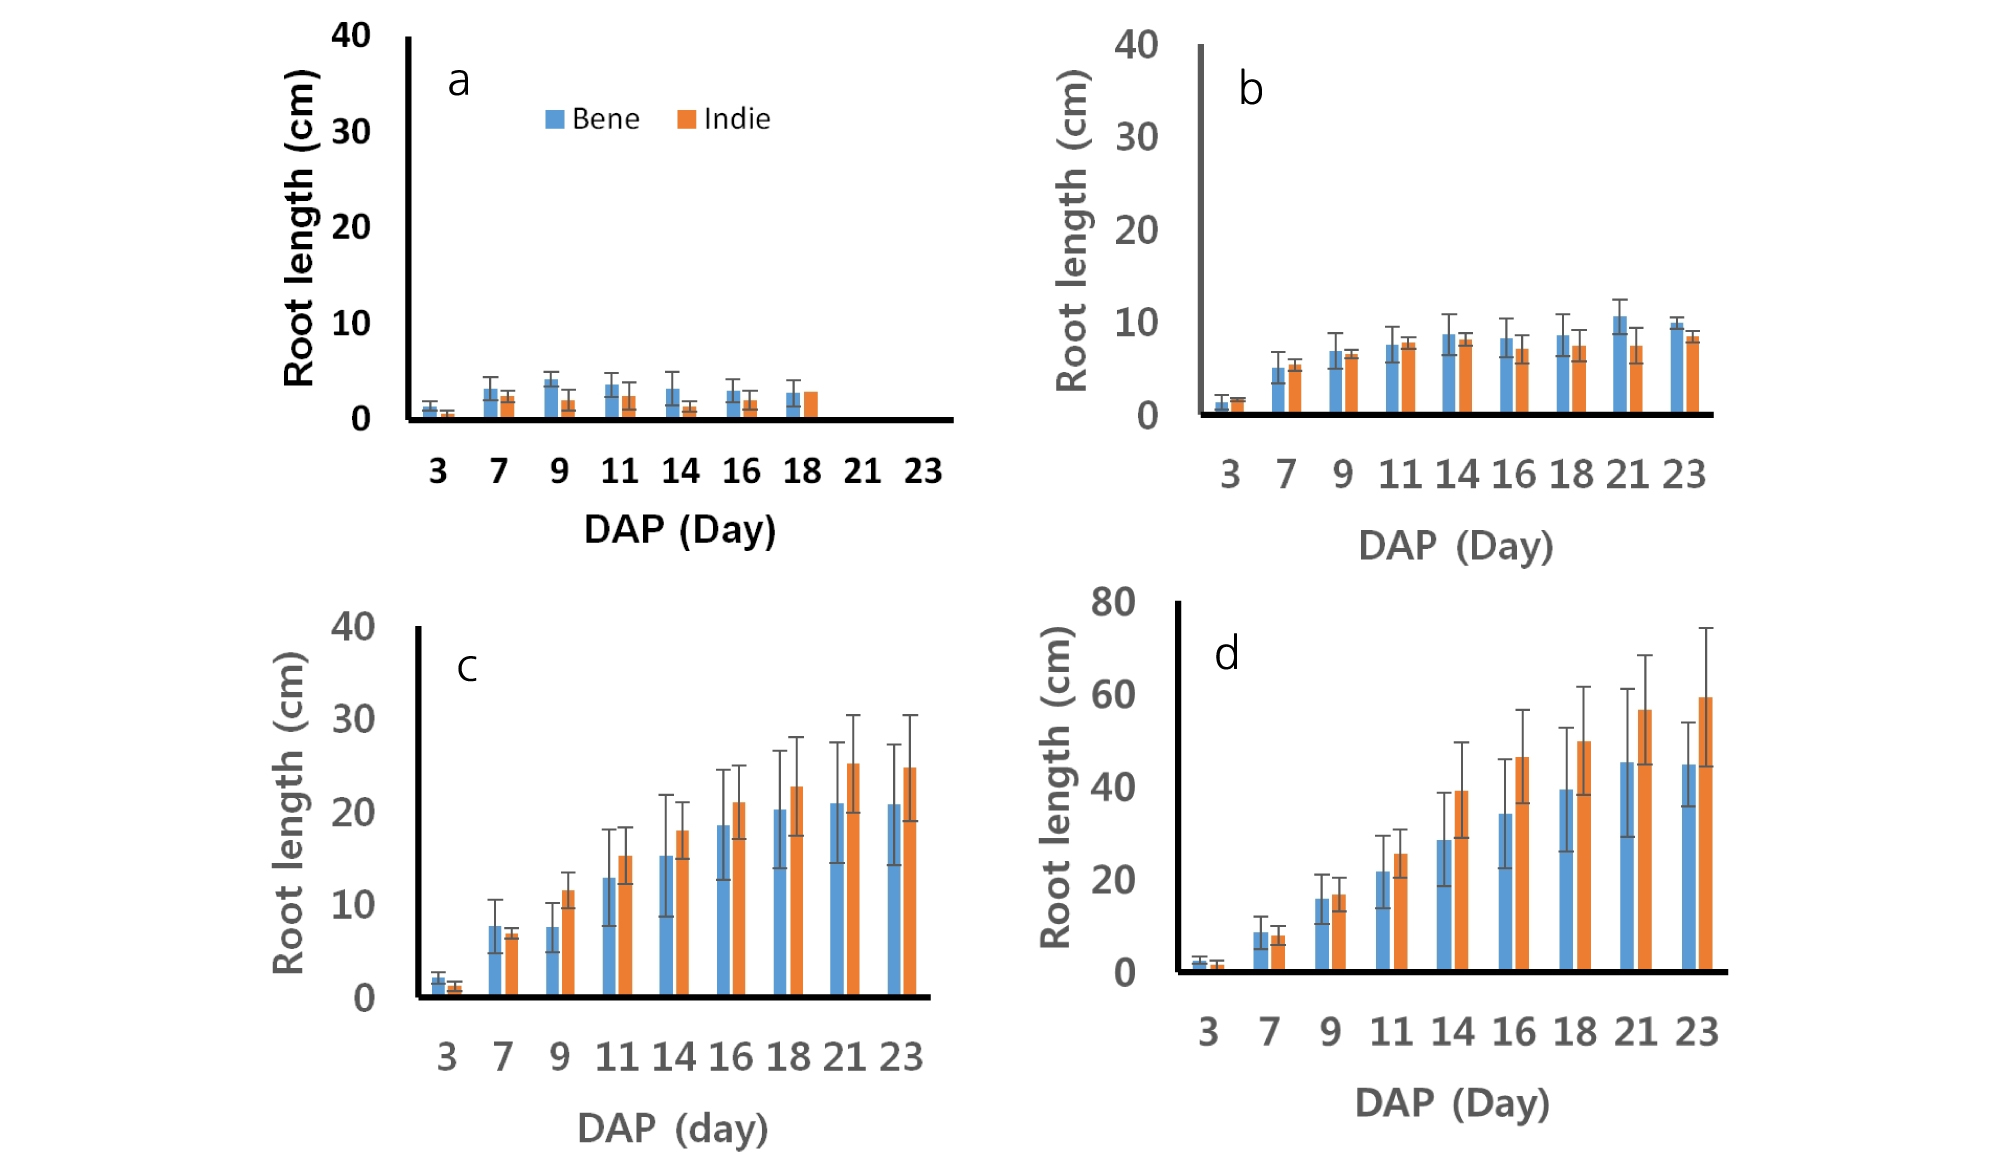
The lengths of sesame roots measured every two days during growing are shown in Fig. 3. The patterns of the root developments were different across soil moisture contents. The lengths of sesame roots increased steadily until the 23rd day after planting from greater soil moisture contents (75 and 100%). On the other hand, roots from smaller soil moisture contents (40 and 50%) increased in the length until the first two weeks and then after two weeks, the roots decreased or did not increase. The roots of Bene and Indie dried out and dissipated after 18th day from 40% soil moisture level. The roots of Bene from soil moisture 40% grew from 1.42 cm to 2.81 cm and ones of Indie did from 0.60 cm to 2.94 cm. The roots of Bene and Indie from soil moisture 50% also grew up to 10.63 cm and 8.47 cm, respectively. The length of roots from soil moisture 100% were range from 2.55 to 44.73 cm from Bene and from 1.45 to 59.21 cm from Indie. The statistical analysis showed that there was no significant difference between two cultivars in root length (Table 3). Root lengths did not show clear difference or trend between cultivars at 40 and 50% soil moisture contents. Roots of Indie developed longer than ones from Bene from 75 and 100% soil moisture contents. Commonly, roots of the both cultivars showed greater development in length with 75 and 100% soil moisture conditions.
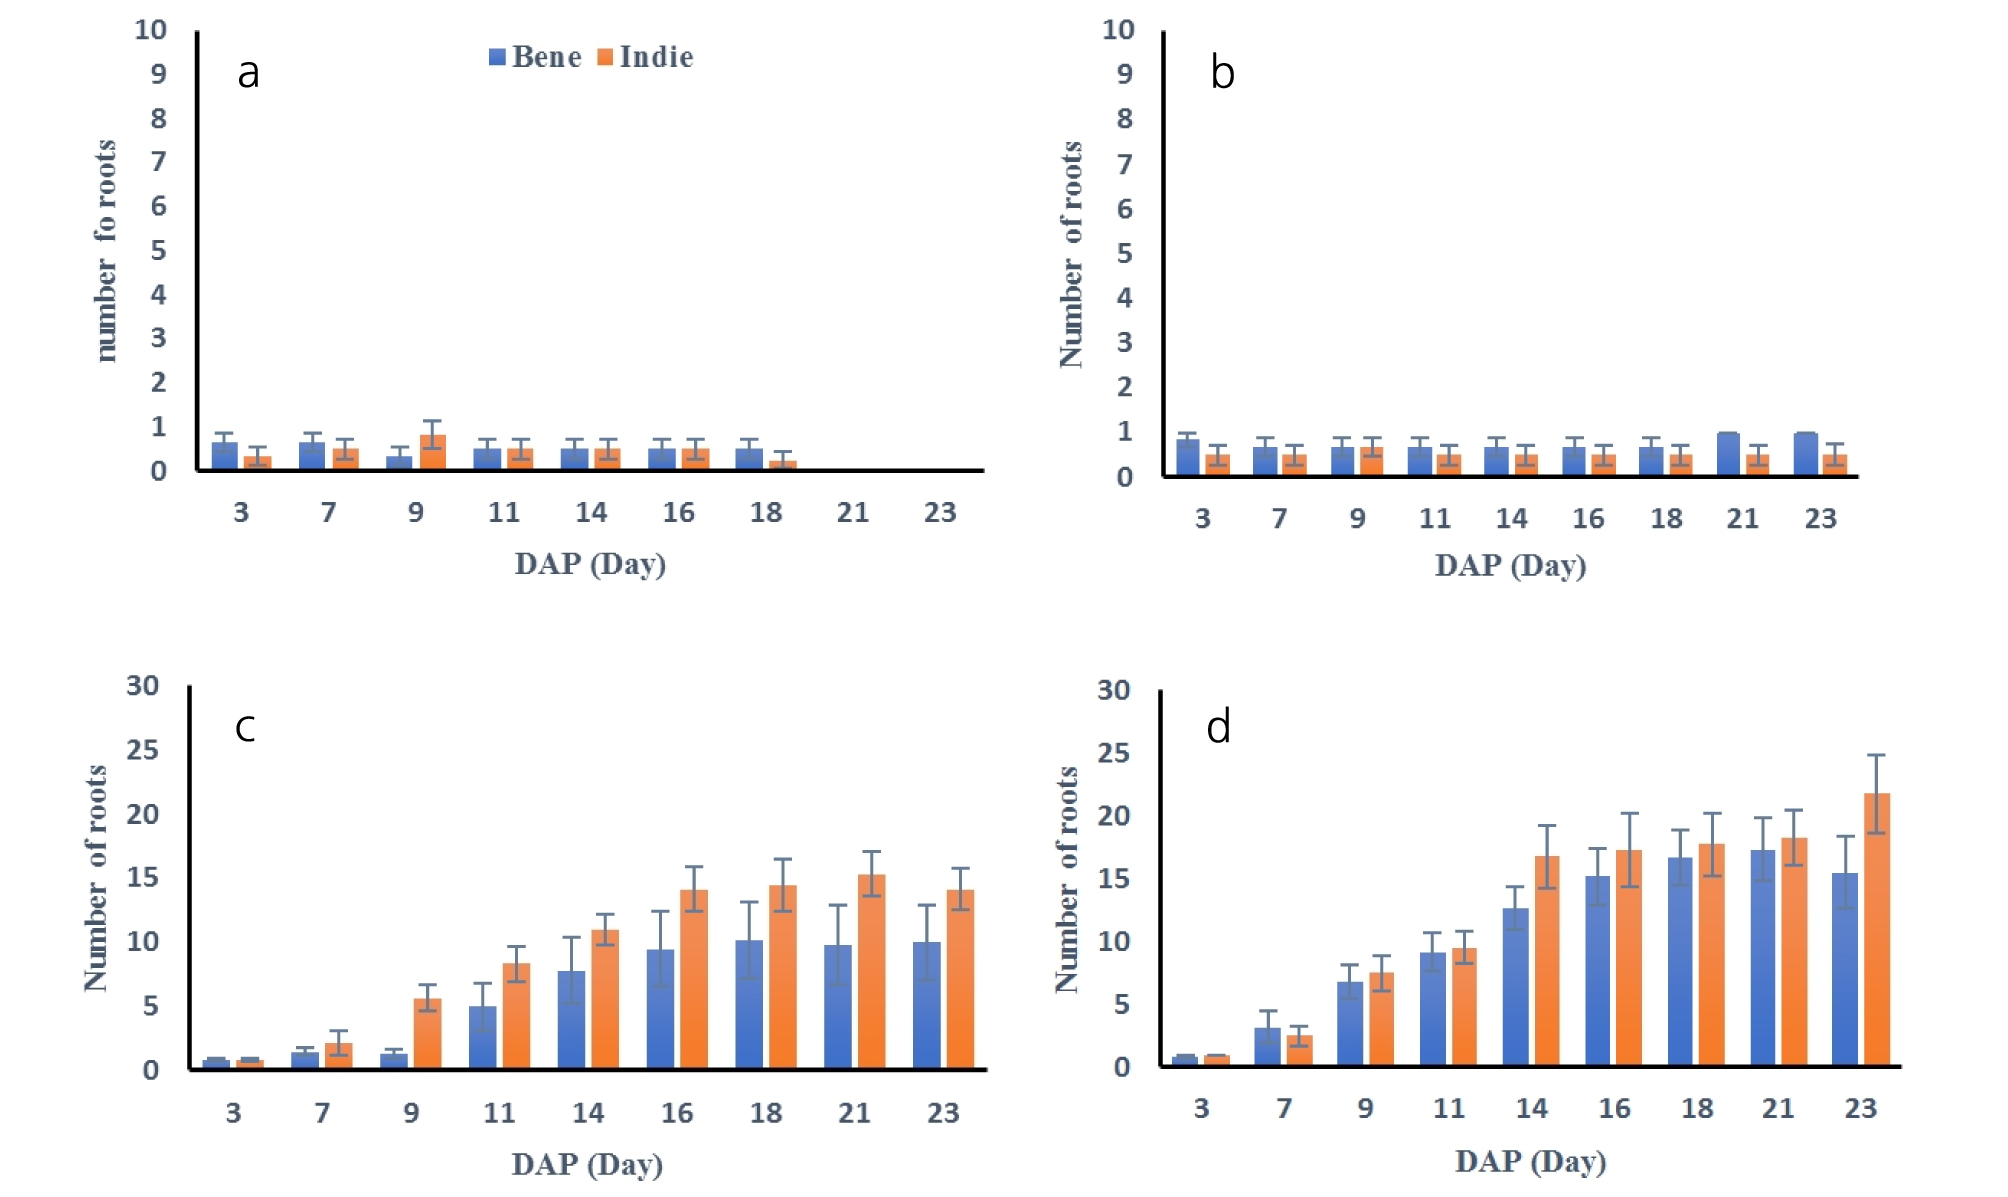
Number of roots were also measured every two days and results are shown in Fig. 4. The number of roots developed more under greater soil moisture conditions. The statistical analysis resulted that number of roots were distinguished from soil moisture contents (Table 3). Average number of roots from Bene and Indie were smaller than 1, which meant roots did not develop any secondary roots under 40 and 50% soil moisture conditions. Roots from both cultivars had the greatest number of roots under 100% soil moisture contents. The number of roots from Indie increased significantly after 9th day and total number of roots were over 14 and 20 under 75% and 100% soil moisture content. The number of roots from Bene had similar trend as ones of Indie, but the total number of roots was smaller than Indie.
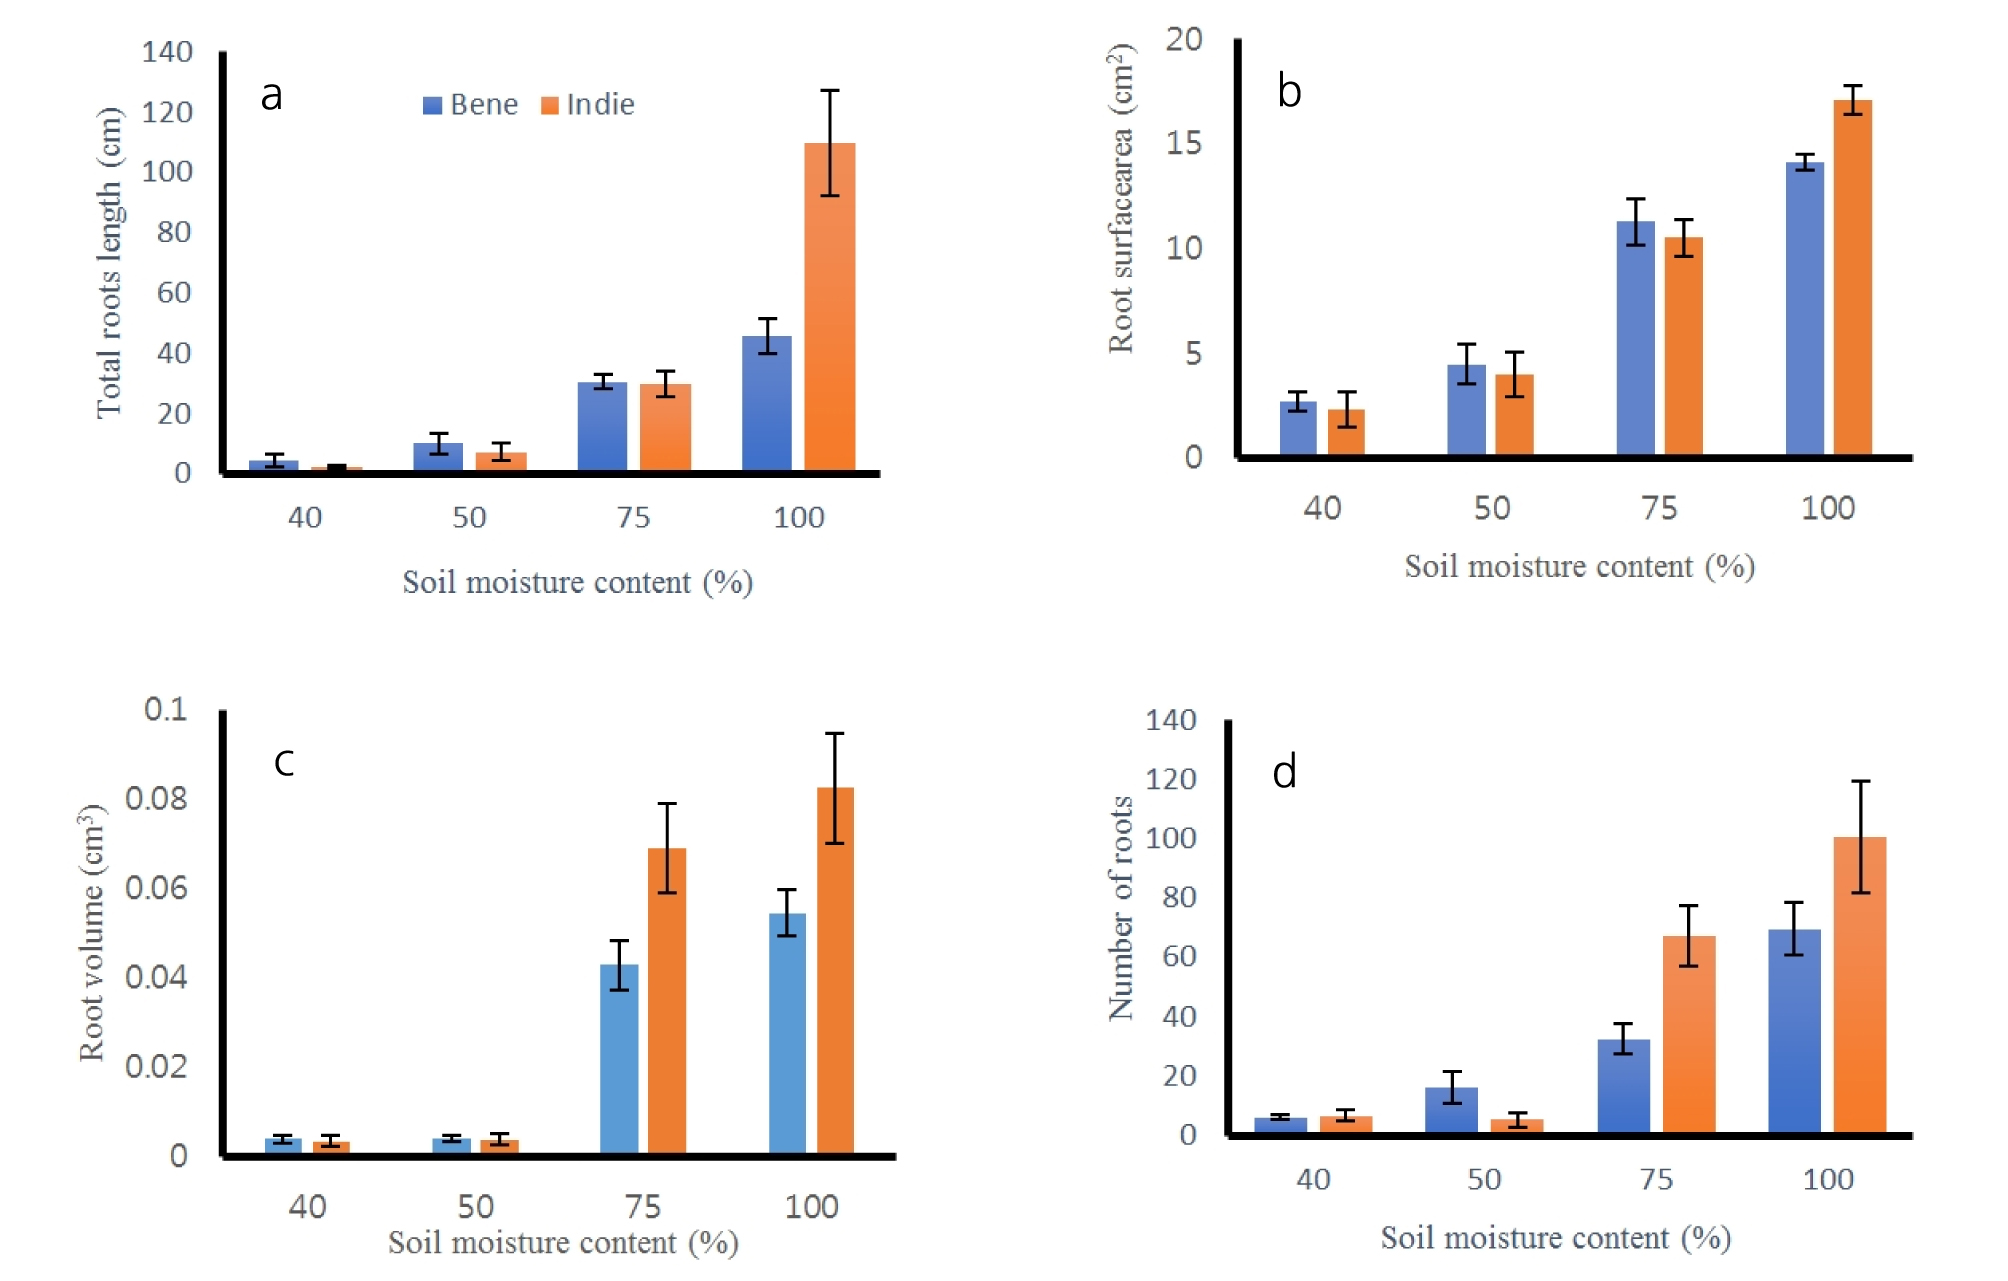
After harvest of roots, all the roots were cleaned and scanned to measure lengths, surface areas, volumes and numbers of tips. The results of total length, surface areas, volumes and number of roots are shown in Fig. 5 and Table 4. All of the root measured properties had no significant difference between cultivars (p > 0.60), but there was difference across soil moisture contents (p = 0.00). The total lengths of roots were the greatest values as 42.01 ± 4.01 cm at 100% moisture content and the second greatest at 75% as 21.02 ± 5.01 cm. The lengths of the roots were the smallest at 40% moisture contents. The areas, surface areas and volumes had the same trend of results as the total length results. The number of roots had significant difference between greater moisture and smaller moisture groups. The soil moisture content of 100 and 75% had greater numbers of roots than ones from 40 and 50%, but there was no difference between number of roots from 100 and 75% and between ones from 40 and 50% moisture content. The numbers of roots were 12.08 ± 5.94 and 15.00 ± 9.77 from 75 and 100% soil moisture contents. Sesame roots had distinguishable separation in root length, area, surface area and volume from soil moisture of 100% than ones from the other soil moisture contents.
Spatial analysis of roots
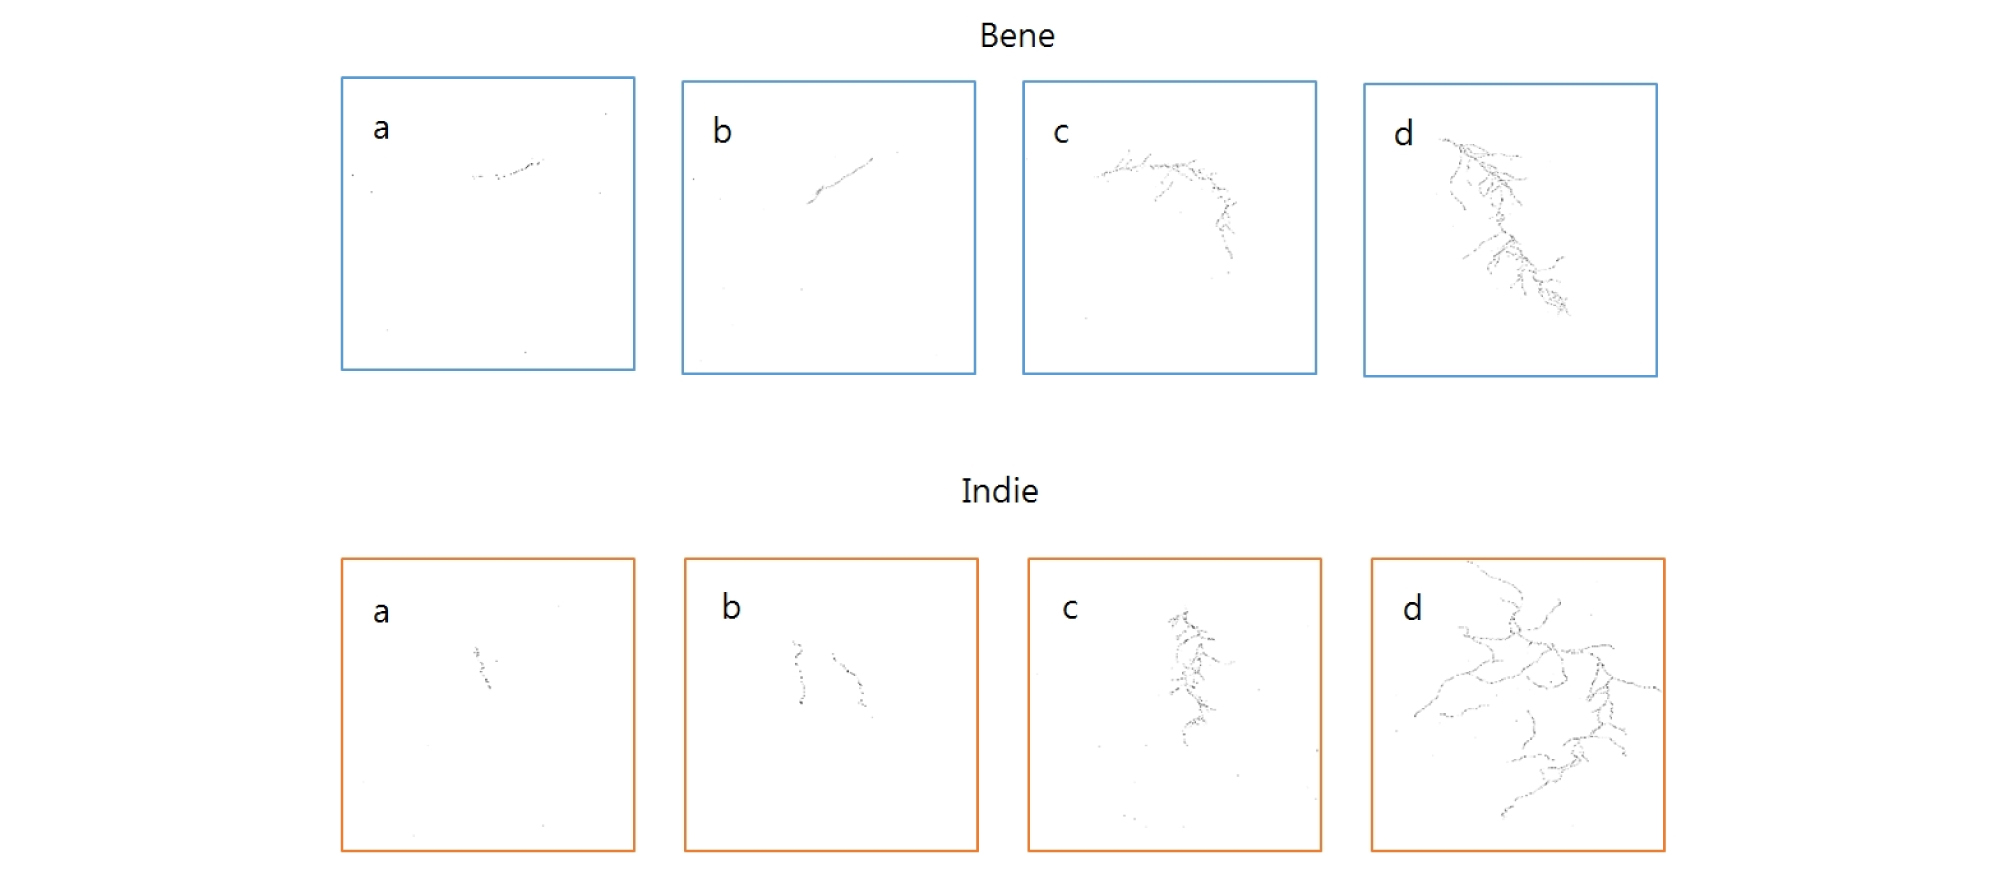
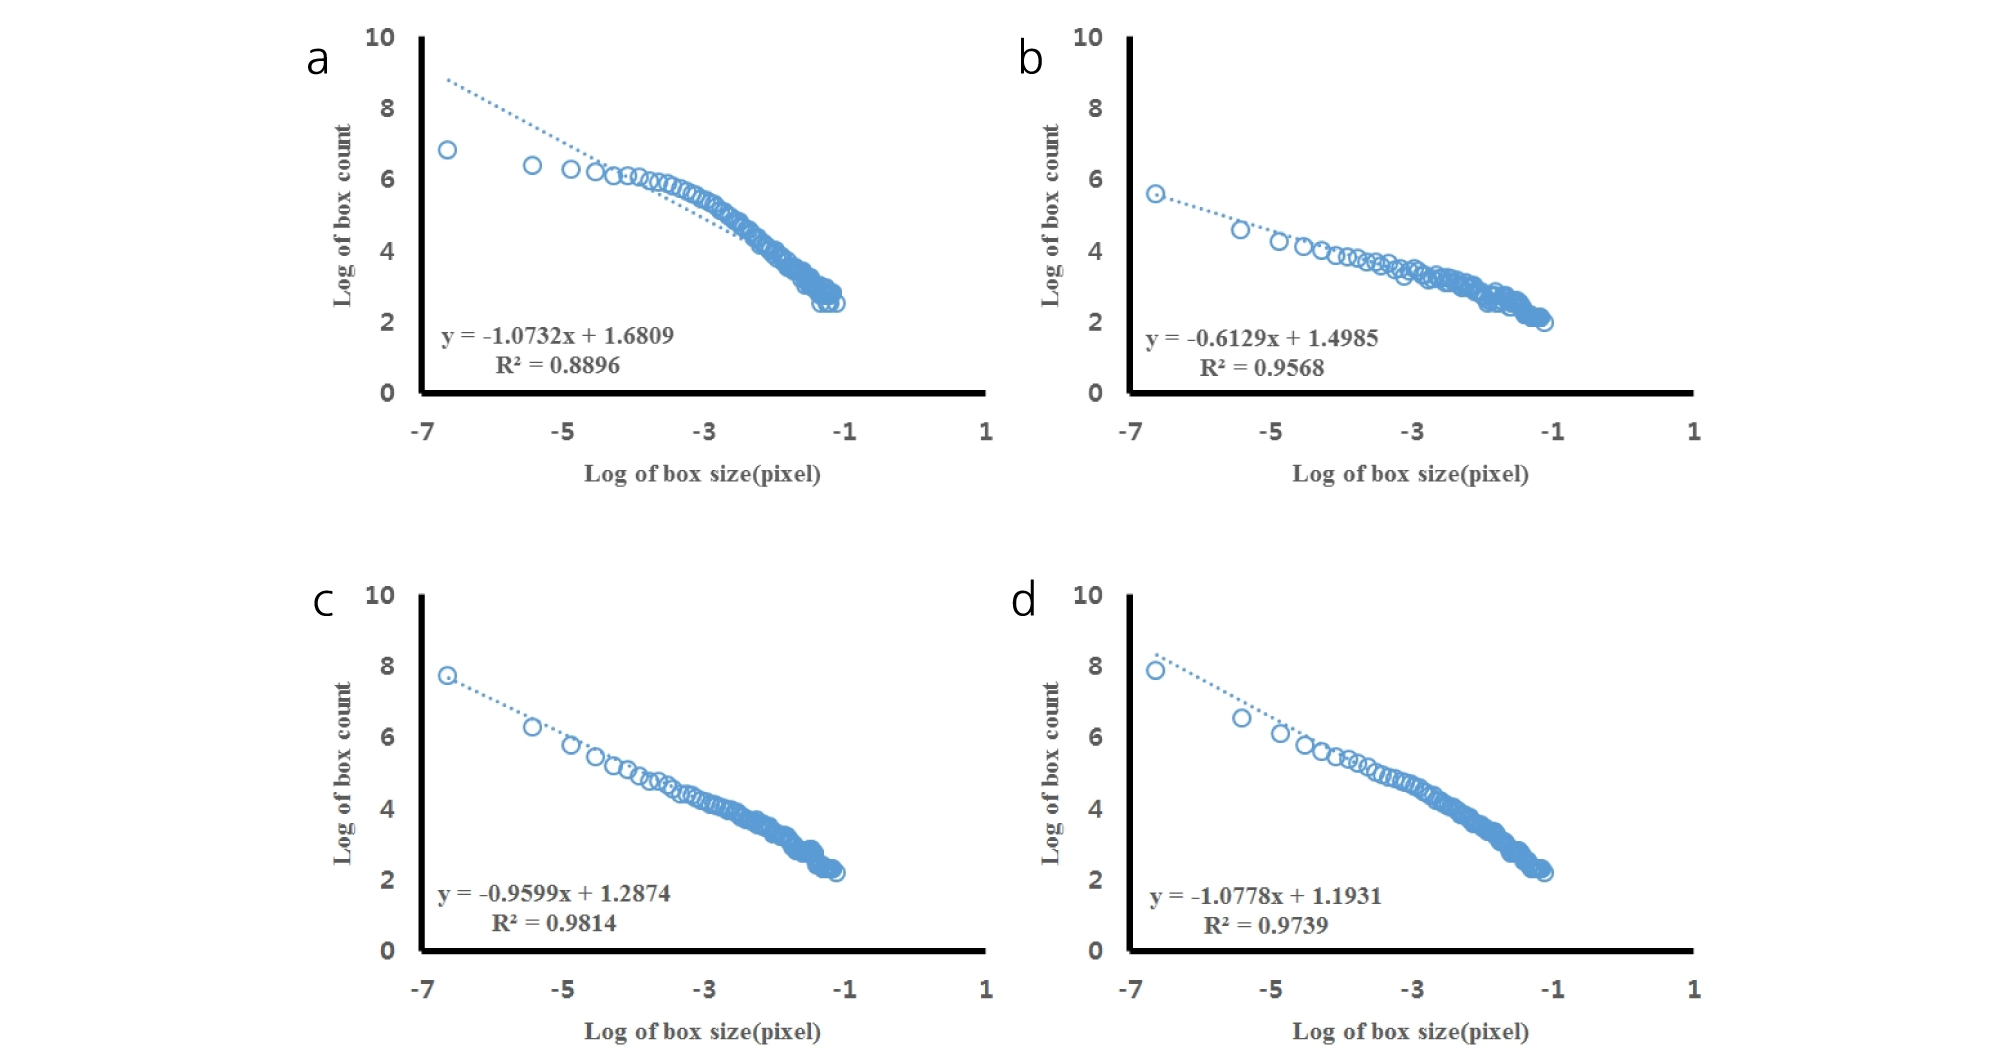
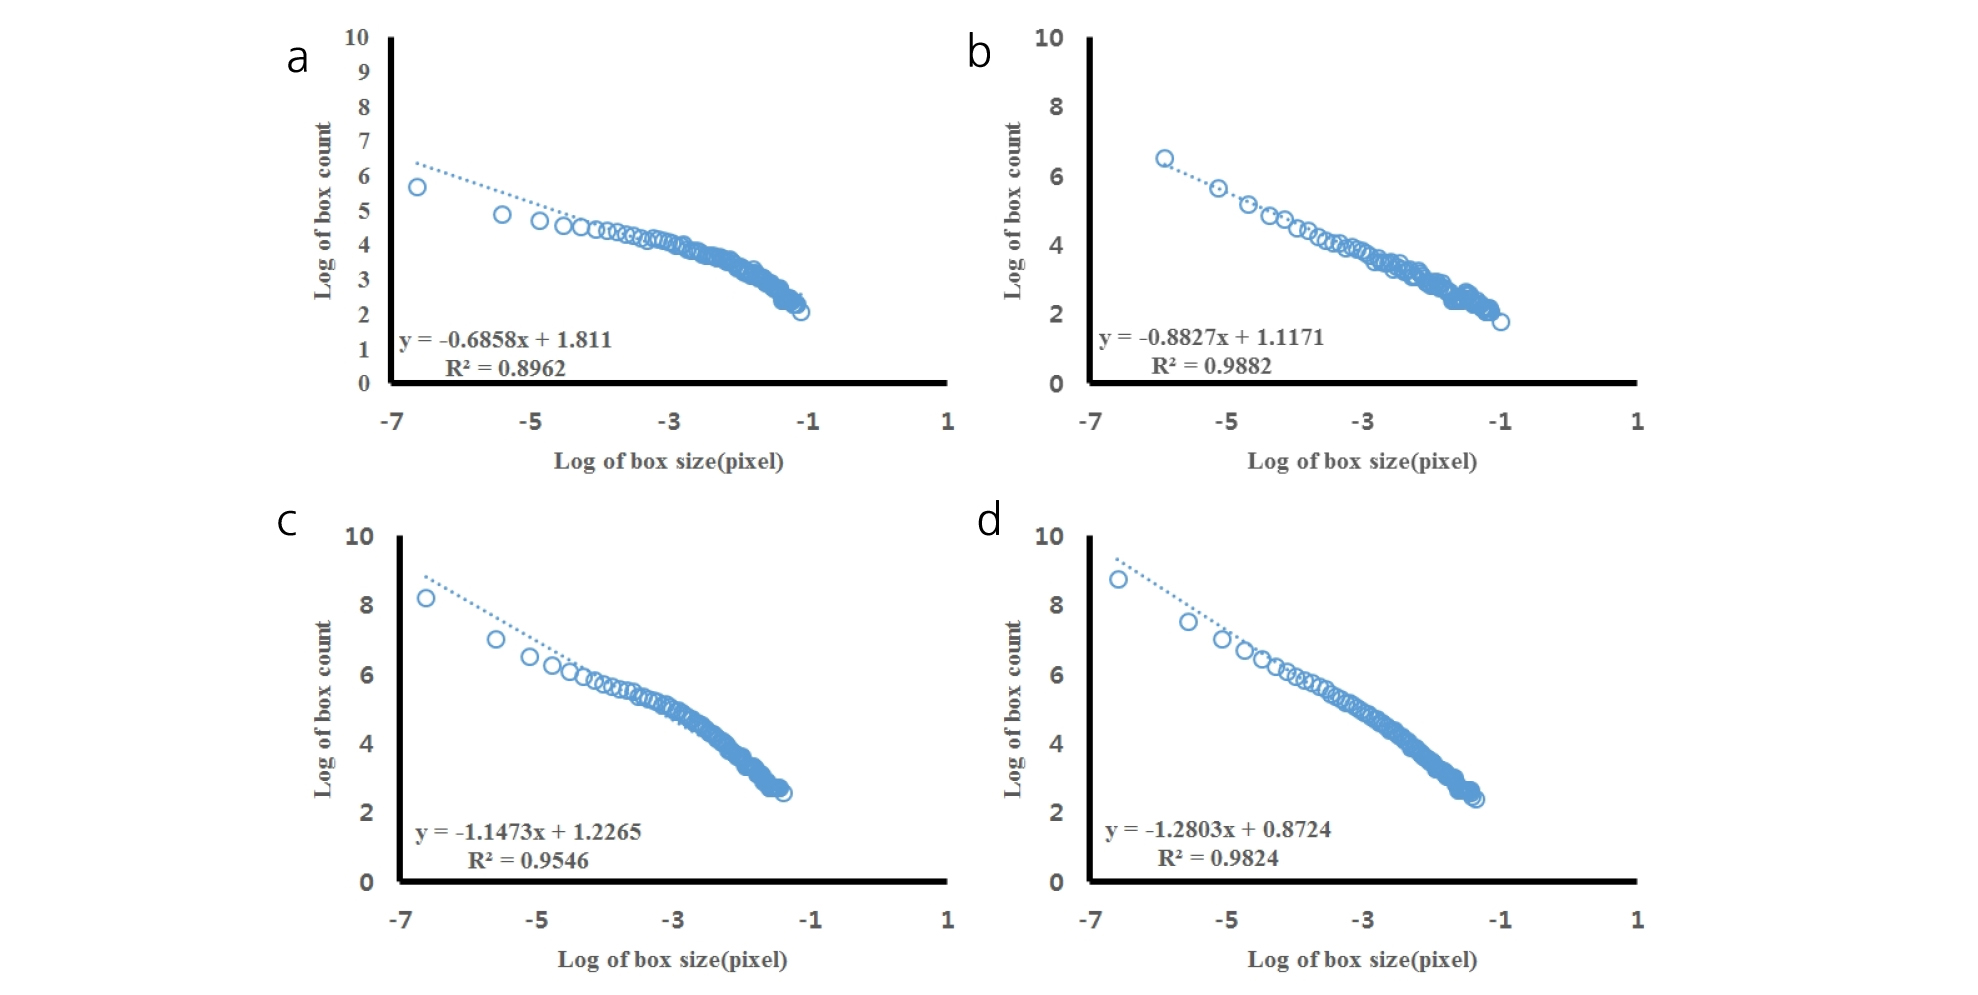
All the scanned images of the roots were applied with fractal analysis (Fig. 6). The fractal dimension (Db) and lacunarity (Lac) values were calculated from each root image (Fig. 7 and 8, Table 5). The fractal dimension values are determined by slope of a regression line between counts of box with root appearance and box sizes. The r2 values from all the regression fittings showed that ones from smaller moisture contents (40%) had smaller than 0.9 values, which meant there was no linear relation between box sizes and root appearance. Generally, the non-linear regression has a smaller r2 value and this means that the analyzed objects have no fractal structure (Klinkenberg, 1994). Therefore, roots from smaller soil moisture contents did not have self-affinity or develop the fractal structure. The results of fractal analysis had similar results of the morphological properties; root length, area, and volume. As soil moisture contents increased, Db values increased and Lac values decreased (p = 0.00), while there was no difference of Db values between two cultivars. The Db value from 100% soil moisture content was the greatest value as 1.37 ± 0.05 among all the Db values from other conditions. On the other hand, the Db value from 50% soil moisture content was the smallest one as 0.55 ± 0.05. There was no significant difference between cultivars. The Lac values had the same trend as Db changes across soil moisture contents and between cultivars. The Lac value was the greatest one as 9.15 ± 1.37 from soil moisture content of 50% and the smallest one as 1.60 ± 0.57 from 100% soil moisture content.
Discussion
In this study, morphological analyses were used to quantify the root structure of sesame under different soil moisture conditions. As soil moisture contents closed to 100%, both Bene and Indie developed more root structures. Many studies reported that plant roots tend to have greater root lengths or more roots in deeper soil layers under water deficit condition, which are contrast results to the results of this study (Benjamin and Nielsen, 2006; Kashiwagi et al., 2006; Cai et al., 2017). Previous studies investigated commonly plant roots applied water stress at least 2 weeks after planting. In this study, water stress was applied from planting. Guo et al. (2013) investigated germination, root growth of wheat at three different water contents. They found that the growth of wheat seedlings was inhibited by water stress, especially in roots. Sadeghian and Yavari (2004) researched sugar beet root characteristics from germination to early seedling under drought stress and concluded that smaller drought stress induced greater root lengths. The root properties had great correlation only with drought stress and no significant correlation with cultivars or genotypes. In this study, the root characteristics, such as lengths, areas, diameters, volumes and number of roots had also significant correlation with soil moisture levels, but no correlation with cultivars (Table 6). These results meant that root growths from germination to early seedling are most affected by soil moisture levels than genetic factors.
Fractal and lacunarity analyses were applied to characterize the root spatial distributions of sesame under different soil moisture levels. As soil moisture increased, Db value increased and Lac value decreased. The Db results meant that root developed more complex structure under greater soil moisture content. In other words, roots spread out more in various directions and more roots across an image under greater soil moisture condition. The Lac results meant that variations of finding root in each box decreased as soil moisture increased. As sesame develops equal amounts or equal abundance of roots throughout a space, Lac values decreases. Since the roots from 100 and 75% soil moisture content had smaller Lac values, they developed more equally abundant structure across an image than ones from smaller soil moisture contents. Wang et al. (2009) reported that fractal dimension values from rice roots decreased under drought condition, indicating volumes of root system was reduced by water stress. Pierce et al. (2012) found that fractal dimension of plant roots increased as soil was saturated, while lacunarity values were decreased. This study also concluded that more soil moisture induced greater root length and heterogeneity of root system.
All the parameters from fractal analysis and measurements from scanned root images were applied to correlation analysis. The Db parameter had the greatest correlation with number of roots and volume. The Lac parameter had the greatest correlation with root length. Tatsumi (1995) reported that the fractal dimension value was closely related to the branching order or density of lateral roots, but not to the length or area of root system. The complexity of root morphology in rice had a close relation with lateral roots and lateral roots which can be quantified by number of roots were correlated with fractal dimension values. In this study, Db values also had the greatest correlation with number of roots than any other root morphology. Therefore greater Db value may indicate the changes in pattern and increased branching. The Lac values were highly correlated with the lengths of roots. Walk et al. (2004) found that fractal dimension and lacunarity results had the greatest correlation with root length than any other root measurements. Since Lac represents self- similarity of an object, it decreases in this study as root distribution and abundance become similar across an image. Greater soil moisture in germination and early seedling promoted more secondary roots.
Conclusion
In summary, this study found soil moisture contents in germination and early seedling affect root development and characteristics of sesame. Sesame is commonly grown as a dry crop, but it response sensitively to soil moisture contents. Sesame roots developed more lateral and secondary roots under greater soil moisture contents. These observations suggest adequate soil moisture in early development of roots is important for root growth and abundance of sesame. The more growth of roots and heterogeneous of root structures were resulted by greater soil moisture in early development stage of root. Our results suggested that root measurements and fractal analysis to sesame roots extends interpretation of how soil moisture contents affect root system. We suggest that morphological and spatial analysis of root systems may be useful in studying soil moisture and root development relation. In future, these results will be useful for easy comparison methods of root diversity and will be basic data to determination of irrigation amount to sesame cultivation under drought condition.
